Contents lists available atScienceDirect
Agricultural and Forest Meteorology
journal homepage:www.elsevier.com/locate/agrformetWater loss by transpiration and soil evaporation in co
ffee shaded by
Tabebuia rosea Bertol. and Simarouba glauca dc. compared to unshaded co
ffee
in sub-optimal environmental conditions
M.P. Padovan
a,b,c,⁎, R.M. Brook
c, M. Barrios
b, J.B. Cruz-Castillo
d, S.J. Vilchez-Mendoza
b,
A.N. Costa
a, B. Rapidel
b,eaInstituto Capixaba de Pesquisa, Assistência Técnica e Extensão Rural (INCAPER), Afonso Sarlo, 160, Vitoria, Espirito Santo, Brazil bThe Tropical Agricultural Research and Higher Education Center (CATIE), 7170, Turrialba, Costa Rica
cSchool of Environment, Natural Resources and Geography, College of Natural Sciences, Bangor University, Bangor, Gwynedd LL57 2UW, UK dUniversidad Nacional Agraria (UNA), Managua, Nicaragua
eCIRAD, UMR SYSTEM, 34060, Montpellier, France
A R T I C L E I N F O
Keywords: Coffee agroforestry Evapotranspiration Coffee leaf water potential Competition for water
A B S T R A C T
There is increasing concern that due to land pressure and the need to maximize income, smallholder coffee farmers are increasingly being forced to cultivate in areas which are considered to be sub-optimal for coffee. Little is known about optimal coffee and tree combinations in these conditions and the degree to which crops and trees compete or are synergistic. In environmental conditions which were sub optimal for coffee cultivation in Nicaragua (1470 mm annual rainfall, 27 °C mean annual temperature and 455 m altitude compared to optima of 2000 mm, 23–24 °C and altitude between 1000 and 1400 m at that latitude, respectively), coffee and shade tree transpiration and soil evaporation were directly and separately measured in agroforestry (AFS) and full sun systems (FS). AFS was found to be a more efficient water user than FS because a greater proportion of rainfall was used by plant transpiration rather than being lost by soil evaporation. Plant transpiration accounted for 83% and 69% of evapotranspiration while soil evaporation represented 17% and 31%, in AFS and FS respectively. In AFS most of the water transpiration was due to coffee (72.5%) and much less by deciduous Tabebuia rosea (19%) and evergreen Simarouba glauca shade trees (8.5%). Furthermore, the study demonstrated the vastly different behaviour in water use by the shade trees. When in leaf, Tabebuia rosea transpired at four to six times the rate of evergreen Simarouba glauca, although crown sizes were similar. Contrasting precipitation between two con-secutive years of study demonstrated that competition for water between coffee and shade tree occurred only in a severe dry season when coffee leaf water potential (LWP) reached its lowest values of −2.33 MPa in AFS. It was concluded that in most circumstances there was sufficient water for both coffee and trees, that coffee in AFS was a more efficient user of water than FS coffee, and that evergreen Simarouba glauca was more suitable as coffee shade tree compared to deciduous Tabebuia rosea in the sub optimal environmental condition studied.
1. Introduction
There are multiple challenges for coffee production. In Central America, as production expands, smallholder coffee farmers are in-creasingly being forced to cultivate in areas which are considered to be climatically and edaphically sub-optimal for coffee. Coffee production is also being threatened by increasing climate variability. For example, a recent study (Moat et al., 2017) reported that in Ethiopia, a major coffee growing nation, 39–59% of Arabica coffee growing areas could experience climatic change large enough to render them unsuitable for
coffee farming. Coffee shade has been suggested as a promising strategy to cope with the variability of available water and the increase in temperature in the context of global climate changes. Shade trees may buffer the effects of high temperature on coffee understorey (Barradas and Fanjul, 1986; Muschler, 1997; Partelli et al., 2014; Siles et al., 2009) and may increase water availability for plants use by reduction of soil erosion and runoff (Beer, 1995; Gomez-Delgado et al., 2010). On the other hand, shade trees may increase the whole system water use depending on the shade tree species, management, soil and environ-mental conditions. Competition for water between coffee and shade
http://dx.doi.org/10.1016/j.agrformet.2017.08.036
Received 4 April 2017; Received in revised form 22 August 2017; Accepted 25 August 2017
⁎Corresponding author at: Instituto Capixaba de Pesquisa, Assistência Técnica e Extensão Rural (INCAPER), Afonso Sarlo, 160, Vitoria, Espirito Santo, Brazil.
E-mail addresses:mppadovan@hotmail.com.br,padovan@incaper.es.gov.br(M.P. Padovan).
Available online 06 November 2017
0168-1923/ © 2017 Elsevier B.V. All rights reserved.
tree is therefore, potentially one of the main disadvantages of coffee agroforestry (Bayala et al., 2015; Beer, 1987).
The assessment of competition or complementarity in water use in agroforestry systems (AFS) may be facilitated by evapotranspiration partitioning. Evapotranspiration comprises the processes by which water changes phase from a liquid to a gas: evaporation from the soil and transpiration through the stomata of plants (Kool et al., 2014; Wilcox et al., 2003). Transpiration is considered as a productive flux because it is related to plant growth while soil evaporation is regarded as being unproductive once it is lost to the atmosphere and is not used for plant biomass production (Liu et al., 2002).
Agroforestry systems may have a significant effect upon the soil evaporation component and thus water conservation. Evaporation from the soil is principally from the uppermost stratum where mostfine roots are found (Padovan et al., 2015), thereby soil evaporation reduction may increase water retained in the soil and thus the overall proportion of rainfall used productively by crop and trees through transpiration (Zheng et al., 2015). Soil surface evaporation rates may be influenced by soil moisture (Liu et al., 2002; Wilson et al., 2000), as well as the thickness of litter layer (Villegas et al., 2010; Wei et al., 2015). In agroforestry, shade trees may reduce incident radiation and thus tem-perature of the soil surface with concomitant decrease of water loss by soil evaporation (Ilstedt, 2016) which may vary with the degree of canopy cover and trunk proximity (Wallace et al., 1999). In coffee agroforestry the effects of increasing shade tree density on the gradual reduction of soil evaporation was reported by Lin (2007). However, apart from this study no other soil evaporation measurements have been found in coffee agroforestry.
Transpiration, as the dominant component of evapotranspiration (Lawrence et al., 2006; Xu et al., 2008) has been assessed and compared in coffee in an agroforestry system (AFS) and unshaded full sun (FS) coffee in environments more suitable for coffee growing.Van Kanten and Vaast (2006) demonstrated that coffee transpiration was often greater in the full sun while the whole system water use was greater in the shade. Also, the variability of water use by the whole system was found to be dependent on shade tree species associated with coffee. Cannavo et al. (2011)showed that the higher water use by coffee and shade trees through transpiration plus water loss by interception re-sulted in lower drainage when compared to full sun coffee. However, despite water dynamics and use being significantly affected by shade trees little is known about water use of the whole coffee agroforestry system since most studies address one or another evapotranspiration component. Studies that integrate soil surface evaporation and plant transpiration in coffee agroforestry with appropriate techniques for both components are missing.
Here we studied the contribution of coffee and shade tree tran-spiration and soil evaporation to the total evapotrantran-spiration in a coffee agroforestry system established in a sub-optimal environment by mea-suring each component directly. We also compared the water con-sumption by deciduous Tabebuia rosea and evergreen Simarouba glauca grown as coffee shade trees. Neither of these species have been studied in association with coffee. The results contribute to a better under-standing of water allocation within the agroforestry system and coffee responses to moisture variability. This is important in order to identify shade trees ideotypes and possible management interventions which are more suitable for coffee agroforestry in the context of scarce water resources.
2. Materials and methods
2.1. Site description and experimental design
The study was carried out from February 2012 to April 2014 in an experiment located at Jardín Botánico, Masatepe, Department of Masaya, southern Nicaragua (11° 53′ 54″ N, 86° 08′ 56″ W) at a long term research site managed by the Centro Agronómico Tropical de
Investigación y Enseñanza (CATIE), jointly with the Universidad Nacional Agraria (UNA), Federación Cooperativas de Ahorro y Crédito (CENECOOP-FEDECARUNA) and Instituto Nicaraguense de Tecnologia Agropecuaria (INTA). The experiment was established in 2000, as de-scribed byHaggar et al. (2011).
Coffee growing by smallholder farmers in Nicaragua is extending into less favorable areas as farmers seek to enhance their livelihood options by growing cash crops, despite the sub-optimal edaphic and climatic conditions. The site is located in a coffee growing region, at 455 m a.s.l. which is considered to be rather a low altitude for arabica coffee (Coffea arabica L.) at this latitude, due to mean annual tem-perature being 27°C which is high for C. arabica. Long term mean an-nual rainfall is 1470 mm, well below the optimum precipitation of 2000 mm. From 85% to 97% of the total annual precipitation falls over the wet season that lasts from May to November while a pronounced seasonal drought occurs from late November to mid-May (Vogel and Acuña Espinales, 1995).
Soils in the area are predominantly characterized as Andisols, de-rived from volcanic ejecta. These soils are typically deep, well drained and have high organic matter content, low bulk density, high allophane content and consequently a high phosphorusfixation capacity, high amorphous mineral content and high water retention capacity (FAO, 2001). On this particular study site, however, soils are characterized by the presence of an indurated layer locally known as talpetate. Such layers occur in about 15% of the Nicaragua Pacific region. Its properties reflect both geologic and soil-forming processes and can be extremely variable in nature (Vogel and Acuña Espinales, 1995).
The experimental design for this study had to be adapted to the layout of existing plots and consisted of a full sun monocrop coffee (FS) plot (1440 m2) and an adjacent coffee agroforestry system (AFS) plot (3200 m2), and is described in more detail inPadovan et al. (2015). Sub-plots for sampling were established within these main plots, as pseudo-replicates. In the coffee agroforestry system plot Coffea arabica L. (variety“Pacas”, which is adapted to hot and dry environments) was associated with a mixture of Simarouba glauca DC. (Simaroubaceae) and Tabebuia rosea (Bertol.) (Bignoniaceae) planted as shade trees. Tree spacing was originally 4 m x 4 m, alternating both species (Haggar et al., 2011), but tree density has been reduced over time by thinning to achieve a shade level appropriate for coffee production. The mean density of Tabebuia rosea was 113 trees ha−1and Simarouba glauca was 75 trees ha−1over the period of the study. Main characteristics of the shade tree species are presented onTable 1.
Coffee density throughout of the experiment was 4000 plants ha−1, spacing being 2 m between rows and 1.25 m between plants in both the AFS and FS coffee. Coffee plants were pruned periodically in ac-cordance with standard agronomic practice. Management includes fertilization with 37.3 kg ha−1 of N, 48.8 kg ha−1 of P and 27.6 kg ha−1of K as NPK compound fertilizer per year applied during the wet season in July and September. In addition 34.4 kg ha−1of N as urea and 12 kg ha−1of K as KCl are applied each year in November.
2.2. Climate
Two automatic weather stations were installed in the FS and AFS plots. Sensors installed at 2.50 m height were connected to dataloggers (CR1000, Campbell Scientific Inc.). Data were collected every 30 min from February 2012 to May 2014. Both weather stations measured relative humidity and temperature (HMP50, Campbell Scientific Inc.) and the FS plot weather station additionally measured solar radiation (CS300, Campbell Scientific Inc.), wind speed (03101, Campbell Scientific Inc.) and rainfall (TE525MM/TE525 M, Campbell Scientific Inc.). Reference evapotranspiration was calculated based on the FAO Penman-Monteith equation (Allen et al., 1998) using data from the automatic weather station installed in the FS plot.
2.3. Soil water content
Changes in the soil water content were continuously measured from February 2012 to May 2014 by using time domain reflectometer (TDR) probes (CS616, Campbell Scientific Inc.) connected to dataloggers (CR 1000 with AM 16/32 B multiplexer, Campbell Scientific Inc.). These were installed horizontally, being inserted at depths from 0.15 m to 1.90 m into the walls of 2.0 m deep pits, which were then back-filled. Deployment of TDR probes had to be adapted to the very variable edaphic conditions of the experimental site. Distance between TDR probes depended on the depths of the characteristic soil layers, which were quite variable in the study area. Besides the talpetate, the soil profile consists of three other main layers distinguished by colour: brown (uppermost layer), reddish (usually above the talpetate) and a yellowish, granular layer, under the talpetate. At 1.60–2.0 m depth, there is a dark granular compact layer, without organic content, where neither roots (Padovan et al., 2015) nor fractures were observed, so for the purposes of this paper, extraction of water by roots was assumed to have occurred in the 0–2.0 m horizon. Four to six TDR probes per pit were inserted in a total of nine pits (three pits in the FS plot and six in the AFS plot). Data were scanned every minute and stored every 30 min. To determine volumetric soil water content from the TDR signal (travel time on the probe rods), calibration equations were de-rived from extracted monoliths for each soil layer, following a protocol adapted fromUdawatta et al. (2011). The volumetric soil water con-tents of the layers in which each TDR probe was inserted were then multiplied by the thickness of each layer to calculate the SWR at each time step.
2.4. Coffee and tree leaf area index
Leaf area of coffee plants was measured in the dry (February and April) and wet seasons (July and November) during 2012 and 2013, at the same time as transpiration measurements. We measured the leaf area of a sample of 30 and 35 typical coffee shoots in the FS and AFS plots, respectively, as well as the leaf area of the shoots sampled for transpiration measurements. Shoots were purposively selected by stra-tifying the whole shoot population using their height and diameter in both stands. We counted the total number of leaves, and measured length and width of every 20th leaf. The area of measured leaves was calculated by using the equation: Leaf area = 0.7243 * length * width, derived from C. arabica leaves in the laboratory, leaf area being mea-sured with a leaf area meter (LI 3100C, LI-COR Inc.). Leaf area of each shoot was then calculated by multiplying the number of leaves by the mean leaf area. LAI of the coffee plots were estimated by multiplying the mean leaf area of the shoots by coffee population density and by the mean number of shoots per coffee plant.
Tree leaf area was determined by using the hemispherical photo-graph technique on four trees of each species four times per year (February, April, July and November) in 2012 and 2013. Hemispherical
photographs of the tree canopy were taken by using an upwards pointing Nikon Coolpix 4500 digital camera with afisheye lens. Images were analyzed using the Gap Light Analyzer software (Frazer et al., 1999). In order to correct for the effect of branch traces in the images, hemispherical photographs of leafless Tabebuia rosea canopy in the dry season were taken and the area subtracted from photographs of ca-nopies in leaf. The branch architecture of the two tree species was as-sumed to be similar. The effect of the distance between lens and tree crown was corrected by multiplying the number of the pixels of the image by the square of the distance between lens and crown. Calibra-tion of this indirect method was carried out by cutting down four ty-pical specimens of each species from outside the experimental plots and harvesting their leaves. Planimetric and gravimetric techniques were applied as inJonckheere et al. (2004).
The quadratic regressions for leaf area as a function of the propor-tion of black pixels in the tree monochrome image of Tabebuia rosea was y =−0.0389 ×2+ 16.81 x (R2= 0.89) and for Simarouba glauca was y =−0.045 ×2+ 5.25 x (R2= 0.72), and were used to calculate leaf areas from the hemispherical photographs of the four trees during the two year experimental period. The leaf area index was calculated by using tree population density.
2.5. Shade density
Tree canopy shade density was obtained by using a model C sphe-rical densiometer (Forest Suppliers Inc., USA) which consist of a convex mirror divided into a twenty-four square grid. We counted the areas on the squares surfaces that were covered by the canopy taking four readings in each cardinal direction from four sampling points in the shaded plot. The sum of each one of the 24 grid square measurements in each direction were divided by four and multiplied by 1.04 to obtain the estimated overstory density percentage (Lemmon, 1956). Mea-surements were carried out twice each in the dry (February and April) and in the wet seasons (July and November) in 2012 and 2013. 2.6. Coffee and tree transpiration
Coffee sap flow was measured in the dry (February and April) and wet seasons (July and November) in 2012 and 2013 by using the stem heat balance method (Dynagage/Dynamax, Inc.) in four coffee shoots at a time in each plot. This method had been successfully calibrated pre-viously in the laboratory against direct measurement of water loss in potted coffee plants byRapidel and Roupsard (2009). The coffee shoots measured were representative of the average of the shoot diameters in both stands which was 29.4 mm and 30.7 mm in the full sun and shade coffee respectively. SGB 19, 25 and 35 gauges were connected to a Flow32 system (Dynamax Inc., equipped with a Campbell Scientific CR 10 X datalogger) and coffee shoots were monitored over an average period of six consecutive days, four times per year in 2012 and 2013. Coffee stems were protected against external heat and water ingress by
Table 1
Main characteristics of the two shade tree species in the study site: Tabebuia rosea and Simarouba glauca, over the period of the experiment. Standard error of the mean in brackets. Tabebuia rosea Bertol. Simarouba glauca DC.
Distribution Central America, Mexico, Venezuela and coastal Ecuador Tropical and sub-tropical regions of Central America, Mexico and the Caribbean
Density (tree ha−1) 113 75
Phenology deciduous evergreen
Leaf morphology compound leaves, digitate and long petiolate. Each leaf hasfive leaflets of variable size
compound leaves 20 cm in length comprising 12–16 oblong pinnae, each approximately 5 cm in length
Leaf texture rough waxy
Bark depth (cm) 1.5 (0.27) 0.92 (0.04)
Bark texture fissured smooth
DBH (cm) 28.7 (0.41) 25.5 (0.23)
Heigh (m) 15.5 (0.20) 17 (2.43)
Crown area (m2) 44.4 (7.8) 41.2 (3.24)
thermal shields and upper waterproof protection. The heat source was turned off at night in order to protect the stems from overheating. Data were collected every 15 min. Leaf specific transpiration for each shoot was calculated by dividing the waterflow (L d−1) per shoot leaf area. Coffee transpiration was scaled up to plot level (mm d−1) by using leaf area index (LAI).
Tree sap flow rates were continuously measured over 2012 and 2013 by using the thermal dissipation technique (Granier, 1985; Granier, 1987) in four trees of each species. Trees were selected taking into account the average stem diameters in the plot, which were 0.258 m and 0.235 m for Tabebuia rosea and Simarouba glauca respec-tively. The set of probes (one continuously heated by a constant elec-trical source and the other as a non-heated reference probe) were in-serted horizontally into tree stems (22 mm deep at 2.5 m height above the ground) with a vertical separation between probes of 150 mm. The heated probe was connected to a potentiometer and powered with a 137 mA continuous current. Trunks were insulated 1.0 m above and below the probes. The natural thermal gradients between the probes were measured when sensors were run with the heaters off for 10 days in March 2012, and the signals were thereafter corrected for these gradients. The temperature gradient between the probes was recorded on a datalogger CR 800 (Campbell Scientific Inc.) every 30 min from February 2012 to December 2013. The sap flow was calculated by multiplying theflow density by the conducting section area (Smith and Allen, 1996). Regression analysis by using measurements of conductive cross sectional sap wood area and the stem diameter from the four trees of each species that were cut down allowed the calculation of coeffi-cients to estimate the conducting section for Tabebuia rosea (R2= 0.69) and Simarouba glauca (R2= 0.89) (Vertessy et al., 1995). Probes re-corded the mean sapflow rate over the conducting cross section.
Calibration of thermal dissipation probes was undertaken by mea-suring the sap flow of the same trunks using the stem heat balance method (Dynagage/Dynamax, Inc.) over eight days in different periods in 2012 and 2013. Although this is a direct measurement technique, this method was applied only over restricted periods in order to avoid tree stems damaged by overheating. Gauges (SGA 150) were connected to a datalogger CR 800 (Campbell Scientific Inc.) and data were re-corded every 15 min. For each species the coefficient α for the Granier equation was adjusted by optimization to reduce the sum of squares of the differences between the thermal dissipation and the stem heat balance measurements from different periods. Mean tree transpiration of each species was multiplied by Tabebuia rosea and Simarouba glauca population density to obtain transpiration in the AFS plot.
2.7. Soil evaporation
Measurements were conducted by using seven and eight weighed lysimeters in the FS and AFS plots respectively, over the 2012 dry season (April), 2012 (May to June) and 2013 (June to November) rainy seasons and continuing into the 2014 dry season (March to April). Lysimeters were located in the row between coffee plants and in the inter row in both plots. Lysimeters were made from PVC tubes (157 mm internal diameter and either 200 or 300 mm length) adapted from Jackson and Wallace (1999). These werefilled by soil that was packed to the same volume as before and therefore with similar bulk density and replaced into the holes (Daamen et al., 1995). A mesh was attached at the bottom of the tubes in order to allow excess water to drain. We used a barrier made by zinc foil (28 mm) around the threshold of the lysimeter and the internal soil wall to avoid soil falling inside the hole when the lysimeters were removed for the weighing process. Lysimeters were weighed every morning before 07:00 using a portable electronic balance (0.1 g resolution). Lysimeters were installed 6 months before the beginning of the measurements, allowing the soil surface to become as similar to the surrounding soil as possible. Litter fall layer (g m−2) was measured in August 2012 at 30 and 15 sample points at different distances from the coffee trunk (20 cm; 60 cm; 100 cm) in AFS and FS,
respectively. Sample points in AFS were located beneath each shade tree species in the plot.
Due to the difficulties inherent in measuring evaporation gravime-trically from the soil surface where there is confounding with drainage, we did not include in our analysis periods immediately following rainfall events (Wilson et al., 2001). Periods for analysis were selected taking into account an interval of at least 24 h after a rainfall event even if relatively small. The Ritchie model (Ritchie, 1972) was used to in-terpolate these measurements of soil evaporation rate over the whole period of study in FS and AFS. This model has formed the core of soil evaporation modeling in the main current crop model: DSSAT (Jones et al., 2003) and APSIM (Keating et al., 2003). The Ritchie model considers soil evaporation to occur in two stages: 1) a constant rate stage which depends on the radiative energy that reaches the soil sur-face; 2) a falling rate stage in which soil evaporation depends on up-ward water movement in the soil profile dependent on soil hydraulic properties. After calibration with actual data, the evolution of the evaporation rate in this second stage is just considered as a function of (time)−1/2. The first stage calculation was determined by potential evaporation estimated by the FAO Penman-Monteith equation (Allen et al., 1998) with inputs from the weather station in the FS system and assumed to be the same over the adjacent AFS plot. Net radiation and LAI were used as inputs for net radiation at the soil surface calculation in FS and AFS at thefirst stage, followingRitchie (1972). The coeffi-cients of the Ritchie model were then calibrated to minimize the sum of squares of errors between measured and calculated evaporation rates. 2.8. Leaf water potential
Coffee Leaf Water Potential at predawn (PLWP) and at midday (MLWP) were measured and compared in FS and AFS using a portable pressure chamber (Scholander et al., 1965). The measurements were taken over a three consecutive day period, four times per year, two being during the dry season (February and April) and two in the wet season (July and November) in 2012 and 2013. Four mature and fully expanded leaves with their petioles were selected at random in the upper third of the bushes of three coffee plants in each plot. The measurements were performed in the field immediately after cutting the leaves, before sunrise for PLWP and between 12:00 and 12:30 for MLWP.
2.9. Data analysis
Variance analysis was performed to compare the influence of the systems, seasons and tree species on soil water content in the treatments by using a general linear mixed-effects model (R, lme4 package,Bates et al. (2015)). The same model was utilized to assess and compare coffee and tree transpiration as a function of years, systems and seasons as well as the effect of the interactions of variables. The model was also applied to compare statistical differences in LWP. Soil evaporation was also analyzed as a function of LAI, lysimeter locations, systems and seasons. Analysis were carried out by using InfoStat software (Di Rienzo, 2014).
3. Results 3.1. Climate
Total annual rainfall was 968 mm in 2012 and 1312 mm in 2013 being respectively 34% and 11% lower than the long-term mean annual rainfall of 1470 mm in that region. The 2012 dry season lasted from the beginning of January until mid-May with a maximum daily rainfall event of 16.8 mm and a total rainfall of 57.2 mm. The scant 2012 wet season produced lower than normal precipitation and was followed by the 2013 dry season which lasted almost six months, with only 23.5 mm rainfall overall (Fig. 1). Thus, it was expected that the coffee growing
systems were constrained by moisture deficit, particularly during the 2013 dry season.
Daily reference evapotranspiration (ET0) calculated with inputs from the automatic weather station installed in the FS plot, was similar between years (p = 0.06) but differed between seasons (p < 0.0001) with means of 3.8 mm d−1(S.E. = 0.05) and 3.3 mm d−1(S.E. = 0.04) in the dry and wet seasons, respectively. Maximum reference evapo-transpiration of 5.39 mm d−1 was attained in the 2012 dry season (Fig. 1). Vapour pressure deficit (VPD) was found to be similar between FS and AFS (p = 0.47). VPD did not vary between years (p = 0.08) but differed with seasons (averages of 0.40 kPa (S.E. = 0.01) and 0.78 kPa (S.E. = 0.01) in the wet and dry seasons, respectively, p < 0.0001).
3.2. Soil water reserve (SWR)
Mean SWR from the three and six trenches in FS and AFS, respec-tively, averaged over the 2000 mm soil profile was greater in 2012
compared to 2013 in the wet (p = 0.004) and dry seasons (p = 0.001). In the wet periods mean SWR was 797 mm (S.E. = 6.9) and 769 mm (S.E. = 6.8) while in the dry seasons was 693 mm (S.E. = 7.0) and 652 mm (S.E. = 6.2) in 2012 and 2013, respectively. Comparing treatment effects, mean soil water reserve in the whole profile was lower in AFS when compared to FS coffee (p < 0.05) with 753 mm (S.E. = 6.8) and 813 mm (S.E. = 6.8) in the wet seasons and with 640 mm (S.E. = 6.6) and 704 mm (S.E. = 6.6) in the dry seasons, re-spectively. Mean SWR over a period of a month was greater in AFS in only one instance at the end of 2013 wet season (November) when it reached 989 mm (S.E. = 4.3) while in FS it was 933 mm (S.E. = 4.3). The maximum value of SWR during this period was 1018 mm (S.E. = 17) and 961 mm (S.E. = 43) in AFS and FS, respectively. The minimum value of SWR was recorded at the end of 2013 dry season when it declined to 452 mm (S.E. = 13) in AFS which represented 12% lower SWR than in FS during the same period (Fig. 2).
Fig. 1. Daily rainfall and reference evapotranspiration over the period of the experiment.
3.3. Coffee and tree leaf area index and shade density
LAI of coffee plants was always greater in AFS compared to FS (p < 0.001), averaging 2.39 (S.E. = 0.10) and 3.57 (S.E. = 0.10) in FS and AFS respectively. Coffee LAI seasonal patterns showed a strong decrease during the whole duration of the dry periods and afterwards increased in the wet seasons in both systems, although this recovery was much delayed after the severe dry period of 2013. Mean coffee LAI
ranged from 2.88 (S.E. = 0.05) to 5.01 (S.E. = 0.07) in the dry and wet seasons respectively in AFS coffee while in FS it varied from 1.68 (S.E. = 0.02) in the dry to 3.73 (S.E. = 0.12) in the wet seasons (Table 2).
Tree LAI varied with shade tree species, ranging on average from 0.46 (S.E. = 0.16) for Simarouba glauca to 0.62 (S.E. = 0.12) for Tabebuia rosea. Tree LAI of both species also varied with the seasonal dynamics (p < 0.001). In deciduous Tabebuia rosea LAI dropped to zero in April with mean LAI ranging between 0.13 (S.E. = 0.10) in the dry to 1.12 (S.E. = 0.09) in the wet seasons. In evergreen Simarouba glauca LAI remained more stable with a mean of 0.44 (S.E. = 0.004) in the dry while in the wet it was 0.48 (S.E. = 0.01) (Table 2).
Mean tree canopy cover was 57.3% of full irradiance over the period of study. Shade density did not differ between years (p = 0.60) and seasons (p = 0.14) (Table 3).
3.4. Coffee and tree transpiration
Coffee transpiration on a leaf area basis differed between systems (p < 0.001) and was greater in FS (0.78 L d−1m−2S.E. = 0.02) compared to AFS (0.60 L d−1m−2S.E. = 0.02) averaged over the period of study. Coffee transpiration on a leaf area basis was influenced by the seasonal pattern being typically greater (p < 0.001) in the dry periods (February and April) compared to the wet periods (July and November) in both systems. In AFS mean coffee transpiration rate varied from 0.44 L d−1m−2 (S.E. = 0.02) to 0.59 L d−1m−2 (S.E. = 0.02) and in FS from 0.56 L d−1m−2(S.E. = 0.03) to 0.81 L d−1m−2(S.E. = 0.03) in the wet and dry seasons respectively. Coffee transpiration differed in the two years studied (p < 0.001) in both systems. In AFS coffee transpiration per unit leaf area was reduced from 0.68 L d−1m−2 (S.E. = 0.04) in 2012 to –0.43 L d−1m−2 (S.E. = 0.05) in 2013 while in FS it varied from 0.92 L d−1m−2 (S.E. = 0.08) to 0.55 L d−1m−2(S.E. = 0.08) in 2012 and 2013, re-spectively (Fig. 3).
Over the time course of a day a comparison of coffee transpiration between both systems showed a tendency to a longer peak in AFS in dry conditions (Fig. 4). In the 2012 dry season, in AFS coffee transpiration reached a peak at 10:00 that was then constant until 12:00 when it started to decline while in FS the peak was reached at 11:00 and de-clined at 11:30 (Fig. 4a).
Table 2
Leaf area index of full sun coffee (FS) (n = 30), coffee agroforestry (AFS) (n = 35), Tabebuia rosea (n = 4) and Simarouba glauca (n = 4) in the dry (February− April) and wet seasons (July− November) in 2012 and 2013. The standard error of the means are in brackets.
Coffee FS Coffee AFS Tabebuia rosea Simarouba glauca Feb 2012 1.65 (0.27) 2.27 (0.31) 0.39 (0.10) 0.37 (0.18) April 2012 1.43 (0.18) 2.82 (0.36) 0.01 (0.03) 0.43 (0.27) July 2012 2.99 (0.27) 5.42 (0.53) 1.35 (0.17) 0.60 (0.12) Nov 2012 4.28 (0.36) 5.40 (0.50) 1.43 (0.23) 0.56 (0.15) Feb 2013 2.86 (0.28) 4.60 (0.50) 0.08 (0.03) 0.50 (0.14) April 2013 1.35 (0.13) 2.49 (0.37) 0.00 (0.00) 0.35 (0.10) July 2013 2.11 (0.19) 3.12 (0.37) 0.33 (0.15) 0.35 (0.12) Nov 2013 4.11 (0.35) 5.65 (0.77) 1.39 (0.26) 0.53 (0.19) Table 3
Mean tree canopy cover as a percentage of full irradiance (standard error of means in brackets) in the dry (February and April) and wet seasons (July and November) in 2012 and 2013. shade density % Feb 2012 54.5 (0.90) April 2012 47.5 (1.23) July 2012 69.0 (2.65) Nov 2012 66.4 (3.89) Feb 2013 56.3 (2.36) April 2013 49.1 (2.96) July 2013 44.8 (3.33) Nov 2013 70.7 (0.83)
Fig. 3. Mean daily coffee transpiration on a leaf area basis in FS and AFS in the dry (February- April) and wet seasons (July-November) in 2012 and 2013. Reference evapotranspiration is presented in the same periods except in February 2012 due to missing data. Bars represent the standard error of the mean.
Fig. 4. Typical diurnal trends in coffee transpiration on a leaf area basis from mean of four coffee trees each in FS and AFS over five consecutive days in the 2012 dry (a) and wet season (b) and 2013 dry (c) and wet season (d), compared with VPD. Bars represent the standard error of the mean.
Fig. 5. Plot level mean daily coffee transpiration (mm d−1) in FS and AFS and reference evapotranspiration in the dry (February-April) and wet seasons (July-November) in 2012 and
In the 2013 dry season coffee transpiration in AFS stabilized around 11:30 until 13:30 while in FS transpiration declined rapidly after the peak (Fig. 4c). Mean coffee transpiration reached maximum values of 0.31 L h−1m−2in FS and of 0.24 L h−1m−2in AFS in 2012 dry season with VPD of 1.7 kPa and 1.3 kPa respectively. In the 2013 severe dry season, although the highest values of 2.9 VPD were recorded, the maximum transpiration rate was reduced to 0.21 L h−1m−2and 0.13 L h−1m−2in FS and AFS respectively (Fig. 4c), probably due to the over-riding effect of low soil water availability.
By the middle of wet season (July) coffee transpiration rate tended to be lower in both systems. The lack of a system effect observed in 2013 (Fig. 4d) when coffee transpiration was around 0.05 L h−1m−2in both systems is in agreement with similar soil water reserves observed at that time (p = 0.067), being 723 mm (S.E. = 12.2) in FS and 684 mm (S.E. = 12.2) in AFS. In contrast, in the same period in 2012, soil water reserves differed between systems (p = 0.0001), being 758 mm (S.E. = 2.1) in FS and 694 mm (S.E. = 2.1) in AFS when coffee transpiration reached maximum values at 0.13 L h−1m−2and 0.07 L h−1m−2in FS and AFS, respectively.
When scaled up to plot level, coffee transpiration was generally greater in AFS. Mean coffee transpiration varied between 1.43 mm (S.E. = 0.24) and 2.74 mm (S.E. = 0.13) and between 1.32 mm (S.E. = 0.25) and 1.34 mm (S.E. = 0.14) in the dry and wet seasons in 2012 and 2013, respectively, in the FS plot. In the AFS plot mean coffee transpiration ranged between 1.81 mm (S.E. = 0.42) and 2.32 mm (S.E. = 0.30) and between 1.65 mm (S.E. = 0.15) and 1.80 mm (S.E. = 0.24) in the dry and wet seasons in 2012 and 2013, respectively (Fig. 5).
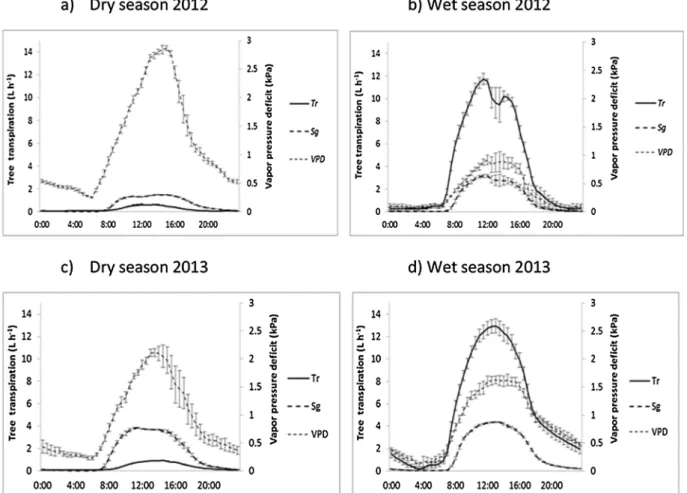
Tree transpiration varied with shade tree species, seasonal pattern and environmental conditions. Deciduous Tabebuia rosea transpiration was highly influenced by seasonal pattern compared to evergreen Simarouba glauca. In the 2012 wet season, typical daily transpiration per Tabebuia rosea tree ranged from 100 to 170 L d−1, whilst in the 2013 wet season the typical transpiration ranged from 60 to 100 L d−1. In contrast, by the end of the dry seasons Tabebuia rosea daily tran-spiration declined to 6.9 L d−1 (S.E. = 0.06) and 4.3 L d−1 (S.E. = 0.19) in 2012 and 2013, respectively. On the other hand, Simarouba glauca displayed more constant water consumption that varied little, from 25 L d−1(S.E. = 1.59) to 29 L d−1(S.E. = 1.26) in the wet and dry season, respectively (Fig. 6).
Comparison between daily Tabebuia rosea and Simarouba glauca diurnal patterns of water consumption averaged overfive consecutive days compared with VPD showed that in the wet seasons tree
transpiration tended to reflect the trend in VPD (Fig. 7b and d). Tabe-buia rosea reached its maximum transpiration rate at 12.9 L h−1and 11.7 L h−1while Simarouba glauca reached a maximum 4.3 of L h−1 and 3.2 L h−1in 2012 and 2013 wet seasons when VPD ranged from 1.6 kPa and 0.9 kPa respectively. However, in the dry seasons despite the greater VPD which reached between 2.1 kPa and 2.8 kPa, tran-spiration declined to 0.90 L h−1and 0.60 L h−1in Tabebuia rosea and to 3.84 L h−1and 1.49 L h−1in Simarouba glauca in 2012 and 2013 re-spectively (Fig. 7a and c). As a deciduous tree species Tabebuia rosea daily transpiration showed great difference between both years and seasons while evergreen Simarouba glauca did not.
At the plot level Tabebuia rosea mean daily transpiration rate varied between 0.24 mm d−1(S.E. = 0.16) and 1.05 mm d−1(S.E. = 0.21) in the dry and wet seasons, respectively, while Simarouba glauca mean daily transpiration did not change between seasons with an average of 0.20 mm d−1throughout (S.E. = 0.02) (Fig. 8).
3.5. Soil evaporation
Evaporation from the soil surface differed according to the season (p = 0.001) with a mean of 2.22 mm d−1 (S.E. = 0.06) and 0.58 mm d−1(S.E. = 0.05) in the wet and dry season respectively. In the dry seasons (April 2012 and March − April 2014) soil surface evaporation did not vary between systems (p = 0.55) nor with location of lysimeters in the row or interrow (p = 0.15). Soil evaporation ranged from an average of 0.53 mm d−1 (S.E. = 0.04) to 0.45 mm d−1 (S.E. = 0.04) in FS and AFS, respectively, as a result of the sparse rainfall events and consequent dry soil in the lysimeters. In contrast to the dry monitoring periods, during the wet period, lysimeters located in the interrow showed higher evaporation rates than the lysimeter in the coffee row (p = 0.01). Mean soil evaporation in the wet periods as May-June in 2012 and May-November 2013 exhibited greater rates in FS compared to AFS (p = 0.01), being 2.50 mm d−1(S.E = 0.14) and 1.98 mm d−1(S.E. = 0.14), respectively.
The litter fall layer differed between systems (p = 0.001) with mean 1009 g m−2 (S.E. = 57) and 489 g m−2 (S.E. = 81) in AFS and FS, respectively. The litter layer was found to be similar between distances from the coffee trunk in FS (p = 0.71) and in AFS (p = 0.33). In AFS no significant difference in the litter amount was found beneath both shade tree species in the plot (p = 0.8).
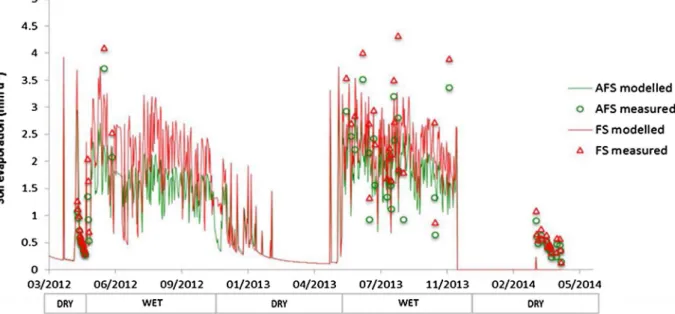
Soil evaporation over the whole two-year measurement period was calculated byfitting the Ritchie soil evaporation model (Ritchie, 1972) to our measured data (Fig. 9). Simulations showed that water loss by
soil evaporation was far from negligible and represented 44% and 12% of incident rainfall in wet and dry season, respectively.
The relationship between soil evaporation measured and modelled was linear with R2= 0.58 (p < 0.0001) and R2= 0.69 (p < 0.0001)
in AFS and FS, respectively. The slope differed significantly between systems (p < 0.0001) with 0.79 (S.E. = 0.09) and 0.99 (S.E. = 0.09) in AFS and FS, respectively (Fig. 10a and 10 b). Model performance showed RMSE values of 0.45 in AFS and 0.48 in FS, while Nash-Sutcliffe
Fig. 8. Mean tree transpiration on a plot basis (left axis) and reference evapotranspiration (right axis) in the dry (Feb-April) and wet seasons (July-Nov) in 2012 and 2013. Reference evapotranspiration is presented in the same periods except in February 2012 due to missing data. Bars represent the standard error of the mean.
Fig. 7. Typical diurnal patterns of transpiration (L h−1) by Tabebuia rosea (Tr) and Simarouba glauca (Sg) trees and VPD (kPa) from mean offive consecutive days in the 2012 dry (a) and wet seasons (b) and in the 2013 dry (c) and wet seasons (d). Bars represent the standard error of the mean.
Efficiency (Nash and Sutcliffe, 1970) was 0.54 and 0.59 respectively. 3.6. Coffee leaf water potential (LWP)
Predawn leaf water potential (PLWP) and midday leaf water po-tential (MLWP) in FS and AFS are presented for the dry and wet seasons over the period of study inFig. 11. We demonstrated that predawn leaf water potential (PLWP) was similar between systems in dry (p = 0.22) and wet (p = 0.30) seasons except in April 2013 when the severe dry season occurred and mean PLWP reached −1.09 MPa (S.E. = 0.09) and−1.93 MPa (S.E. = 0.13) in FS and AFS, respectively. Midday leaf water potential (MLWP) was often similar in the dry (p = 0.74) except in February 2012 when mean MLWP reached−1.36 MPa (S.E. = 0.11) in FS and −0.76 MPa (S.E. = 0.11) in AFS. MLWP differed between systems in the wet season (p = 0.0002) and was lower in FS compared to AFS with an average of− 0.78 MPa (S.E. = 0.05) and − 0.58 MPa (S.E. = 0.05) respectively, over the period of study (Fig. 10). MLWP tended to be more negative when VPD was greater and the SWR was limited, which corresponded with high correlation coefficients of r =− 0.90 and r = 0.97 between MLWP and VPD and SWR, respec-tively. By the end of the 2013 severe dry season the lowest values of both PLWP and MLWP were observed in AFS. In FS it was found −1.0 MPa (S.E. = 0.09) and −1.93 MPa (S.E. = 0.12) while in AFS it
was−2.04 MPa (S.E. = 0.12) and −2.33 MPa (S.E. = 0.05) for PLWP and MLWP, respectively (Fig. 11).
3.7. Total evapotranspiration
Mean evapotranspiration rate was not significantly different be-tween systems (p = 0.270) with 3.48 mm d−1 (S.E. = 0.53) and 2.61 mm d−1 (S.E. = 0.53) in AFS and in FS, respectively (Table 4). With respect to seasonal effects, evapotranspiration was estimated for both systems in February (middle of dry season), April (end of the dry season), July (middle of wet season) and November (end of the wet season) in 2012 and 2013. Due to missing data on coffee transpiration in November 2012 (equipment malfunction), we decided to exclude the total evapotranspiration estimation for that period (Table 4).
In the partitioning of evapotranspiration, transpiration was the most important contributor to water loss compared to soil evaporation in both systems. Transpiration accounted for 83% and 69% of evapo-transpiration while soil evaporation represented 17% and 31% in AFS and FS respectively. Evaporation from the soil surface represented 50% and 33% of total evapotranspiration in the wet season while in the dry season it was reduced to 20% and 12% in FS and AFS respectively. Transpiration varied from 67% to 50% and from 88% to 80% of eva-potranspiration in the wet and dry seasons in AFS and FS respectively.
Fig. 9. Daily soil evaporation rate measured and modelled using the Ritchie soil evaporation model (Ritchie 1972), in FS and AFS from April 2012 to April 2014. LAI data are required to compute Ritchie model; therefore, we could not perform the calculation between December 2013 and March 2014.
Plot scale transpiration partitioning in AFS demonstrated that coffee transpiration was typically the greatest fraction compared to tree transpiration (Table 5). On average coffee transpiration comprised 72.5% of the total transpiration in AFS while Tabebuia rosea and
Simarouba glauca each represented 19% and 8.5% of the total. Also, coffee transpiration as a proportion of the total transpiration of the system tended to greater values when Tabebuia rosea water require-ments were low in the dry periods (April 2012 and February-April 2013).
Fig. 11. Mean coffee leaf water potential at predawn and midday from three days consecutive measurements in the dry (February and July) and wet seasons (July and November) in 2012 and 2013. Bars represent the standard error of the mean.
Table 4
Evapotranspiration calculated from transpiration plus soil evaporation in a plot basis (with the standard error of the means in brackets) and as percentage of evapotranspiration in FS and AFS in February, April and July in 2012 and in February, April, July and November in 2013. Reference evapotranspiration is presented in the same periods except in February 2012 due to missing data.
Transpiration Soil Evaporation Evapotranspiration ET0
FS AFS FS AFS FS AFS
mm d−1 % mm d−1 % mm d−1 % mm d−1 % mm d−1 mm d−1 mm d−1 Feb 2012 1.40 (0.22) 68 2.33 (0.22) 78 0.65 (0.22) 32 0.63 (0.21) 21 2.05 (0.44) 2.97 (0.43) April 2012 1.46 (0.26) 88 2.55 (0.66) 92 0.21 (0.003) 12 0.22 (0.005) 8 1.67 (0.27) 2.77 (0.66) 4.77 (0.19) July 2012 2.74 (0.13) 58 3.76 (0.37) 70 1.96 (0.27) 42 1.63 (0.09) 30 4.69 (0.39) 5.39 (0.47) 3.68 (0.15) Feb 2013 1.68 (0.36) 91 2.59 (0.23) 94 0.18 (0.002) 9 0.18 (0.002) 6 1.86 (0.36) 2.77 (0.23) 4.29 (0.09) April 2013 0.95 (0.14) 89 1.22 (0.10) 91 0.12 (0.0004) 11 0.12 (0.0004) 9 1.07 (0.14) 1.34 (0.10) 4.87 (0.10) July 2013 0.75 (0.10) 25 1.65 (0.25) 46 2.24 (0.22) 75 1.96 (0.20) 54 2.99 (0.31) 3.61 (0.46) 3.76 (0.27) Nov 2013 1.93 (0.18) 49 3.73 (0.40) 68 2.00 (0.18) 51 1.79 (0.22) 32 3.93 (0.36) 5.52 (0.62) 2.87 (0.13) Table 5
Transpiration partitioning at plot scale in AFS with coffee, Tabebuia rosea and Simarouba glauca transpiration rate in mm d−1(standard error of the mean in brackets) and in percentage of
the total transpiration in the system.
Coffee Tabebuia rosea Simarouba glauca AFS Transpiration
mm d−1 % mm d−1 % mm d−1 % mm d−1 Feb 2012 1.38 (0.19) 59 0.71 (0.03) 30 0.24 (0.006) 10 2.33 (0.22) April 2012 2.22 (0.65) 87 0.08 (0.001) 3 0.25 (0.005) 10 2.55 (0.66) July 2012 2.32 (0.30) 62 1.22 (0.06) 32 0.22 (0.01) 6 3.76 (0.37) Feb 2013 2.29 (0.21) 88 0.12 (0.02) 5 0.18 (0.003) 7 2.59 (0.23) April 2013 1.01 (0.09) 83 0.06 (0.004) 5 0.14 (0.01) 12 1.22 (0.10) July 2013 0.92 (0.17) 56 0.57 (0.06) 35 0.15 (0.02) 9 1.65 (0.25) Nov 2013 2.67 (0.31) 72 0.88 (0.08) 23 0.17 (0.01) 5 3.73 (0.40)
4. Discussion 4.1. Coffee water use
Coffee water consumption on a leaf area basis was 23% greater in FS compared to AFS. On the other hand, at a plot scale we found coffee transpiration was 15% greater in AFS due to a 33% greater leaf area index in shaded coffee, similar to findings reported by Partelli et al. (2014). Irrespective of shade level, the same trend of greater coffee transpiration rate in AFS was previously reported byVan Kanten and Vaast (2006)for coffee associated with timber tree species Eucalyptus deglupta or Terminalia ivorensis or with leguminous Erythrina poep-pigiana, when compared to FS systems. Our results showing greater coffee water use on a leaf area basis in the open system was found to be similar to another study on coffee shaded with Inga densiflora in Costa Rica in which FS coffee transpiration was about 20–45% greater than in AFS (Cannavo et al., 2011).
In this study coffee transpiration was driven by both the atmo-spheric demand and soil water availability. Contrasting precipitation in the two consecutive years of study allowed comparison of coffee tran-spiration behaviour in both years. In 2012, when soil water was not so limiting, coffee transpiration tended to follow air saturation deficit in the wet and dry seasons as demonstrated inFig. 3. Inhibition of coffee transpiration was observed under VPD values of 1.7 kPa in FS in the dry season, which may have been a mechanism to reduce internal water stress. The close relationship between transpiration and atmospheric parameters has been previously demonstrated (Fanjul et al., 1985; Gutiérrez and Meinzer, 1994) and coffee transpiration inhibition at a similar threshold of VPD between 1.5 and 1.6 kPa was reported byVan Kanten and Vaast (2006) and byGutiérrez and Meinzer (1994). The general independence of coffee leaf transpiration from soil moisture was demonstrated by Nunes and Duarte (1969)when a decrease in transpiration rate was recorded only when 80% of the soil water in the rooting zone had been depleted.
In this study, we demonstrated that in the second year, during the severe dry season, 55% lower coffee transpiration rate occurred despite the high solar radiation (1015 W m−2) and high vapor pressure deficit (2.9 kPa) which suggest a response to low soil moisture that seems to have become the predominant limiting factor of transpiration in those stressed conditions. We also demonstrated that in the 2013 severe dry season, coffee leaf water potential declined to its lowest level when it reached −1.94 MPa and −2.33 MPa at midday in FS and AFS, re-spectively. Despite great variability in response to water supply related to coffee genotypes similar orders of magnitude of such MLWP in AFS were reported for Mokka coffee cultivar being −2.60 MPa (Meinzer et al., 1990) and for Catuai coffee cultivar being −2.49 MPa (Dias et al., 2007) in drought conditions. The lowest levels of leaf water potential and decline in coffee water use found in AFS during the re-strictive soil water conditions in the 2013 dry season indicated com-petition for water between coffee and shade trees in those environ-mental conditions. This result is in agreement withfindings reported in the previousPadovan et al. (2015)paper.
4.2. Shade tree water consumption
In the agroforestry system most water use was due to coffee plants rather than shade trees, which was a consequence of the greater coffee LAI under shade and coffee population density compared to the trees. Coffee water use represented 72.5% of the total water transpired in AFS while deciduous Tabebuia rosea shade trees accounted for 19% and evergreen Simarouba glauca for 8.5%. The Tabebuia rosea water con-sumption pattern was determined by leaf phenology, soil water avail-ability and environmental conditions. The positive and strong correla-tion between LAI and transpiracorrela-tion rate reinforced the effect of leaf phenology on Tabebuia rosea water consumption patterns. Despite greatly reduced transpiration during the dry periods (February-April)
Tabebuia rosea mean daily transpiration in a plot basis was 0.30 mm d−1when averaged over the whole year, significantly greater (p = 0.02) than Simarouba glauca transpiration at 0.19 mm d−1. Very low rates were observed in April when most of the Tabebuia trees were leafless but these periods were short; about 2–3 weeks in April 2012 and 5–8 weeks during the 2013 severe dry season. The reduction in water loss over the dry season was compensated for by rapid increase in water consumption in the late dry seasons to achieve full leaf expansion which characterized Tabebuia rosea as a water spender compared to Simarouba glauca tree. Moreover, the deciduous Tabebuia rosea root system was distributed throughout the 2.0 m soil profile (Padovan et al., 2015), indicating competition for water in the dry periods in the upper soil layer where most coffee roots are concentrated. This study demonstrated that such a competitive relationship was minimized during the “normal” dry periods because most Tabebuia rosea water requirements occurred in the wet seasons and did not coincide with the greatest periods of coffee water consumption that occurred in the dry season. Simultaneous periods of great water requirements by deciduous Tabebuia rosea and of low water use by coffee plants suggested a complementarity in time in water use between coffee and this shade tree.
Conversely, evergreen Simarouba glauca may be considered as a water conserver with a lower and more stable water consumption pattern over the course of the experiment compared to Tabebuia rosea. An exception was observed of decreased Simarouba glauca water use in the 2013 severe dry season when the maximum transpiration rate de-clined to 1.49 L h−1per tree compared to 3.84 L h−1in the 2012 dry season. Overall, mean Simarouba glauca plot scale daily transpiration rate ranged from 0.19 mm d−1 (S.E. = 0.01) to 0.22 mm d−1 (S.E. = 0.01) in the wet and dry season respectively. Although these seasonal differences in Simarouba glauca transpiration rate were not statistically significant, previous studies showed a tendency for in-creasing transpiration rates as the dry season progressed in evergreen timber trees such as Eucalyptus tetrodonta and Eucalyptus miniata (Grady et al., 1999). Similarfindings were reported for Acacia mangium in Panama probably as a consequence of the exploration of deep sources of soil water (Kunert et al., 2010). Simarouba glauca was characterized by a denser root system concentrated in deeper soil layers (below 1.10 m depth) with a clear root niche differentiation compared to coffee roots as reported by Padovan et al. (2015). This description of evergreen Simarouba glauca water use pattern and spatial below ground arrange-ments reflect findings ofMeinzer et al. (1990)in which species with small seasonal variability in leaf fall were able to exploit deeper soil layers with increasing drought condition. Also it is worth recalling that in this investigation, Tabebuia rosea and Simarouba glauca water uptake and consumption must have been influenced by being limited to no more than 2.0 m soil depth exploration.
The mixed planting of deciduous Tabebuia rosea and evergreen Simarouba glauca reduced irradiance by an average of 57.3%. Greater coffee LAI and higher coffee transpiration rates in the shade did not represent further coffee production. Measurements of coffee yields by CATIE in the study site over the 10 years previous to the experiment showed 27% lower coffee production in AFS compared to FS. This result may be explained by the shade effect on reduction of the number of nodes per branches, on inhibitingflower bud formation and, therefore, on diminishing fruit load (Da Matta, 2004). In contrast, in more suitable environmental conditions for coffee cultivation in Costa Rica, experi-encing lower stress conditions than this study, it was demonstrated that shade cover up to 55% favored coffee fruit set and maintenance (Franck and Vaast, 2009) while in Mexico coffee yield was maintained with shade up to 48% and decreased under shade cover above 50% ( Romero-Alvarado et al., 2002). On this study site the more competitive Tabebuia rosea was denser (113 tree ha−1) compared to Simarouba glauca (75 tree ha−1). The experimental results indicate that in the prevailing sub-optimal environmental conditions, a lower deciduous tree density would be recommended in order to avoid competition for water. The
trade off between competition from trees and the under-storey crop is often an issue in agroforestry systems, but it should be borne in mind that in due course, the shade trees would give the farmer an economic return when harvested.
4.3. Soil surface evaporation
We demonstrated that in the prevailing environmental conditions evaporation from the soil surface was far from negligible. Water loss by soil evaporation varied from 0.31 mm d−1 (S.E. = 0.02) to 1.76 mm d−1 (S.E. = 0.03) at plot scale while coffee water use by transpiration ranged from 1.59 mm d−1(S.E. = 0.05) to 2.49 mm d−1 (S.E. = 0.09) in the dry and wet seasons respectively. Similar orders of magnitude for coffee transpiration were reported byVan Kanten and Vaast (2006)however simultaneous measurements of soil evaporation and plant transpiration are rare. Soil water evaporation takes place from the upper strata where most coffee fine roots occur with a po-tential effect on coffee water use which is of considerable importance, especially in dry environments. This study demonstrated that shade trees had an effect on reducing water loss from soil surface evaporation, being responsible for a decrease of 31% in soil evaporation compared to the open system. This result suggests an effect of 52% greater litter layer in the shade due to leaf drop with further cover on soil surface as previously reported for other cropping systems (Wei et al., 2015). The presence of a litter layer on the ground controlled soil evaporation likely due to both the attenuation of radiationflux into and from the ground (Villegas et al., 2010; Wilson et al., 2000) and by increasing the resistance to waterflux from the ground (Ilstedt, 2016; Wu et al., 2015). The same tendency of reduction on evaporation rate in the shade was demonstrated in a sub humid climate in Kenya in which soil evapora-tion in agroforestry was reduced by 35% when compared to bare soil (Wallace et al., 1999). Another study in a Grevillea robusta agroforestry system in Kenya showed that beneath shade tree soil evaporation was reduced to 30.3% of the rainfall when LAI was 2.5 compared to 36.5% without any canopy (Jackson and Wallace, 1999). In the present study shade density of 57.3% of full irradiance had a similar effect on soil evaporation compared to another study on coffee agroforestry in Mexico with shade densities between 30% and 65% (Lin, 2007).
Furthermore, the present study demonstrated that soil evaporation was precipitation dependent, as was expected from results from other studies (Raz-Yaseef et al., 2010). Soil evaporation was greater in per-iods of scattered rainfall, due to greater evaporation in thefirst phase after each rainfall event compared to periods of large and infrequent rainfall. We demonstrated that in dry periods despite the high reference potential evaporation of 4.7 mm, low mean soil evaporation was ob-served (from 0.25 mm d−1 to 0.38 mm d−1), and explained by rela-tively low rates of water movement toward the surface in unsaturated soil. These rates were similar to thefindings ofWallace (1991)in arid lands where the evaporation rate of 0.5 mm d−1was much less than potential evaporation of 3.8 mm. In wet condition greater evaporation from soil surface compared to the dry periods was also reported by Zheng et al. (2015)and byYunusa et al. (2004).
5. Conclusions
This study demonstrated that in sub optimal conditions for coffee cultivation agroforestry was a more efficient water user when compared to a non-shaded coffee system since most of the soil water was used for coffee transpiration in comparison to shade trees or loss by evaporation from the soil surface.
Our results indicate that even in these sub optimal environmental conditions soil water was not usually a constraint for coffee water consumption in agroforestry. Temporal complementarity in water use was demonstrated between coffee and Tabebuia rosea whilst com-plementarity in root system distribution and soil water uptake was observed between coffee and Simarouba glauca trees.
Nevertheless, competition in water use between coffee and shade trees was observed in a severe dry season when water input supply was not enough to avoid coffee water stress in agroforestry due to coffee plus shade tree water requirements.
Evergreen Simarouba glauca characteristics such as taking up water from deeper soil layers and the lower and more constant water con-sumption pattern pointed towards it being more suitable as coffee shade tree when compared to deciduous Tabebuia rosea in sub optimal con-ditions for coffee cultivation.
Acknowledgements
This research was funded by INCAPER and FONTAGRO Caf’Adapt Project. CIRAD provided additional logistic andfinancial support. We gratefully thank Carolina Vega-Jarquin, Rodolfo Munguía and Leonardo Garcia Centeno that provided research facilities at UNA. Victor Jirón Cortez, Ledis Navarrete and Elvin Navarrete, Mauricio Xavier Martinz, Dimas Nicolas Aguilar, Alejandro Aguirre Rosales did part of the field work. This study is part of the PCP “Agroforestry Systems with Perennial Crops in Meso America”, a Scientific Partnership Platform between CIRAD, CATIE, Bioversity, Promecafé, CABI, INCAE and the World Agroforestry Centre.
References
Allen, R.G., Pereira, L.S., Raes, D., Smith, M., 1998. Crop Evaporation: Guidelines for Computing Crop Water Requirements. FAO Irrigation and Drainage FAO, Rome (300 pp).
Barradas, V.L., Fanjul, L., 1986. Microclimatic characterization of shaded and open-grown coffee (Coffea arabica) plantations in Mexico. Agric. For. Meteorol. 38, 101–112.
Bates, D., Maechler, M., Bolker, B., Walker, S., 2015. Fitting linear mixed-Effects models using lme4. J. Stat. Software 67 (1), 1–48.
Bayala, J., et al., 2015. Advances in knowledge of processes in soil-tree-crop interactions in parkland systems in the West African Sahel: a review. Agric.Ecosyst. Environ. 205, 25–35.
Beer, J., 1987. Advantages, disadvantages and desirable characteristics of shade trees for coffee, cacao and tea. Agrofor. Syst. 5, 3–13.
Beer, J., 1995. Efectos de los arboles de sombra sobre la sostenibilidad del cafetal. Boletin Promecafe 68, 13–18.
Cannavo, P., et al., 2011. Agroforestry associating coffee and Inga densiflora results in complementarity for water uptake and decreases deep drainage in Costa Rica. Agric., Ecosyst. Environ. 140 (1-2), 1–13.
Da Matta, F.M., 2004. Ecophysiological constraints on the production of shaded and unshaded coffee: a review. Fields Crops Res. 86, 99–114.
Daamen, C.C., Simmonds, L.P., Sivakumar, M.V.K., 1995. The impact of sparse millet crops on evaporation from soil in semi- arid Niger. Agric. Water Manage. 27 (3), 225–242.
Di Rienzo, J., et al., 2014. InfoStat Manual. Universidad Nacional de Córdoba., Argentina (336 pp).
Dias, P.C., Araujo, W.L., Moraes, G.A.B.K., Barros, R.S., DaMatta, F.M., 2007. Morphological and physiological responses of two coffee progenies to soil water availability. J. Plant Physiol. 164, 1639–1647.
Fanjul, L., Arreola-Rodriguez, R., Mendez-Castrejon, M.P., 1985. Stomatal responses to environmental variables in shade and sun grown coffee plants in Mexico. Exp. Agric. 21 (3), 249–258.
Franck, N., Vaast, P., 2009. Limitations of coffee leaf photosyntesis by stomatal con-ductance and light availability under different shade levels. Trees 23, 761–769. Frazer, G.W., Canham, C.D., Lertzman, K.P., 1999. Gap Light Analyzer (GLA)Version 2.0:
Imaging Software to Extract Canopy Structure and Gap Light Transmission Indices from True-colour Fisheye Photographs, Users Manual and Program Documentation New York. pp. 36.
Gomez-Delgado, F., et al., 2010. Modelling the hydrological behaviour of a coffee agro-forestry basin in Costa Rica. Hydrol. Earth Syst. Sci. 7, 3015–3071.
Grady, A.P.O., Eamus, D., Hutley, L.B., 1999. Transpiration increases during the dry season: patterns of tree water use in eucalypt open-forests of northern Australia. Tree Physiol. 19, 591–597.
Granier, A., 1985. Une nouvelle méthode pour la mesure duflux de seve brute dans le tronc des arbres. Annales des Sciences Forestières 42, 193–200.
Granier, A., 1987. Evaluation of transpiration in a Douglas-fir stand by means of sap flow measurements. Tree Physiol. 3, 309–320.
Gutiérrez, M.V., Meinzer, F.C., 1994. Estimating water use and irrigation requirements of coffee in Hawaii. Journal. Amer. Soc. Hort. Sci. 119 (3), 652–657.
Haggar, J., et al., 2011. Coffee agroecosystem performance under full sun, shade, con-ventional and organic management regimes in Central America. Agrofor. Syst. 82 (3), 285–301.
Ilstedt, U., et al., 2016. Intermediate tree cover can maximize groundwater recharge in the seasonally dry tropics. Sci. Rep. 6, 21930.
Jackson, N.A., Wallace, J.S., 1999. Soil evaporation measurements in an agroforestry system in Kenya. Agric. For. Meteorol. 94, 203–215.
Jonckheere, I., et al., 2004. Review of methods for in situ leaf area index determination Part I Theories, sensors and hemispherical photography. Agric. For. Meteorol. 121, 19–35.
Jones, J.W., et al., 2003. The DSSAT cropping system model. Eur. J. Agron. 18, 235–265. Keating, B.A., et al., 2003. An overview of APSIM, a model designed for farming systems
simulation. Eur. J. Agron. 18, 267–288.
Kool, D., et al., 2014. A review of approaches for evapotranspiration partitioning. Agric. For. Meteorol. 184, 56–70.
Kunert, N., Schwendenmann, L., lscher, D.H., 2010. Seasonal dynamics of tree sapflux and water use in nine species in Panamanian forest plantations. Agric. For. Meteorol. 150, 411–419.
Lawrence, D.M., Thornton, P.E., Oleson, K.W., Bonan, G.B., 2006. The partitioning of evapotranspiration into transpiration, soil evaporation, and canopy evaporation in a GCM: impacts on land-Atmosphere interaction. J. Hydrometeorol. 8, 862–880. Lemmon, P.E., 1956. A spherical densiometer for estimating forest overstory density. For.
Sci. 2 (4), 314–320.
Lin, B.B., 2007. Agroforestry management as an adaptive strategy against potential mi-croclimate extremes in coffee agriculture. Agric. For. Meteorol. 144, 85–94. Liu, C., Zhang, X., Zhang, Y., 2002. Determination of daily evaporation and
evapo-transpiration of winter wheat and maize by large-scale weighing lysimeter and micro-lysimeter. Agric. For. Meteorol. 111, 109–120.
Meinzer, F.C., Grantz, D.A., Goldstein, G., Saliendra, N.Z., 1990. Leaf water relations and maintenance of gas exchange in coffee cultivars grown in drying soil. Plant Physiol. 94, 1781–1787.
Moat, J., et al., 2017. Resilience potential of the Ethiopian coffee sector under climate change. Nat. Plants 3.
Muschler, R.G., 1997. Effectos De Sombra De Erythrina Poeppigiana Sobre Coffea Arabica Vars. Caturra Y Catimor. 18° Simposio Latinoamericano de Caficultura, San Jose, Costa Rica, pp. 157–162.
Nash, J.E., Sutcliffe, J.V., 1970. River flow forecasting through conceptual models part I − A discussion of principles. J. Hydrol. 10 (3), 282–290.
Nunes, M.A., Duarte, N.T., 1969. Resistencia a secura em Coffea arabica. Estudo com-parativo de duas seleções Garcia de Orta. Lisboa 17 (1), 83–96.
Padovan, M.P., et al., 2015. Root distribution and water use in coffee shaded with Tabebuia rosea Bertol. and Simarouba glauca DC. compared to full sun coffee in sub-optimal environmental conditions. Agrofor. Syst. 89 (5), 857–868.
Partelli, F.L., et al., 2014. Microclimate and development of‘Conilon' coffee intercropped with rubber trees. Pesquisa Agropecuária Brasileira 49 (11), 872–881.
Rapidel, B., Roupsard, O., 2009. Sapflow measurement in coffee tree: comparison of two methods, sources of error and correction methods. In: ICRAF (Ed.), II World Congress of Agroforestry, Nairobi, Kenya.
Raz-Yaseef, N., Rotenberg, E., Yakir, D., 2010. Effects of spatial variations in soil eva-poration caused by tree shading on waterflux partitioning in a semi-arid pine forest. Agric. Forest Meteorol. 150, 454–462.
Ritchie, J.T., 1972. Model for predicting evaporation from a row crop with incomplete cover. Water Resour. Res. 8 (5), 1204–1213.
Romero-Alvarado, Y., Soto-Pinto, L., García-Barrios, L., Barrera-Gaytán, J.F., 2002. Coffee yields and soil nutrients under the shades of Inga sp. vs.multiple species in Chiapas. Mexico Agrofor. Syst. 54, 215–224.
Scholander, P.F., Hammel, H.T., Bradstreet, E.D., Hemmingsen, E.A., 1965. Sap pressure in vascular plants. Science 148, 339–346.
Siles, P., Harmand, J.-M., Vaast, P., 2009. Effects of Inga densiflora on the microclimate of coffee (Coffea arabica L.) and overall biomass under optimal growing conditions in Costa Rica. Agrofor. Syst. 78 (3), 269–286.
Smith, D.M., Allen, S.J., 1996. Measurement of sapflow in plant stems. J Exp. Bot. 47 (305), 1833–1844.
Udawatta, R.P., Anderson, S.H., Motavalli, P.P., Garrett, H.E., 2011. Calibration of a water content reflectometer and soil water dynamics for an agroforestry practice. Agrofor. Syst. 82, 61–75.
Van Kanten, R., Vaast, P., 2006. Transpiration of arabica coffee and associated shade tree species in sub-optimal, low-altitude conditions of Costa Rica. Agrofor. Syst. 67, 187–202.
Vertessy, R.A., Benyon, R.G., O’Sullivan, S.K., Gribben, P.R., 1995. Relationships between stem diameter, sapwood area, leaf area and transpiration in a young mountain ash forest. Tree Physiol. 15, 559–567.
Villegas, J.C., Breshears, D.D., Zou, C.B., Law, D.J., 2010. Ecohydrological controls of soil evaporation in deciduous drylands: how the hierarchical effects of litter, patch and vegetation mosaic cover interact with phenology and season. J. Arid Environ. 74, 595–602.
Vogel, A.W., Acuña Espinales, E., 1995. Reference Soils of the Pacific Coastal Plain with a Hardpan (Talpetate). Soil Brief Nicaragua, 3. International Soil Reference and Information Centre and Universidad Nacional Agraria, pp. 21.
Wallace, J.S., Jackson, N.A., Ong, C.K., 1999. Modelling soil evaporation in an agrofor-estry system in Kenya. Agric. Forest Meteorol. 94, 189–202.
Wallace, J.S., 1991. The measurement and modelling of evaporation from semi-arid land. In: Sivakumar, J.S., Renard, C., Giroux, C. (Eds.), Soil Water Balance in the Sudano-Sahelian One. IAHS, Wallingford, UK, pp. 131–148.
Wei, Q., Hu, C., Oenema, O., 2015. Soil mulching significantly enhances yields and water and nitrogen use efficiencies of maize and wheat: a meta-analysis. Sci. Rep. 5, 16210. Wilcox, B.P., Breshears, D.D., Seyfried, M.S., 2003. Water balance on rangeland. In:
Howell, B.A.S.A.T.A. (Ed.), Encyclopedia of Water Science. Marcel Dekker, Inc, New York, pp. 791–794.
Wilson, K.B., Hanson, P.J., Baldocchi, D.D., 2000. Factors controlling evaporation and energy partitioning beneath a deciduous forest over an annual cycle. Agric. Forest Meteorol. 102, 83–103.
Wilson, K.B., Hanson, P.J., Mulholland, P.J., Baldocchi, D.D., Wullschleger, S.D., 2001. A comparison of methods for determining forest evapotranspiration and its compo-nents: sap-flow, soil water budget, eddy covariance and catchment water balance. Agric. Forest Meteorol. 106, 153–168.
Wu, Y., Liu, T., Paredes, P., Duana, L., Pereira, L.S., 2015. Water use by a groundwater dependent maize in a semi-arid region of Inner Mongolia: evapotranspiration parti-tioning and capillary rise. Agric. Water Manage. 152, 222–232.
Xu, Z., et al., 2008. Partitioning evapotranspirationflux components in a subalpine shrubland based on stable isotopic measurements. Botanical Stud. 49, 351–361. Yunusa, I.A.M., Walker, R.R., Lu, P., 2004. Evapotranspiration components from energy
balance, sapflow and microlysimetry techniques for an irrigated vineyard in Inland Australia. Agric. For. Meteorol. 127, 93–107.
Zheng, W., Paredes, P., Liu, Y., Wei, W.C., Pereira, L.S., 2015. Modelling transpiration, soil evaporation and yield prediction of soybean in North China Plain. Agric. Water Manage. 147, 43–53.