HAL Id: hal-02987838
https://hal.archives-ouvertes.fr/hal-02987838
Submitted on 4 Nov 2020HAL is a multi-disciplinary open access
archive for the deposit and dissemination of sci-entific research documents, whether they are pub-lished or not. The documents may come from teaching and research institutions in France or
L’archive ouverte pluridisciplinaire HAL, est destinée au dépôt et à la diffusion de documents scientifiques de niveau recherche, publiés ou non, émanant des établissements d’enseignement et de recherche français ou étrangers, des laboratoires
Impact of the Amazon tributaries on major flood in
Óbidos
Josyane Ronchail, Jean-Loup Guyot, Jhan Carlo Espinoza Villar, Pascal
Fraizy, Gérard Cochonneau, Juan Ordenez
To cite this version:
Josyane Ronchail, Jean-Loup Guyot, Jhan Carlo Espinoza Villar, Pascal Fraizy, Gérard Cochonneau, et al.. Impact of the Amazon tributaries on major flood in Óbidos. Procceedings of the Fifth FRIEND World Conference held at Havana, Cuba, November 2006), IAHS Publ. 308, 2006, 220-225, 2006. �hal-02987838�
Impact of the Amazon tributaries on major flood in Óbidos
JOSYANE RONCHAIL
Université Paris 7- Denis Diderot and Laboratoire d’Océanographie et du Climat (LOCEAN-IPSL), case 100, 4 Place Jussieu, 75005 Paris-France
e-mail: Josyane.ronchail@lodyc.jussieu.fr
JEAN-LOUP GUYOT, JHAN CARLO ESPINOZA VILLAR, PASCAL FRAIZY
Institut de Recherche pour le Développement and Universidad Agraria La Molina, casilla 18 1209, Lima 18, Peru.
GERARD COCHONNEAU
Maison de la Télédétection, 500 rue J.F. Breton, 34093 Montpellier Cedex 05, France EURIDES DE OLIVEIRA, NAZIANO FILIZOLA
Agência Nacional de Águas, Setor Policia, CEP 70610-200, Brasília, Brasil JUAN JULIO ORDENEZ
Servício Nacional de Meteorología y Hidrología, Cahuide 785, Lima 11, Peru
Abstract Major flood of the Amazon river (with discharge over 250 000 m3 s-1) is
analysed, using daily discharge at a) Óbidos, the last gauged station of the Amazon river, 800 km from the ocean, b) six gauge stations located on the main tributaries and characterized by different discharge regimes. During the 1984-2001 period major flood on the main stream is related to the following features: a) greater than usual high water in the Solimões river, the greatest tributary, b) delayed discharge peaks in the southwestern tributaries and in the Amazonas river (Peru) and/or advanced discharge
peaks in the Negro-Branco river, c) unusual February-April discharge peaks in the western and northwestern affluent, particularly in the Negro River. These two last features contribute to the simultaneous inflow of great quantity of water coming from all the tributaries in April-May and may favour major flood of the Amazon river at Óbidos.
Key words: Amazon river; Óbidos; flooding; discharge; Brazil; Peru
INTRODUCTION
The Amazon basin at Óbidos is huge (4 677 000 km2) and its main tributaries are
located in various climatological regions: equatorial area, southern and northern tropics (Fig. 1 and Table 1). This is why different hydrological regimes are observed in the Amazon basin (Pardé, 1936; Molinier et al., 1996). Consequently, flood time differs from a region to another and peak discharge at Óbidos results from those in the different Amazon tributaries.
Callède et al. (2004) pointed out that higher than normal high water and mean discharge were observed around 1920, 1950 and that they became very frequent since the early
seventies. Nine events with runoff higher than 250 000 m3 s-1 occurred between 1970
and 2005, while four have been observed since the beginning of the century, in 1909, 1921, 1922 and 1953. Labat et al. (2005) also emphasize the Amazon long-term discharge variability using wavelet analysis.
In this paper, a particular attention is paid to recent major flooding in Óbidos and to the impact of the Amazon tributaries on these events. It is hypothesized that, on one hand, major flood in Óbidos is associated with positive discharge anomalies in the tributaries.
However, we wonder whether an anomalous high water is observed in some tributaries only, or in all of them. On the other hand, major flood in Óbidos may depend on the date of the flood in each basin. Is it related to delayed high water coming from the southern affluent that experience their flood before Óbidos or, on the contrary, to sooner than usual flood in the northern affluent that experience their peak after Óbidos? Is major flood in Óbidos due to an anomalous concordance of flood in the Amazon tributaries?
DATA
This study is realized using daily discharge data from 1984-2001 (Table 1). Water level
series are recorded by ANA (Agência Nacional de Águas, Brasília, Brazil,
http://www.ana.gov.br/ ) and SENAMHI (Servicio Nacional de Meteorología y
Hydrología, Lima, Peru, http://www.senamhi.gob.pe/). Discharge values are computed
within the Hybam project (Hydrogeodynamics of the Amazon basin,
http://www.mpl.ird.fr/hybam/ ). Three virtual stations are created (Fig. 1):
(a) “Gavião-Labrea” values are the sum of the discharge of the Jurua river at Gavião and the Purus river at Labrea.
(b) “Solimões-Manacapuru” values are the difference between the Solimões river discharge at Manacapuru and the sum of its mains tributaries discharge: Amazonas at Tamshiyacu (Espinoza et al., 2006), Japura at Acanui and Jurua-Purus at “Gavião-Labrea”. This station represents the main stream of the Solimões river. (c) “Manaus“ values are the sum of the Amazon river discharge at Jatuarana (3.1°S and
59.7°W) and Careiro (3.2°S and 59.8°W), located downstream the Negro and Solimões rivers confluence, minus the Solimões river discharge at Manacapuru.
Data processing is realized using the computational package Hydraccess (Vauchel, 2005).
MAIN CHARACTERISTICS OF FLOOD OF THE AMAZON RIVER AND ITS TRIBUTARIES
The average 1984-2001 Amazon flood value at Óbidos is 238 000 m3 s-1 (Table 2) with
extreme values varying from 274 400 m3 s-1 in 1989 to 194 600 m3 s-1 in 1992. The average flood date is 27 May. However, during 1984-2001, flood occurred as early as
10 May 1992 and as late as 1 July1994. Low water in Óbidos is observed in November
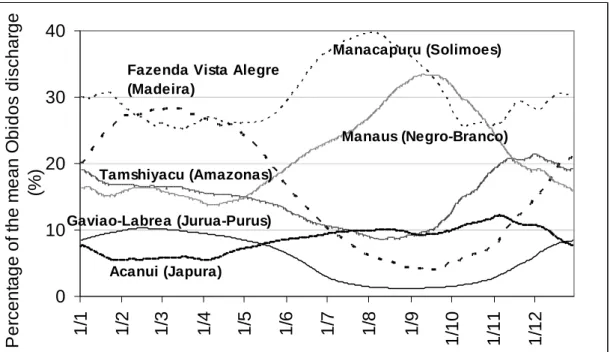
and it represents half the flood value (Fig. 1). The contribution of the different tributaries to the Amazon river runoff varies with time in accordance with their annual cycle (Fig. 2).
The flood of the southwestern Amazon basins (Madeira and Jurua-Purus) occurs first, around mid-April (Table 2). The hydrological regime is tropical with high water from March to May and low water in September. Seasons are very contrasted as low water is only a tenth of high water (Fig. 1). As the Madeira watershed is very large (Table 1), its mean discharge accounts for 16% of the Amazon river discharge (Table 2).
The Amazonas river at Tamshiyacu (Peru) drains most of the tropical Peruvian Amazon basin and some equatorial basins (Pastaza, Tigre and Santiago). This is why high water occurs later, 1 May, and discharge seasonality is weak (Table 2). Amazonas discharge at Tamshiyacu represents 14% of the mean Amazon discharge.
Western rivers (Japura, Negro-Branco and Solimões) drain very rainy regions. This explains why the Solimões and the Negro-Branco basins, although half the size of the
Madeira basin, accounts for 30% and 20% respectively of the Amazon river discharge. Runoff seasonality is weak in these near equatorial basins, with a maximum in July and a minimum in January.
High water of the Amazon river in Óbidos is observed 27 May, after the flood of the Madeira, Purus-Jurua and Amazonas rivers, but before the peaks of the Japura, Solimões and Negro-Branco rivers (Table 2).
THE GENESIS OF SIX MAJOR FLOOD IN ÓBIDOS (1984-2001)
Big flood is characterized by discharge over 250 000 m3 s-1 (Table 3a). During the three greatest floods, in 1989, 1997 and 1999, huge daily discharge values (over 260 000 m3 s-1) were recorded as well as long lasting strong values (2 to 3 months with an over 250 000 m3 s-1 runoff).
In 1989 strong positive maximum discharge anomalies have been registered in the western basins (Solimões and Japura) and in the Madeira river (Table 3b). Moreover, the delayed peak of the Jurua-Purus and Amazonas rivers and the advanced flood of the Negro-Branco river (6 July instead of 2 August) led to concomitant high discharge in the different tributaries, during the Amazon river rising stage (Table 4). This phenomenon has been reinforced by unusual high discharge values in December 1988 and in March-April 1989 in the Negro-Branco and Solimões rivers. The early flood of the Negro-Branco river and the late flood of the Solimões river contributed to the length of the Amazon river flood (more than 3 months).
The 1994 flood is associated with higher than normal outflow along the Solimões-Tamshiyacu axis, i.e. in rivers flowing from Peru and Ecuador (Table 3b). Moreover,
two features contributed to a big flood in Óbidos: a) higher than normal discharge values in the Solimões and Negro-Branco rivers from December 1993 to April-May 1994, b) an advanced peak in the Negro-Branco river (14 June instead of 2 August) (Table 4).
The 1996 flood may be associated with higher than normal maximum discharge in the Solimões and Negro-Branco rivers and with delayed peaks in the southern rivers (Madeira and Jurua-Purus) (Tables 3b and 4). Moreover, an unusual discharge peak is remarkable in March-April in the Negro-Branco and the Japura rivers. This unusual peak, occurring during the southern affluent rising stage, may explain a strong and earlier than usual flood in Óbidos (16 May instead of 27 May).
In 1997, unusual high water has been observed in the southern affluent, Madeira and Jurua-Purus rivers, and along the Solimões river (Table 3b). Moreover, a February-March peak in the Negro-Branco and Japura rivers, and a earlier than usual flood in Manaus (12 June instead of 2 August) may also have contributed to a big and early flood in Óbidos (Table 4).
In 1999, maximum discharge has been greater than usual in all the tributaries, except in the southern ones (Table 3b). Flood is delayed in the river Amazonas (Table 4). Moreover, unusual peaks are observed in the Negro-Branco and Japura rivers in February-March and in the Solimões river in April; they coincide with the rising stage and flood in the southern affluent. On another hand, a delayed flood in the Solimões and Negro-Branco rivers may have caused a long lasting flood in Óbidos (67 days).
Lastly, in 2000, weak positive maximum discharge anomalies have been observed in the western affluent (Table 3b). Moreover, a one month advance of the Negro-Branco river
flood and a delayed flood of the Amazonas river are factors that explain the concomitant high discharge in the southwestern and northwestern affluent (Table 4).
CONCLUSION
The main characteristics of six major Amazon floods in Óbidos, during 1984-2001, are analysed using daily discharge values of six Amazon tributaries.
In 1989, the biggest flood of the twentieth century is related to positive discharge anomalies in the whole basin. In the other cases, unusual high water is observed in groups of tributaries that are always different. Obviously, as it is the biggest tributary, a positive high water anomaly is generally observed in the Solimões river. The correlation between high water discharge in the Amazon river and in the tributaries is high with the Solimões (r = 0.77), weak with the Jurua-Purus, the Amazonas (Peru) and the Japura and non significant with the Negro-Branco and the Madeira.
Major flood in Óbidos is also related to out of phase flood in the tributaries and to concomitant high discharge values in the different rivers. Delayed flood is observed three times in the Amazonas river, twice in the Jurua-Purus river and once in the Madeira river. Advanced high water occurred four times in the Negro-Branco river. In 2000, as no strong high water anomaly has been observed in the main tributaries, the Amazon flood may be directly associated with a delayed peak in the Amazonas river and an advanced one in the Negro-Branco river.
Major flood events are also related to the occurrence of out of phase and secondary peak discharge in the Negro-Branco river (1989, 1994, 1996, 1997, 1999), in the Japura river (1996, 1997, 1999) or in the main stream of the Solimões river (1989, 1994, 1999). In the Negro-Branco river, these discharge anomalies generally occur from February to
April, are particularly strong (+20% during the three months) and they are associated with an earlier than usual flood in Manaus (Fig. 3). The relationship between high water discharge at Óbidos and February-March-April discharge at Manaus is significant (r = 0.74). In the Japura and Solimões rivers, they are less frequent and the average discharge anomalies are weaker (+10%). The February-March-April discharge anomalies are in phase with the southern affluent rising stage and high water and contribute to major flood in Óbidos. The origin of these out of phase peaks in the western rivers deserves further investigations.
In conclusion, each big flood in Óbidos seems to be a special event with its own causes. Nevertheless major flood has some features in common, as a February-March-April unusual peak in the Negro-Branco river, a delayed flood in the southern basins and in the Amazonas river, and a high water level of the Solimões river, the greatest Amazon tributary. These variables should be accurately monitored in order to predict major flood in Óbidos.
REFERENCES
Callède J., Guyot J.L., Ronchail J., L’Hôte Y., Niel H., de Oliveira E. (2004) Evolution du débit de l’Amazone à Obidos de 1902 à 1999. Hydrol. Sci. J., 49 (1), 85-97. Espinoza J.C, Fraizy P., Guyot J.L., Ordoñez J.J., Pombosa R., Ronchail J. (2006). La
variabilité des débits du Rio Amazonas au Pérou. Submitted to IAHS 5th World
FRIEND Conference Red Book, La Havana, Cuba, 2006.
Labat D., Ronchail J., Guyot J.L. (2005) Recent advances in wavelet analysis: Part 2 – Amazone, Parana, Orinoco and Congo interannual and multidecadal variability. J.
Molinier M., Guyot J.L. , de Oliveira E., Guimarães W. (1996) Les régimes
hydrologiques de l’Amazone et de ses affluents. In : Hydrologie tropicale:
geoscience et outil pour le développement, Paris, IAHS publ., 238, 209-222.
Pardé M. (1936) Les variations saisonnières de l’Amazone. Annales de Géographie, 45, 502-511.
Vauchel P. (2005) Hydraccess : logiciel de gestion et de traitement de données
hydrométéorologiques, version 2.1.4. www.mpl.ird.fr/hybam.
List of tables:
Table 1 Main characteristics of the gauging stations. “Gavião-Labrea”, “Solimões-Manacapuru” and “Manaus” are virtual stations (see text).
Table 2 Main characteristics of flood in Óbidos and in the Amazon tributaries (1984-2001).
Table 3 a) Main characteristics of major flood in Óbidos (1984-2001), b) maximum discharge anomalies (percentage of the 1984-2001 average) in the main tributaries. Table 4 Date of flood in the Amazon river tributaries during six big floods and during the 1984-2001 period. Delayed values in the Madeira, Jurua-Purus and Amazonas rivers and advanced values in the Japura, Solimões and Negro rivers are bolded when there is a 10 days difference with the average 1984-2001 value.
List of captions
Fig. 1 Localization and hydrological regimes of the Amazon river and its tributaries. Fig. 2 Daily contribution (%) of the tributaries to the Amazon River discharge at Óbidos.
Fig. 3 Mean discharge of the Negro-Branco river during the 1984-2001 period (thin line) and during years with major flood in Óbidos (1989, 1994, 1996, 1997, 1999 and 2000) (bold line).
Table 1 Main characteristics of the gauging stations. “Gavião-Labrea”, “Solimões-Manacapuru” and “Manaus” are virtual stations (see text).
Latitude (°) Longitude (°) Surface (km²) River Period Source Fz Vista Alegre 0,5 S 64,8 W 1 324 000 Madeira 05-67 / 09-02 ANA/HYBAM
"Gaviao-Labrea" 382 000 Purus-Jurua 06-72 / 05-01 ANA/HYBAM
Tamshiyacu 4 S 73,2 W 726 000 Amazonas 10-83 / 10-05 SENAMHI/HYBAM
Acanui 1,8 S 66,6 W 242 000 Japura 07-73 / 09-01 ANA/HYBAM
"Solimoes-Manacapuru" 3,3 S 62,8 W 797 000 Solimoes 10-83 / 05-01 ANA/HYBAM
"Manaus" 3,1 S 60 W 697 000 Negro and Branco 09-77 / 12-03 ANA/HYBAM
Obidos 1,95 S 55,5 W 4 677 000 Amazone 01-68 / 11-05 ANA/HYBAM
Table 2 Main characteristics of flood in Óbidos and in the Amazon tributaries (1984-2001).
Mean Annual Mean Annual Maximum flood Minimum flood Mean date Soonest Latest
discharge (m3
/s) flood (m3
/s) (m3
/s) (m3
/s) of the flood flood flood
Fz Vista Alegre 28 000 57 200 71460 (1997) 50470 (1987) 14/4 13/3 14/5 "Gaviao-Labrea" 10 000 20 000 23 400 (1997) 18 340 (1985) 12/4 10/3 19/5 Tamshiyacu 24 300 34 000 40 720 (1984) 29 460 (1995) 01/5 (*) 22/3 21/5 Acanui 14 200 21 700 27 800 (1989) 18 460 (1992) 30/6 14/5 4/8 "Solimoes-Manacapuru" 53 000 85 000 108 810 (2000) 65 660 (1985) 13/7 6/6 10/8 "Manaus" 36 000 57 600 75 000 (1990) 48 000 (1992) 2/8 12/6 17/9 Obidos 173 000 238 000 274 400 (1989) 194 600 (1992) 27/5 1/7 10/5
(*) a first flooding, equivalent to the May flooding, is sometimes registered in January or February
Table 3 A) Main characteristics of major flood in Óbidos (1984-2001), B) flood anomalies (percentage of the 1984-2001 flood average) in the main tributaries.
A
Obidos: 1989 1994 1996 1997 1999 2000
Flood value (m³/s) 274400 259300 251200 265800 268200 256200
Date of flood 9/6 1/6 16/5 13/5 2/6 5/6
Nb days with discharge > 250 000m3/s 107 69 9 54 67 29 Begining of discharge > 250 000m3/s
13/4 30/4 15/5 27/4 12/5 18/5
End of discharge > 250 000m3/s 28/7 7/7 22/05* 19/6 16/7 15/6
* and from the 6-6 to the 10-6
B
Percentage of the mean flood value 1989 1994 1996 1997 1999 2000
Fz Vista Alegre (Madeira) 14 5 -4 25 -3 -7
"Gaviao-Labrea" (Jurua-Purus) 4 4 7 18 4 -5
Tamshiyacu (Amazonas) 4 12 -4 2 14 6
Acanui (Japura) 28 0 0 17 4
"Solimoes-Manacapuru" (Solimoes) 17 23 13 22 28 3
"Manaus" (Negro-Branco) 7 -5 22 -5 21 5
Table 4 Date of flood in the Amazon river tributaries during six major floods and during the 1984-2001 period. Delayed values in the Madeira, Jurua-Purus and Amazonas rivers and advanced values in the Japura, Solimões and Negro rivers are bolded when there is a 10 days difference with the average 1984-2001 station value.
Date of flood 1989 1994 1996 1997 1999 2000 Mean 1984-2001 Fz Vista Alegre (Madeira) 27/3 13/3 30/4 9/4 11/4 5/4 14/4
"Gaviao-Labrea" (Jurua-Purus) 22/4 10/3 13/5 13/4 21/3 13/4 12/4 Tamshiyacu (Amazonas) 9/5 13/5 22/4 23/4 21/5 15/5 1/5 Obidos (Amazon) 9/6 1/6 16/5 13/5 2/6 5/6 27/5 Acanui (Japura) 7/7 12/7 27/6 3/7 6/7 30/6 "Solimoes-Manacapuru" (Solimoes) 8/8 8/8 14/7 23/7 3/8 10/8 13/7 "Manaus" (Negro-Branco) 7/7 14/6 19/8 12/6 17/9 1/7 2/8
Fig. 1 Localization and hydrological regimes of the Amazon river and its tributaries.
Obidos (Amazon R.) 0 50000 100000 150000 200000 250000 1 2 3 4 5 6 7 8 9 10 11 12 D isch ar g e ( m 3/s ) Acanaui (Japura R.) 0 20000 40000 60000 80000 100000 1 2 3 4 5 6 7 8 9 10 11 12 D isc h a rg e ( m 3/s ) Manacapuru (Solimoes R.) 0 20000 40000 60000 80000 100000 1 2 3 4 5 6 7 8 9 10 11 12 D isch ar g e ( m 3/s )
Fz Vista Alegre (Madeira R.)
0 20000 40000 60000 80000 100000 1 2 3 4 5 6 7 8 9 10 11 12 Di s c h a rg e (m 3/s ) Labrea-Gaviao (Jurua-Purus R.) 0 20000 40000 60000 80000 100000 1 2 3 4 5 6 7 8 9 10 11 12 D isc h a rg e (m 3/s ) Tamshiyacu (Amazonas R.) 0 20000 40000 60000 80000 100000 1 2 3 4 5 6 7 8 9 10 11 12 D isch ar g e ( m 3/s ) Manaus (Negro-Branco R.) 0 20000 40000 60000 80000 100000 1 2 3 4 5 6 7 8 9 10 11 12 Di s c h a rg e (m 3/s )
0 10 20 30 40 1/ 1 1/ 2 1/ 3 1/ 4 1/ 5 1/ 6 1/ 7 1/ 8 1/ 9 1/ 10 1/ 11 1/ 12 P e rc ent a ge of t h e m e an O b id os di s c h ar g e (% ) Manacapuru (Solimoes) Fazenda Vista Alegre
(Madeira)
Tamshiyacu (Amazonas) Gaviao-Labrea (Jurua-Purus)
Manaus (Negro-Branco)
Acanui (Japura)
Fig. 2 Daily contribution (%) of the tributaries to the Amazon River discharge at Óbidos.
Fig. 3 Mean discharge of the Negro-Branco river during the 1984-2001 period (thin line) and during years with major flood in Óbidos (1989, 1994, 1996, 1997, 1999 and 2000) (bold line). 0 10000 20000 30000 40000 50000 60000 70000 1/ 1 1/ 2 1/ 3 1/ 4 1/ 5 1/ 6 1/ 7 1/ 8 1/ 9 1/ 10 1/ 11 1/ 12 D isc h a rg e ( m ³/ s)