HAL Id: hal-00616722
https://hal.archives-ouvertes.fr/hal-00616722
Submitted on 9 Sep 2011
HAL is a multi-disciplinary open access
archive for the deposit and dissemination of
sci-entific research documents, whether they are
pub-lished or not. The documents may come from
teaching and research institutions in France or
abroad, or from public or private research centers.
L’archive ouverte pluridisciplinaire HAL, est
destinée au dépôt et à la diffusion de documents
scientifiques de niveau recherche, publiés ou non,
émanant des établissements d’enseignement et de
recherche français ou étrangers, des laboratoires
publics ou privés.
Study on Visual Discomfort induced by Stimulus
Movement at Fixed Depth on Stereoscopic Displays
using Shutter Glasses
Jing Li, Marcus Barkowsky, Junle Wang, Patrick Le Callet
To cite this version:
Jing Li, Marcus Barkowsky, Junle Wang, Patrick Le Callet. Study on Visual Discomfort induced by
Stimulus Movement at Fixed Depth on Stereoscopic Displays using Shutter Glasses. 17th International
Conference on Digital Signal Processing 2011, Jul 2011, Corfu, Greece. pp.1. �hal-00616722�
STUDY ON VISUAL DISCOMFORT INDUCED BY STIMULUS MOVEMENT AT FIXED
DEPTH ON STEREOSCOPIC DISPLAYS USING SHUTTER GLASSES
Jing Li, Marcus Barkowsky, Junle Wang, and Patrick Le Callet
LUNAM Université, Université de Nantes, IRCCyN UMR CNRS 6597
(Institut de Recherche en Communications et Cybernétique de Nantes)
Polytech Nantes, rue Christian Pauc BP 50609 44306 Nantes Cedex 3, France
{jing.li2, marcus.barkowsky, junle.wang, patrick.lecallet}@univ-nantes.fr
ABSTRACTStereoscopic motion images are able to provide observers with realistic and immersive viewing experience. However, observers often experience visual discomfort during the viewing process. In this paper, we investigated the relationship between visual discomfort and the planar motion at different depth levels. The Paired Comparison method was used in the subjective experiments to allow for a precise measurement. The experimental results indicated that the relative angular disparity between foreground object and background played a more important role in determining the visual discomfort than the vergence-accommodation conflict. Furthermore, the results showed that with the increase of planar motion velocity, viewers might experience more visual discomfort. To quantify the effects of relative angular disparity and velocity on visual discomfort, two visual discomfort models were constructed. The preferred model was chosen based on the performance as well as the algorithmic complexity. This model can be used as an index for other related researches.
Index Terms— Stereoscopic motion images, velocity,
disparity, visual discomfort, subjective experiment
1. INTRODUCTION
Stereoscopic images have drawn more and more attention recently as they can give viewers a totally different and enhanced viewing experience. The three-dimensional (3-D) technology can be applied on numerous areas, e.g. television broadcast system, video games, telecommunications, telemedicine, education, etc. Nevertheless, viewers often experience visual discomfort during the 3-D viewing process which may mangle the viewer’s enthusiasm. And it seems to be one of the critical factors that impede the development of 3-D on some applications.
To solve this problem, a number of researches on the relationship between visual discomfort and 3-D technology have been conducted [1]. One of the widely accepted main reasons that may cause visual discomfort is the
vergence-accommodation conflict [2]. When viewing an object by means of a 3-D screen, the eyes will converge to the virtual object which is in front of or behind the screen plane. However, the accommodation has to be performed at the screen depth level. This discrepancy may induce the declination of visual function and cause visual discomfort. Additionally, some studies about the effect of distortions on visual discomfort have been conducted [3][4]. Crosstalk [5], as one of the main distortions in 3D display may induce unnatural blur in stereoscopic images, of which the perceptual impact is directly related to the amount of screen
disparity and may accelerate the difficulty to
accommodation, which then leads to visual discomfort [6]. However, other studies show that ratings of visual strain remain constant with increasing crosstalk [4].
Most of the causes described above have been well documented for the case of still stereoscopic images. However, the number of studies of visual discomfort on moving stereoscopic images is comparably small. The object’s motion in stereoscopic videos can be categorized in in-depth and planar motion. Some studies showed that motion in depth, i.e., the magnitude of binocular disparity varying over time, could play an important role in visual discomfort, and it might be more important in determining visual discomfort than the absolute magnitude of the binocular disparity [7][8]. In [9], the authors concluded that the visual fatigue occurred when the stereoscopic images involved a motion component in depth even if they were displayed within the range of depth of field. Meanwhile, no visual fatigue was found in lateral motion images. However, this conclusion was given under the condition that the velocity of lateral motion was varied over time. It could not give a quantitative analysis of the relationship of the lateral motion velocity and visual fatigue.
In this study, the relationship between visual discomfort and the planar motion at different depth levels was investigated. In the subjective experiment, the stereoscopic stimuli contained a foreground and a background. The foreground object moved in a certain depth plane, with 5 different disparity levels. The velocity of the object stayed the same in one sequence, and there were a total number of 3
different levels (Slow, Medium, Fast) for all stimuli. The background was positioned behind the screen of a fixed distance. The Paired Comparison method was used in this task. The observers were asked to select the stimulus which made them feel more uncomfortable. After analyzing the subjective results, two models for visual discomfort concerning velocity and disparity were constructed. These quantitative models were compared with the subjective results, and showed high correlation with viewers’ perception. The preferred model was chosen based on performance as well as algorithmic complexity. It can be used as an index for other related researches, e.g., stereoscopic image quality assessment, stereoscopic image coding.
This paper is organized as follows. In section 2, the experimental setup is presented. In section 3, the results are validated and in Section 4, a deep analysis of the results is done which also includes a detailed discussion. In Section 5, a model is proposed which was fitted to the data. Section 6 concludes the paper.
2. EXPERIMENTAL SETUP 2.1. Experimental design
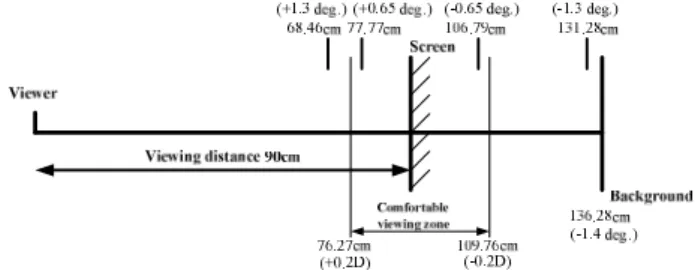
It is often accepted that 60-70 minutes of arc is the comfort threshold for static disparities [1]. Meanwhile, some researchers also use depth of focus (DOF) to calculate the comfortable viewing zone [10], which refers to the range of distances in image space within which an image appears in sharp focus and is given in terms of diopters (D) (a value of ±0.2D is suggested). To investigate how planar motion affects the visual discomfort at different disparity levels, five binocular disparity levels for the foreground were chosen in this experiment. Three of the angular disparity levels were within the comfortable viewing zone [10], two were outside it. These can be expressed in degrees of visual angle [11], as shown in Fig. 1. The binocular angular disparity can be calculated by the following equations (1) and (2), φ φA, Bare binocular angular disparities for A and B. Note that the positive value represents the crossed disparity, such as the point A; the negative value represents the uncrossed disparity, such as the point B.
A
φ =β α− (1) φB =γ α− (2)
Fig. 1. The definition of the binocular angular disparity, where F is the fixation point.
In this study, the five angular disparity levels were 0, ±0.65, and ±1.3 degree (+ means crossed, - means
uncrossed),assuming that the interpupillary distance was
65mm and the viewing distance was about 90 cm. A background was placed at a fixed position which was behind the screen at a distance of about 46.28cm, with the angular disparity of -1.4 degree. Fig. 2 shows the disparities used in the stimuli and their relationship with comfortable viewing zone. Three velocity levels which represented slow, medium and fast were used in the experiment.
Fig. 2. The relationship of the foreground and the background position and the comfortable viewing zone
2.2. Stimuli
To avoid the influence of other factors on visual discomfort, we used computer-generated stereoscopic sequences for precise control. The stereoscopic sequences consisted of a left-view and a right-view image which were generated by the MATLAB psychtoolbox [12][13]. Each image contained a foreground and a background. A black Maltese cross with
480×480 pixels was used as the foreground object as it
contained both high and low spatial frequency components. This was supposed to limit the influence of one particular spatial frequency in the experiment. The Maltese cross moved along a trajectory which was a circle with center point at the center of the screen, and a radius of 300 pixels. The motion direction was anti-clockwise. The reason to choose a circle as the trajectory was that it could avoid the step impulse that came from a sudden change of the motion direction, which may cause unexplained effects of visual discomfort. As the trajectory was a circle, the velocity was expressed in degree/s. The three velocity levels were 71.8, 179.5 and 287.2 degree/s, which represented slow, medium and fast, respectively. The background was generated by adding salt & pepper noise on a black image, and then filtered by a circular averaging filter. The reason that we used this kind of image as the common background of all stimuli was that it could preclude all of the monocular cues on stereopsis. Additionally, to give the viewers a reference of the trajectory a black circle which was the same as the moving track of the object was placed on the background. So, for viewers, the stimuli appeared to be composed of two parts: the salt&pepper-like background with a black circle on it, and a moving Maltese cross on a depth plane with a certain velocity.
As there were 3 levels of velocity and 5 levels of angular disparity, there would be totally 15 stimuli for the
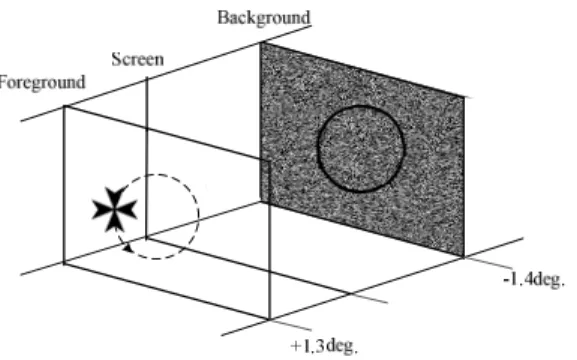
experiment. An example of the stimuli is shown in Fig. 3, in which the foreground object is placed in front of the screen with an angular disparity of 1.3 degree.
Fig. 3. An example of a stereoscopic image in the experiment. The foreground object is moving at the depth plane with a disparity of 1.3 degree. The background is placed at the depth plane with a disparity of -1.4 degree. The motion direction of the Maltese cross is anti-clockwise.
2.3. Apparatus
The stereoscopic sequences were displayed on a Dell
Alienware AW2310 23-inch 3-D LCD screen (1920×1080
full HD resolution, 120Hz), which featured 0.265-mm dot pitch. The display was adjusted for a peak luminance of 50
cd/m2 when viewed with the active shutter glasses. The
graphics card of the PC was an NVIDIA Quadro FX 3800. Stimuli were viewed binocularly through the NVIDIA active shutter glasses (NVIDIA 3D vision kit) at a distance of about 90 cm, which was approximately three times of the picture height. The peripheral environment luminance was
adjusted to about 44 cd/m2. When seen through the
eye-glasses, this value corresponded to about 7.5 cm/ m2 and
thus to 15% of the screen’s peak brightness as specified by ITU-R BT.500 [14].
2.4. Viewers
Because the task of this experiment needs a high level of concentration throughout the whole process, we decided to conduct an experts-only subjective experiment. We confirmed that the participants understood the necessities to pay close attention to the task they were asked. Ten experts in 3-D perception, coding, quality assessment and subjective experiments participated in the experiment. Eight experts are male, two are female. Their ages ranged from 24 to 43 years old. All have either normal or corrected-to-normal visual acuity. The visual acuity test was conducted with a Snellen Chart for both far and near vision. The Randot Stereo Test was applied for stereo vision acuity check, and Ishihara plates were used for color vision test. All of the viewers passed the pre-experiment vision check.
2.5. Assessment Method
In our study, the paired-comparison method was chosen as it is a well-known method in the field of psychophysics [15]. In the experiment, the viewers watched a pair of stimuli at one trial, and then they were asked to select the one which made them feel more uncomfortable. A total of 210 pairs were presented in each individual subjective experiment. This number corresponds to the presentation of all combinations of 15 stimuli except for equal presentation on the left and right side. In particular, it contains the same condition with the stimulus order inversed as the first onset of a stimulus might have caused a bias on the feeling of visual discomfort. The presentation order of the whole 210 pairs was randomly permuted for each viewer.
2.6. Procedure
The subjective experiment contained a training session and a test session. In the training session, there were five pairs of stimuli. At the beginning, the viewers were told that they will watch a series of stereoscopic motion images. They were asked not to stare at the moving object all the time, but watch the whole screen of the stereoscopic sequence under test. Then, they should select the one which made them feel more uncomfortable, concerning e.g., eye strain, headache, etc. As it was not technically possible to display a pair of stimuli on two screens, the viewers had to use two keys to switch between the pair of stimuli on one screen. There was no time limit for the display of stimuli, so the trial won’t continue until the viewers made their decision by pressing a specified button. After the explanation of the experiment, the viewers were asked to do the test by themselves. During the training session, all questions of the viewers were answered. We made sure that after the training session, all of the viewers knew about the process and task of this experiment clearly.
In the test session, the task and procedure were the same as the training session except 210 pairs of stimuli were compared. As the duration of the whole test was different due to individual difference of each viewer, and to avoid visual fatigue caused by long time watching affecting the experimental results, the viewers were asked to have a 15 minutes break after 30 minutes of the test.
In total 15 data sets were acquired as 5 experts participated twice in the experiment but on a different day.
3. VERIFICATION OF TEST RESULTS 3.1. Validation analysis on raw data
According to the experimental design of 3 velocity levels and 5 disparity levels, there were totally 15 stimuli. Each stimulus was compared with every other stimulus, and for each pair two trials were carried out because the sequence of the occurrence also matters. Therefore, there were 15×14=210 trials for the whole experiment. 210 comparison
results and 15 stimuli which were not compared to themselves could be arranged in a 15×15 matrix with the diagonal value being 0.5. A three-dimensional matrix M(i,m,n) is used to express each individual subjective experimental results, as shown in Fig. 4. The row represents the stimulus of the first presentation, and the column represents the stimulus of the second presentation. For the ith individual subjective experiment, M(i,m,n) represents the number of times stimulus m is selected over stimulus n. For example, in the ith individual subjective experiment, the pair of stimuli was stimuli m and n, and stimulus m is presented first. If the observer choose stimulus m as more uncomfortable, then, M(i,m,n)=1, otherwise M(i,m,n)=0. For each individual subjective experiment, the matrix M is binary without considering the diagonal elements. Before any further data analysis about the relationship of visual discomfort to binocular angular disparity and velocity, we checked the validity of the raw data regarding the following aspects:
1) Screening of the observers. To remove the data that stemmed from the observers who were inclined to give random answers in the experiment.
2) Verification of each pair condition. There might be a pair of stimuli in which most of the viewers always chose the one presented first. The influence of the presentation orders on visual discomfort, and the interaction effects of the pair of stimuli on visual discomfort can be verified in this process.
1 2 ... m ... n ... 15 1 2 .. . m .. . n .. . 15 M(i,m,n) M(i,n,m) 0.5 0.5 0.5 0.5 1 1 . . . . . . 0.5 1 0 1 1 . . . . . . M(i,1,m) M(i,2,m) . . . M(i,m,1) M(i,m,2) M(i,n,1) M(i,n,2) . . . . . . . . . . . . . . . . . . . . . M(i,1,n) M(i,2,n) . . . . . . . . . . . . . . . . . . . . . M(i,m,15) M(i,n,15) M(i,15,m) . . . M(i,15,n) . . . F ir st p re se n ta ti o n ( S ti m u lu s)
Second presentation (Stimulus)
. . . . . . . . . . . . . . . . . . . . . . . . . . . . . . . . . . . .
Fig. 4. An example of the matrix M for the ith individual subjective experimental results. The row represents the stimulus of the first presentation, and the column represents the stimulus of the second presentation. M(i,m,n) represents the number of times stimulus m is selected over stimulus n in the ith individual subjective experiment and can thus be either 0 or 1.
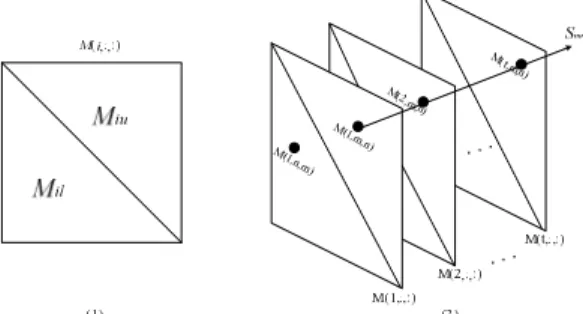
Ideally, for all pairs of stimuli, the observer’s answers should not depend on the presentation orders. Thus, it can be expressed by the equation M(i,m,n)+M(i,n,m)=1. A statistical method was used to verify it. The Student’s-t-Test was performed on each individual subjective experimental results, which correspond to the elements of the upper and lower triangular matrices of M for each subjective experiment, and expressed as Miu and Mil respectively, as
Fig. 5 (1) shown. The question thus changed to if Miu and 1-
Mil were obtained from a Gaussian process with a common
mean value. When the hypothesis was verified by the Student’s-t-Test, it can be concluded that the observer gave consistent answers in this individual subjective experiment. Otherwise, the data from this individual experiment might not be valid and should be rejected. The whole process that utilizes Student’s-t-Test will be referred to as “Consistency test” in this paper.
Similarly, the correctness of each pair condition would be checked by the “Consistency test”. It was performed on Smn and 1- Snm, where Smn was a binary vector and expressed as [M (1,m,n), M(2,m,n),…, M(t,m,n)] assuming there were totally t individual subjective experiments, as shown in Fig. 5(2). It represented all of the observers’ selections one by one for the trial that stimulus m and n were compared, and stimulus m was presented first.
In our experiment, the Student’s-t-Test was performed at 5% significance level. Both, the screening of observers and the verification of each pair condition passed the “Consistency test”.
Fig. 5. The matrices used in the raw data validation test. (1) The diagram of the upper and lower triangular matrix used for screening of the observers. (2) The diagram of the vector used for the verification of each pair condition.
3.2. Evaluation of the Thurstone model scores
As the raw data had passed the “Consistency test”, it indicated that the presentation order didn’t influence the experimental results. We reconstructed the matrix for individual subjective experimental results as follows: the value in the row m and column n counted the number of times that stimulus m was selected over stimulus n. The presentation order was not considered any more. E is used to express this new matrix. It should be noted that E(i,m,n)+E(i,n,m)=2 (Each pair was compared twice). G is used to express the new matrix for the global subjective
experimental results, in which ( , ) ( , , )
i
G m n =
∑
E i m n . F is used to express the matrix in which the row m and column n represent the proportion that stimulus m is selected overstimulus n in all subjective experiments,
and ( , , ) ( , ) 2 G m n F i m n t = × .
The Thurstone model [16][17] is frequently used in fitting paired comparison data and ranking data (after
rankings are transformed into paired comparisons). Thus, the Thurstone model was fitted to the matrix G to get the Thurstone scores. Then the data was linearly rescaled in the interval of [0, 1]. Score 0 corresponded to the condition which was closest to the 2-D conditions in this study and the viewers experienced the least visual discomfort. Score 1 corresponded to the condition in which viewers experienced the most visual discomfort in the experiment.
The Thurstone scores of all stimuli for visual discomfort are shown in Fig. 7. Firstly, we checked how well the Thurstone scores of all stimuli fitted to the global subjective experimental results. MThurstone (m,n) is used to represent if
the Thurstone score of stimulus m is higher than that of
stimulus n. Thus, MThurstone is a binary matrix without
considering the diagonal elements. To compare the matrix MThurstone with the global subjective experimental results, the
matrix F is changed to a binary matrix by thresholding the value which is below the threshold 0.5 to 0 and above the threshold to 1. This binary matrix is expressed by FC. Two evaluation methods were used to check the agreement of the Thurstone scores with the global subjective experimental results. The first one was the “Consistency test”. It was
performed on the MThurstone and FC. And they passed the
“Consistency test”. Secondly, an “Agreement test” was conducted on the Thurstone scores and the global subjective experimental results, which means calculating the proportion
that the value in each position of MThurstone was the same with
the corresponding value in FC. The “Agreement test” result
was 0.96, which indicated that the Thurstone scores were highly consistent with the observers’ subjective perception.
1 2 3 4 5 6 7 8 9 10 11 12 13 14 15 0 0.1 0.2 0.3 0.4 0.5 0.6 0.7 0.8 0.9 1 T h e “ A g re em e n t te st ” re su lt s
Fig. 6. The “Agreement test” results for each individual subjective experiment results and the Thurstone scores. The dashed line represents the mean of all results.
After verifying the Thurstone scores based on the global experimental results, we checked the agreement of the Thurstone score with the individual subjective experimental results. The “Agreement test” was performed on E for each
individual subjective experiment and MThurstone. The results
are shown in Fig. 6. Their mean value was 0.7914 and the standard deviation was 0.0833, which indicated that most of observers agree with the Thurstone score.
4. ANALYSIS OF RESULTS ON DISPARITY AND VELOCITY
4.1. The effects of disparity and velocity on visual discomfort
As there were a foreground object and a background in the stimulus, the relative disparity between the foreground object and the background was used to analyze their effects on visual discomfort. The binocular angular disparity of the background was -1.4 degree, thus the 5 relative angular disparity levels of the foreground object were 0.1, 0.75, 1.4, 2.05, 2.7 degree. Fig. 7 and Fig. 8 show the effects of relative disparity and velocity on visual discomfort.
The vergence-accommodation conflict is one of the well accepted reasons that may result in visual discomfort. Thus, in our experiment, it was expected that the stimuli with large magnitude of angular disparity should induce more visual discomfort since the vergence-accommodation conflict was large in this situation. However, as shown in Fig. 7, it’s not the case, especially for the stimuli whose relative disparity was 0.1 degree but the binocular disparity were far beyond the comfortable viewing zone, their ratings of visual discomfort were much lower than the stimuli with 0 degree
of binocular angular disparity. The
vergence-accommodation conflict might have a smaller effect on visual discomfort in this situation. On the opposite, it could be clearly found that the ratings of visual discomfort increased with the relative angular disparity. Thus in our study, the relative angular disparity might have a predominant effect on visual discomfort and it might outweigh the vergence-accommodation conflict.
From Fig. 7 it can be seen that viewers were more likely to experience visual discomfort when the velocity was high. Thus it is suggested that for real-world applications, it might be necessary to reduce the depth budget for fast motion sequences while the depth budget for slow motion sequences may be increased.
Fig. 7 also shows that some stimuli may have a similar effect on visual discomfort. For example, there were four different conditions that their Thurstone scores were close to 0.7. In the following, the notation ‘(relative disparity, velocity)’ is used to express the stimulus. They were (0.1, 287.2), (0.75, 287.2), (2.05, 179.5) and (2.05, 71.8). It seems that the stimulus which had a large relative disparity and a slow velocity had a similar effect on visual discomfort when compared to the stimulus which had small relative disparity but fast velocity. For a more precise analysis of what kind of stimuli may have similar effects on visual discomfort, we checked the viewers’ experimental results, i.e. the matrix F, to find in which cases their values were near 0.5, we defined this range as [0.45 0.55]. The results are shown in Table I, where the stimuli were expressed by ‘(relative disparity, velocity)’. It seems important to note that besides the stimuli pairs which had similar velocities
and relative angular disparities, the table also confirms the hypothesis above: A stimulus which has large relative disparity and slow velocity might have a similar effect on visual discomfort compared to a stimulus which has small relative disparity but fast velocity. Thus, for viewers, slow moving stereoscopic sequences with large depth budget and fast moving stereoscopic sequences with small depth budget would result in a similar degree of visual discomfort.
0 0.5 1 1.5 2 2.5 3 0 0.1 0.2 0.3 0.4 0.5 0.6 0.7 0.8 0.9 1 Slow Medium Fast
Fig. 7. Normalized Thurstone scores for visual discomfort. The different lines represent the different velocity levels, where slow, medium and fast represent 71.8, 179.5 and 287.2 degree/s. The outer two dashed lines represent the upper and lower limits of the comfortable viewing zone. The dashed line in the middle represents the position of screen plane.
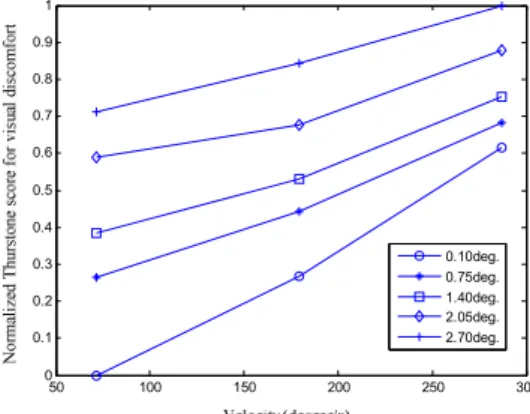
50 100 150 200 250 300 0 0.1 0.2 0.3 0.4 0.5 0.6 0.7 0.8 0.9 1 0.10deg. 0.75deg. 1.40deg. 2.05deg. 2.70deg.
Fig. 8. Normalized Thurstone scores for visual discomfort. The x-axis represents the velocity of the object, the y-axis represents the normalized Thurstone scores and the different lines represent the different relative disparity levels.
TABLEI
THE STIMULI PAIRS WHICH HAVE SIMILAR RATINGS ON VISUAL DISCOMFORT
Number Stimuli Pairs (relative disparity, velocity) 1 (0.75, 287.2) & (2.05, 179.5) 2 (0.1, 287.2) & (2.05, 179.5) 3 (0.1, 179.5) & (0.75, 71.8)
Fig. 8 depicts that the ratings of visual discomfort increase with the velocity for each relative disparity level. It can be found that besides the line with the relative disparity of 0.1 degree, the other 4 lines are nearly parallel. This indicates that the relative disparity might have a small influence on the slope of the visual discomfort scores for different velocities, except very small relative disparities.
Thus, the offset of the scores of two different relative disparity levels was nearly constant. For example, for the relative disparities of 0.75 and 1.4 degree, the distances of the two lines (as shown in Fig. 8) at different velocities were almost equal. Thus, the two stimuli which had two different relative disparities but the same velocities might give the viewers a similar degree of the perceived differences in visual discomfort, no matter how velocity changed. It should be noted that the conclusion above didn’t fit to the case of very small relative disparity, e.g., 0.10 degree; the differences of the scores between 0.1 degree and other relative disparities were significantly different at different velocities.
4.2. Discussion
In this study, the experimental results showed that viewers might experience more visual discomfort when the foreground object was moving in a depth plane with larger relative angular disparity. The vergence-accommodation conflict might not be a predominant factor in this study. It could be explained that due to the existence of a background, there would be two vergence points for the viewers in the stimuli, one was the background, and the other was the foreground object. When watching the stimulus, the viewers’ attention may switch between the background and the object. The larger of the relative distances between the foreground and background, the larger of the abrupt change of the amount of vergence-accommodation mismatch when switch from one object to another, which might be a cause of visual discomfort.
The experimental results also showed that for a fixed relative disparity level, viewers feel more visual discomfort when the object moves faster. Furthermore, if there were two stimuli, the viewers might experience a similar degree of visual discomfort when one was with large relative disparity and slow velocity and the other was with the small relative disparity but fast velocity. And, the two stimuli which had two different relative disparities but the same velocity might give the viewers a similar degree of the perceived differences in visual discomfort when velocity changed.
5. OBJECTIVE VISUAL DISCOMFORT MODEL 5.1. Construction of visual discomfort models
From the normalized Thurstone score it could be found that the visual discomfort was affected by the relative disparity and velocity of the object in the stimuli. To better identify their relationship, a visual discomfort model should be constructed. As the relationship of visual discomfort to relative disparity and velocity was nearly linear, the simplest model would be the one in Equation (3), which will be noted as Model 1:
1 2 3
where Q represents visual discomfort, a ,1 a and 2 a are 3 coefficients, v is the velocity and d is the relative angular disparity.
However, it might be possible that the relative disparity and velocity have an interaction effect on visual discomfort. For each velocity level, the relationship between visual discomfort and relative disparity was nearly linear. Thus, the visual discomfort can be expressed as:
1( ) 2( )
Q= f v d⋅ + f v (4) In our experiment, a linear function seems to be the
most appropriate fitting method. So, f1 and f2 are modeled as
linear functions of velocity. Finally, the visual discomfort can be described by Equation (5), where b1, …, b4 are all
constant and we define this as Model 2.
1 2 3 4
Q=b d⋅ +b v b d v b⋅ + ⋅ ⋅ + (5) A curve fitting was performed on the normalized Thurstone scores in our experiment, the predicted coefficients for the two models were 0.0018,0.2102, -0.0477 fora ,1 a ,2 a and 0.3110, 0.0026, -0.0006, -0.1888 for b3 1, b2,
b3, b4, respectively. Fig. 9 and Fig. 10 show the regression
results of the two models for visual discomfort. The solid lines show the predicted visual discomfort scores for different relative disparity and velocity, the dashed lines denote the normalized Thurstone scores in this experiment.
0 0.5 1 1.5 2 2.5 3 0 0.2 0.4 0.6 0.8 1 1.2 1.4 Model 1 Slow-fitted Slow-orig. Medium-fitted Medium-orig. Fast-fitted Fast-orig.
Fig. 9. The predicted visual discomfort of Model 1 in function of disparity and velocity. Solid lines represent fitted scores. Dashed lines represent original normalized Thurstone scores.
5.2. Evaluation of the fitted models
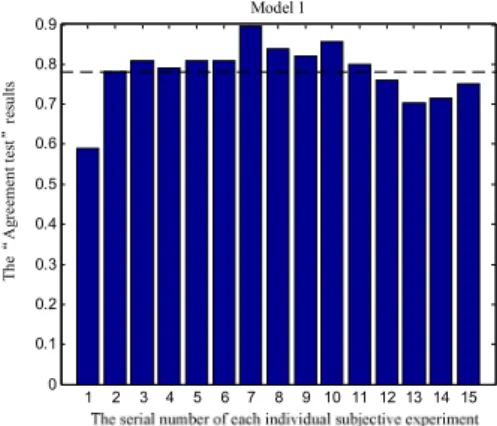
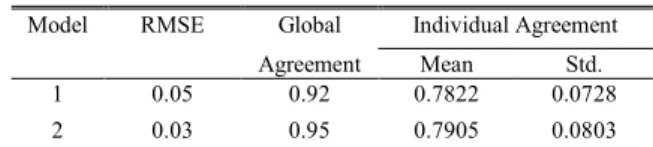
To evaluate the performance of these models on predicting the scores of visual discomfort, two methods were employed. Firstly, the RMSE of the fitted scores and the Thurstone scores were calculated. Then, the “Agreement test” was conducted on the individual subjective experimental results and the global subjective experimental results with the fitted two models. The “Agreement test” results for individual subjective experiment are shown in Fig. 11 and Fig. 12, for Model 1 and Model 2 respectively. The comparison results of the two models are shown in Table II. It could be found that there was no significant difference between the two
models. When considering the complexity, Model 1 is slightly preferable for use as an index for the stereoscopic image related researches, e.g., stereoscopic image quality assessment, visual discomfort, or 3-D video coding.
0 0.5 1 1.5 2 2.5 3 0 0.1 0.2 0.3 0.4 0.5 0.6 0.7 0.8 0.9 1 Model 2 Slow-fitted Slow-orig. Medium-fitted Medium-orig. Fast-fitted Fast-orig.
Fig. 10. The predicted visual discomfort of Model 2 in function of disparity and velocity. Solid lines represent fitted scores. Dashed lines represent original normalized Thurstone scores.
1 2 3 4 5 6 7 8 9 10 11 12 13 14 15 0 0.1 0.2 0.3 0.4 0.5 0.6 0.7 0.8 0.9 Model 1 T h e“ A g re eme n t te st ” re su lt s
Fig. 11. The “Agreement test” results of each individual subjective experimental result on the fitted Model 1. The dashed line represents the mean of all results, which is 0.7822.
1 2 3 4 5 6 7 8 9 10 11 12 13 14 15 0 0.1 0.2 0.3 0.4 0.5 0.6 0.7 0.8 0.9 1 Model 2 T he “ A gr ee m ent t es t” re sul ts
Fig. 12. The “Agreement test” results of each individual subjective experimental result on the fitted Model 2. The dashed line represents the mean of all results, which is 0.7905.
TABLE II.
COMPARISON RESULTS OF THE TWO MODELS Model RMSE Global Individual Agreement
Agreement Mean Std. 1 0.05 0.92 0.7822 0.0728 2 0.03 0.95 0.7905 0.0803
6. SUMMARY AND CONCLUSIONS
In this study, the experimental results provided some new findings. Firstly, the relative angular disparity between the foreground and the background might be more significant in determining the visual discomfort than the binocular angular disparity of the foreground. The vergence-accommodation conflict might not significantly affect the visual discomfort in this study. Secondly, the planar motion with faster velocity results in more visual discomfort. Thirdly, a stimulus which has large relative disparity and slow velocity might have a similar effect on visual discomfort compared to a stimulus which has small relative disparity but fast velocity. Finally, the differences of the visual discomfort scores between two stimuli with different disparities were nearly constant, on which the velocity might have a quite small effect.
To quantify the effects of relative angular disparity and velocity on visual discomfort, two visual discomfort models were constructed. Both of them showed high correlation with subjective perception on visual discomfort. The preferred one with less algorithmic complexity can be used as an index for some related researches, e.g., stereoscopic image quality assessment, stereoscopic image coding.
It should be noted that there was a limitation in our experiment. The velocity and disparity level were comparably coarse which may not give a precise measurement about their effects on visual discomfort. Furthermore, in this study, we only investigated the effects of velocity and disparity on visual discomfort. Some other factors that may result in visual discomfort as well, e.g., the size of the object, the background type, the motion trajectory will also be investigated in the future.
7. ACKNOWLEDGEMENT
The participation of the observers is gratefully
acknowledged. This work has been partly conducted within the scope of the JEDI (Just Explore Dimension) ITEA2 project which is supported by the French industry ministry through DGCIS and the PERSEE project which is financed by ANR (project reference: ANR-09-BLAN-0170).
8. REFERENCES
[1] M. Lambooij and W. IJsselsteijn “Visual Discomfort and Visual Fatigue of Stereoscopic Displays: A Review,” Journal of Imaging Science and Technology, vol. 53, no. 3, pp. 1-14, 2009.
[2] D.M. Hoffman, A.R. Girshick, K. Akeley and M.S. Banks, “Vergence-accommodation conflicts hinder visual performance and cause visual fatigue,” Journal of Vision, vol. 8, no. 3, pp.1-30, 2008.
[3] F.L. Kooi and A. Toet, “Visual comfort of binocular and 3D displays,” Displays, vol. 25, pp.99-108, 2004.
[4] P.H.J. Seuntiёns, L.M.J. Meesters and W.A. IJsselsteijn, “Perceptual attributes of crosstalk in 3D images,” Displays, vol. 26, pp.177-183, 2005.
[5] L.M.J. Meesters, W.A. IJsselsteijn, and P.J.H. Seuntiens, “A survey of perceptual evaluations and requirements of three-dimensional TV,” IEEE Transactions on Circuits and Systems for Video Technology, vol. 14, no. 3, pp.381-391, 2004.
[6] M.Lambooij, M.Fortuin, W.IJsselsteijn and I.Heynderickx, “Visual Discomfort Associated with 3D Displays,” Fifth International Workshop on Video Processing and Quality Metrics (VPQM), 2010.
[7] F. Speranza, W.J. Tam, R. Renaud, and N. Hur, “Effect of disparity and motion on visual comfort of stereoscopic images,” in Proc. of SPIE, vol. 6055, pp.94-103, 2006.
[8] S. Yano, S. Ide, T. Mitsuhashi and H. Thwaites, “A study of visual fatigue and visual comfort for 3D HDTV/HDTV images,” Displays, vol. 23, no. 4, pp.191-201, 2002.
[9] S. Yano, M. Emoto and T. Mitsuhashi, “Two factors in visual fatigue caused by stereoscopic HDTV images,” Displays, vol. 25, no. 4, pp.141-150, 2004.
[10] W. Chen, J. Fournier, M. Barkowsky and P. Le Callet, “New Requirements of Subjective Video Quality Assessment Methodologies for 3DTV”, Fifth International Workshop on Video Processing and Quality Metrics (VPQM), 2010.
[11] N. Holliman, “3D Display Systems,” In Handbook of optoelectronics, Edited by J. P. Dakin and Robert G. W. Brown, Taylor & Francis, London, 2005.
[12] D.H. Brainard, “The Psychophysics Toolbox,” Spatial Vision, vol. 10, pp. 443-446, 1997.
[13] D.G. Pelli, “The videotoolbox software for visual psychophysics: Transforming numbers into movies,” Spatial Vision, vol. 10, pp. 437-442, 1997.
[14] ITU-R Recommendation BT.500, “Methodology for the subjective assessment of the quality of television pictures,” 1974-2004.
[15] G.A.Gescheider, Psychophysics: The Fundamentals, Third Edition, Chapter 9, Lawrence Erlbaum Associates, Inc., New Jersey London, 1997.
[16] L.L.Thurstone, “A law of comparative judgment,” Psychological Review, vol. 34, pp.273-286, 1927.
[17] R. Rajae-Joordens and J. Engel, “Paired comparisons in visual perception studies using small sample sizes,” Displays, vol. 26, no.1, pp.1-7, 2004.