Determination of left ventricular systolic wall thickness by
digital subtraction angiography
M. JAKOB, O. M. HESS, R. JENNI, J. T. HEYWOOD, J. GRIMM AND H. P. KRAYENBUEHL Medical Policlinic, Cardiology, University Hospital, Zurich, Switzerland
KEY WORDS: Digital subtraction angiography, conventional angiography, echocardiography, left ventricular wall thickness, left ventricular muscle mass.
The accuracy of digital subtraction angiography (DSA)for determination of left ventricular (LV) systolic wall thickness and muscle mass was evaluated in 20 patients (mean age 50+11 years). Conventional L V angiograms were digitized and subtracted using a combined subtraction mode ('mask mode' and 'time interval difference' subtraction). Wall thickness and muscle mass were determined at end-diastole, after the first- and second-third of systole andat end-systole. M-mode echo-cardiography (Echo), which was obtained from beam selection of the two-dimensional echocardiogram and conventional angiography (LVA), served as reference techniques. Angiographic LV wall thickness and muscle mass were determined according to the technique of Rackley in both, right (RAO) and left (LAO) anterior oblique projections, whereas echocardiographic wall thickness was measured just below the mitral valve orthogonal to the posterior wall ( = LAO equivalent). Percent wall thickening was calculated in all patients.
LV end-diastolic wall thickness and muscle mass correlated well between DSA and LVA (LV end-diastolic wall thickness in LAO projection r = 0-72, biplane L V end-diastolic muscle mass r = 0-83). LV end-systolic wall thickness (1-44 vs 1-33 cm, P<005) and percent wall thickening (52 vs42%, P<0-05) compared favourably between echocardiography and DSA but was significantly larger when echocardiographically measured than with DSA (LAOprojection). DSA and echocardiography showed a good correlation in regard to LV end-diastolic and end-systolic wall thickness (correlation coefficient r = 0-89, standard error of estimate SEE=0-15 cmor 13% ofthemean value). There were only minimal changes in LV biplane muscle mass (DSA) from end-diastole to end-systole ( + 4%).
It is concluded that both LV end-diastolic and end-systolic wall thickness and muscle mass can be determined accurately by DSA. Systolic wall thickening is systematically overestimated by M-mode echocardiography compared to DSA due to the over estimation of end-systolic wall thickness.
Introduction determination of LV function and geometry; this Left ventricular (LV) wall thickness and geometry are technique is often used for pre- and postoperative important determinants of left ventricular function, determination of LV wall thickness and muscle W -\ Several non-invasive techniques such as echocardiogra- b u* c a n b,e used only for determination of end-d.astohc
phy, magnetic resonance and computer tomography wall thickness and muscle mass. Exact determination allow quantitative assessment of LV wall thickness and o f \y end-dmstoltc wall th.ckness and muscle mass muscle mass""5'. M-mode echocardiography is associated IS a l s o pouss*e™th i n t r a v e"o u s digital s u b t r a c t s
with high temporal and spatial resolution, but does not angiography"1'. The purpose of th.s study was to.evaluate
allow accurate visualization of left ventricular geometry. t h e accuracy of digital subtraction ang.ography for
deter-Two-dimensional echocardiography shows the geometric m i n a t l 0 n o f L V ^ 'o /'c w a l 1 t h l c* f - f a n d ,m u s c * m a s* '
relations of the left ventricle, but its low temporal and b e c a u s e a c c u r a t e determination of LV systolic wall
thick-spatial resolution does not allow accurate determination n e s s by conventional ang.ography is not possible in most
of LV wall thickness. Magnetic resonance is accompanied Pa t i e n t s
-with high spatial, but low temporal resolution. It has been
shown recently that wall thickening161 and muscle mass171 Patients and methods
can be determined accurately by magnetic resonance. Twenty consecutive patients (15 male, 5 female: 50 ± 11 The resolution of computer tomography is very high y e a r s of a g e) who underwent cardiac catheterization
for both qualities, but the technique cannot produce for diagnostic purposes were studied by conventional
oblique image planes for accurate determination of wall angiography one or several days (1 ± 16 days) after angi-thickness. Angiography is an invasive technique which is ography by M-mode echocardiography. Coronary artery based on contrast material injection into the left ventricle, disease was diagnosed in 13 patients. Seven patients had The angiographic method'8' is associated with a high normal coronary arteries. The angiography of one patient
temporal and spatial resolution and allows reliable had to be excluded for technical reasons. One patient did Submitted for publication on 29 January 1990, and in revised form 2 July 1990. "Ot u n d e r g o echocardiography.
Correspondence: Otto M. Hess, Medical Policlinic, Cardiology, University A 1 1 Patients h a d Conventional left Ventricular
cineangi-Hospital, Raemistrasse 100,8091 Zurich, Switzerland. Ography first, with injection of 40 to 50 ml U r o g r a p h i n
35 mm PROJECTOR VANGUARD M-3SC
r ^ b i V M
lm*\ MOUSE LINEPRINTER
J
IMAGE PROCESSOR SYSTEM | DeAnza IP8500
5 1 2 x 5 1 2 x 8 I
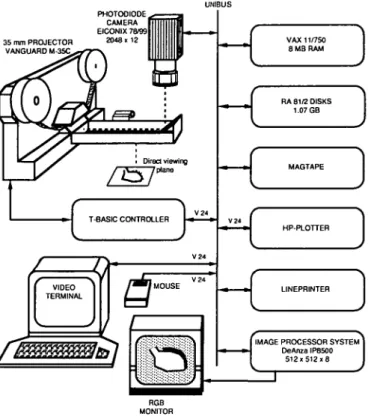
Figure I Image processing system for digital subtraction angiography. The cinefilm (50 frames s~') is projected (upper left corner) on a Vanguard film projector and digitized on an Eiconix photodiode camera. The digitized data are stored on a DeAnza image processor system (lower right corner) and processed on a VAX 11/750 computer. Digitized data are displayed on a high resolution monitor (lower left corner). Left ventricular contours and wall thickness are traced manually using a semi-automatic system with a 'mouse' controlled cursor.
(12ml.s ') into the left ventricle using a 8F-pigtail catheter. The angiogram was recorded in two orthog-onal projections (30° right anterior = RAO and 60° left anterior = LAO oblique projection) on cinefilm using a Siemens Angioscope system at a frame rate of 50 frames s~". A standard lead of the ECG and a numeri-cal code, which appeared on cinefilm and oscillograph (Electronics for Medicine VR12), were recorded during biplane angiography at a paper speed of 250 mrn.s"'.
At the end of the procedure, a metal sphere of known diameter (6 cm) was filmed to correct for radiographic magnification.
DIGITAL SUBTRACTION ANGIOGRAPHY (DSA)
The cinefilm was scanned on a computer-assisted (VAX 11/750) image processing system (DeAnza IP8500: 512 x 512x8 bit resolution) with a modified film-projector (Vanguard M-35C) and a high resolution photodiode camera (Eikonix 78/99) (Fig. 1). The film-projector was computer-controlled and preselected images were digitized automatically. Individual image points were digitized and stored on hard disk. After subtraction, the image was linearly amplified to extend the brightness over the whole dynamic range of the image processing
sys-tem'12'. Two different subtraction methods were used for
optimal contour detection of the left ventricular wall.
Mask mode subtraction (MMS)
The subtraction mask was usually taken before the contrast medium was injected into the left ventricle at the beginning of the film sequence'12"14'. Several contrast
images were averaged using a cineframe at the beginning of the injection for clear visualization of the ventricular border and a late cineframe after the passage of the con-trast bolus through the left ventricle for visualization of the left ventricular wall. One to eight images were averaged, usually two to four images.
Time interval difference (TID)
This method was based on the same subtraction algor-ithm as the mask mode subtraction. However, the time interval between the contrast and mask frame was in the range of 60-100 ms. Only single frames were used for time interval subtraction; thus, image sharpness was higher for time interval than for mask mode subtracted images.
MMS and TID mode (combined method)
A combined method, allowing sequential super-position of the two subtraction modes'"12' was used for
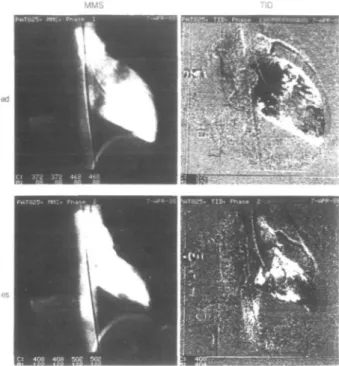
Figure 2 Representative digital angiogram in the right anterior oblique (RAO) projection in a patient with normal left ventricular function. The mask mode (MMS) subtracted images are shown on the left, and the time-interval-difference (TID) subtracted images on the right. The upper two panels represent the end-diastolic (ed) and the lower two panels the end-systolic (es) subtracted images. Left ventricular wall thickness can be clearly seen in the TID subtracted images (right) over the anterolateral wall of the left ventricle.
MMS
Figure 3 Representative digital angiogram in the left anterior oblique (LAO) projection in the same patient as in Fig. 2. Left ven-tricular wall thickness can be seen in both the MMS and TID sub-tracted images over the posterolateral wall of the left ventricle. Other abbreviations are as in Fig. 2.
2 and 3). This method takes advantage of the relative imaging strengths of each method (e.g. time interval sub-traction mode allows determination of the rapidly moving sections of the LV wall, and mask mode subtraction of the slowly moving parts).
Contour detection and volume calculation
Contour detection and LV volume determination have been previously reported'121. The silhouette was traced by
a semi-automatic contour-detection algorithm on a high-resolution monitor. The observer selected with a 'mouse' controlled cursor, a variable number of fixed points which were connected by a cubic spline function'121. Usually, a
set of 15 to 20 points resulted in an acceptable definition of the LV contour. LV wall thickness and muscle mass were determined in RAO and LAO projection in approxi-mation of the technique of Rackley and coworkers'81.
LV volume was calculated using the 'area-length' method for monoplane angiograms. LV muscle mass was calcu-lated in monoplane and biplane projection according to Rackley and coworkers'81. The following equation was
used for calculation of biplane muscle mass (LMM):
LMM = 1 -05 {4/3TT(L/2 + Wth) (S/2 + Wth)
(SL/2 + Wth)-LVV}
where L (cm) is the LV long axis in RAO projection, S (cm) is the short axis in RAO projection, Wth represents LV wall thickness in RAO projection, LVV is equal to LV volume, SL (cm) represents the short axis in LAO
projec-tion, and 105 (g.ml~') is the specific gravity of heart muscle.
All parameters were determined by two independent observers at the following time points: end-diastole (ed), first-third of systole (1/3), second-third of systole (2/3) and end-systole (es). One patient, with a poor quality angiogram, had to be excluded from LVA and DSA. LV wall thickness could not be determined by DSA in one patient in the RAO, and in another in the LAO projection, respectively. LV end-diastolic wall thickness could not be detected in LAO projection by conventional angiography in two patients. End-diastole was defined as the time point of the contrast image closest to the Q-wave in the standard electrocardiogram and end-systole as the image at the incisural aortic pressure'"1. When no simultaneous aortic
pressure tracing was available, end-systole was taken at the smallest LV silhouette.
CONVENTIONAL ANGIOGRAPHY (LVA)
LV end-diastolic and end-systolic silhouettes were traced by an experienced observer. End-diastolic wall thickness was drawn over the anterolateral wall in RAO and over the posterolateral wall in LAO projection (Figs 2 and 3). LV silhouettes were digitized manually using an electronic digitizer (Numonics digitizer linked to a PDP 11/34) and LV end-diastolic volume, wall thick-ness and muscle mass were calculated on a PDP 11/34 computer.
ECG ivs S5SSH 5 c m Is 16 years
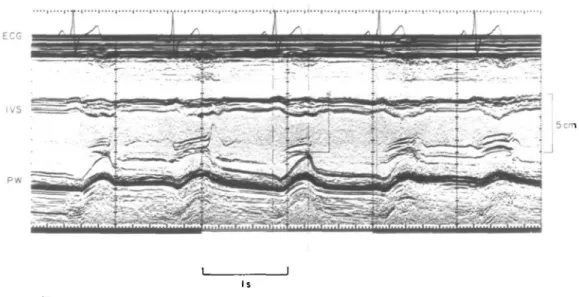
Figure 4 M-mode echocardiogram from beam selection of the two-dimensional echocardiogram in a patient with normal left ventricular function. Septal (IVS) and posterior wall thickness (PW) can be seen clearly in this patient. M-mode echocardiograms are digitized manually and posterior wall thickness is measured at end-diastole, after the first- and second-third of systole and at end-systole. Comparisons between posterior (echocardiographic) and posterolateral (angiographic) wall thickness are carried out for validation purposes. For further explanations see text. ECG: Electrocardiogram.
Table 1 Angiographic data
L V A DSA HR(min-') SCT (ms) EDVi RAO ( m l m2) EDViLAO(ml.m 2) EDVibi(ml.m-2) EF RAO (%) EF LAO (%) EF bi (%) 69+13 373 ±48 81 ±24 77±17 — 90 ±23 f66±7 L57 + 7 70+12 376 + 47 80 ±23 . 83 + 21 91 + 22 62±9"| 55 + 8 J 67± 13 378 + 43 — — — — 61±6 58 + 8
LVA = left ventricular angiography, DSA = digital subtraction angiography, E = echocardiography, RAO = right anterior oblique projection, LAO = left anterior oblique projection, HR = heart rate, SCT = systolic contraction time, EDVi RAO = end-diastolic volume index in RAO projection, EDVi LAO = end-diastolic volume index in LAO projection, EDVi bi = end-diastolic volume index in biplane projection, EF RAO = ejection fraction in RAO projection, EF LAO = ejection fraction in LAO projection, EF bi = biplane ejection fraction.
*/><005, **P<001, ***/><0001.
M-MODE ECHOCARDIOGRAPHY (ECHO)
Two-dimensional echocardiography was carried out by an experienced observer on a Hewlett Packard 77020AC system. Posterior wall thickness and left ventricular internal diameter were recorded by M-mode echocardi-ography from beam selection of the two-dimensional echocardiogram just below the mitral valve orthogonal to the posterior wall'11. Only good quality
echocardio-grams were included in the present analysis. Endo- and epicardial echoes were determined according to the 'leading edge' theory. Repetition rate of M-mode echo-cardiograms obtained from beam selection of the two-dimensional echocardiogram is high (i.e. 1-28 kHz at
12-cm depth and 1 0 kHz at 16-cm depth) and is similar to conventional M-mode echocardiography (i.e. 1 kHz repe-tition rate). All echocardiograms were digitized manually
1-5 £ i o 05 -0 - -0 - r=0-78 - P<O-OOI _ SEE =0-2 cm . SEE%=I7% ; / O&& a a i i i i i i i • 1 1 1 1 1 0-5 1-0 DSA (en 2-0
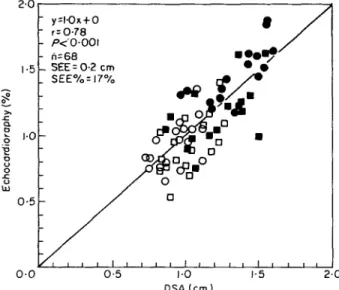
Figure 5 Correlations between angiographic (DSA) and echocar-diographic wall thickness data in 17 patients with coronary artery disease or normal left ventricular function. Data points (n = 68) are given at end-diastolic (O), after the first- (D) and second- ( • ) third of systole, as well as at end-systole ( • ) . There is a good correlation, with a correlation coefficient of r = 0-78 and a standard error of estimate (SEE) in percent of the mean echocardiographic wall thick-ness of 17%. The slope of the relationship is close to 1 indicating that there is a good agreement ( = high accuracy) between the two measurements.
and wall thickness was calculated at 5 to 10 ms intervals from end-diastole to end-systole (Fig. 4). Data were deter-mined at the same four time points as with DSA (end-diastole, at the end of the first and second-third of systole and at end-systole). In one patient, echocardiography was not performed. End-diastole was defined as the time point when the Q-wave in the standard electrocardiogram occurred and end-systole at the smallest internal chamber diameter'"1. The systolic contraction time (Table 1) was
defined as the time interval between end-diastole and end-systole.
STATISTICS
A least squares linear regression analysis was used for comparison of LV wall thickness, muscle mass and vol-ume between DSA, LVA and echocardiography. The line of identity, the correlation coefficient (r) as well as the standard error of estimate (SEE) are given in Fig. 5. Com-parison of two sets of data (e.g. DSA versus echocardi-ography or LVA versus DSA etc.) was performed with a paired t-test or a Wilcoxon test for paired differences, and three sets of data (DSA versus LVA versus echo-cardiography) with a Friedman non-parametric test for overall differences. In all tables mean values + 1 standard deviation are given.
Results
A representative end-diastolic and end-systolic digital angiogram is shown in the RAO (Fig. 2) and LAO (Fig. 3)
wall thickness can clearly be seen in the time interval subtracted images over the anterolateral wall of the left ventricle in RAO and over the posterolateral wall in LAO projection.
STANDARD HAEMODYNAMICS (TABLE 1)
Heart rate and systolic contraction time were not significantly different during LVA, DSA and echocardi-ography. LV end-diastolic volumes in RAO, LAO and biplane projection were not significantly different between LVA and DSA. Ejection fraction tended to be slightly lower (NS) during DSA than LVA.
LV LONG AND SHORT AXES (TABLE 2)
LV end-diastolic and end-systolic long and short axes were identical in RAO and LAO projection for LVA and DSA. The end-diastolic and end-systolic echocardio-graphic LV short axes were significantly smaller than the corresponding axes in LAO projection for both conven-tional and digital angiography. However, the echocardio-graphic short axes compared well with the corresponding angiographic axes in the RAO projection (NS).
LV WALL THICKNESS (TABLE 3 AND FIGS 5 AND 6)
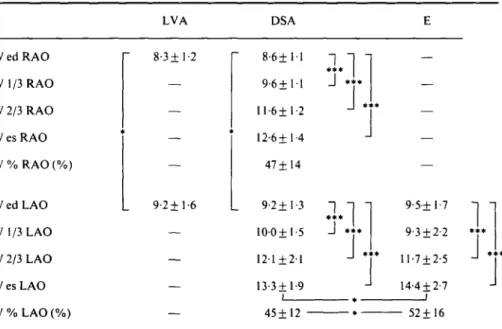
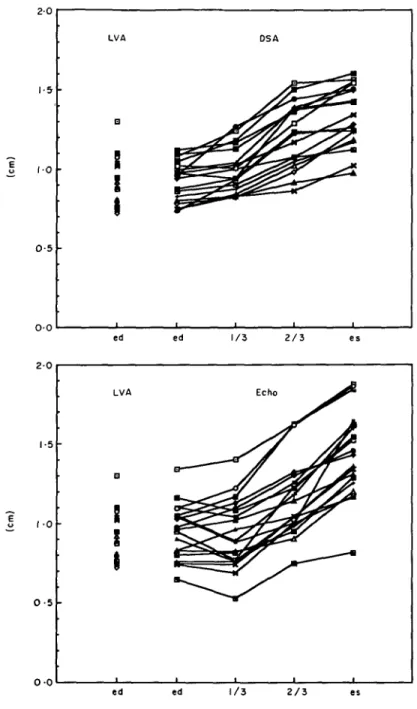
LV end-diastolic wall thickness was significantly smaller in RAO than LAO projection (conventional and digital subtraction angiography). LV wall thickness increased continuously from end-diastole to end-systole in RAO and LAO (Fig. 6) projection (DSA). In contrast, echocardiographic wall thickness remained unchanged during the first-third of systole but increased more during the last-third of systole, resulting in a significantly thicker end-systolic wall thickness than with DSA (LAO projec-tion). Systolic wall thickening was similar in RAO and LAO projection (DSA) but was echocardiographically larger (P<005) than LAO wall thickening. The linear regression between echocardiographic and angiographic (DSA, LAO projection) LV diastolic and end-systolic wall thickness showed a good relationship with a correlation coefficient of 0-89 (standard error of esti-mate 0-15 cm = 13% of the mean echocardiographic wall thickness). When the wall thickness data at all four time-points (end-diastole, first- and second-third of systole, end-systole) were compared between DSA and echocardi-ography the correlation coefficient was slightly less good (0-78, standard error of estimate 018 cm =17% of the mean echocardiographic wall thickness) than for the comparison with two time-points (Fig. 5).
LV MUSCLE MASS (TABLE 4 AND FIG. 7)
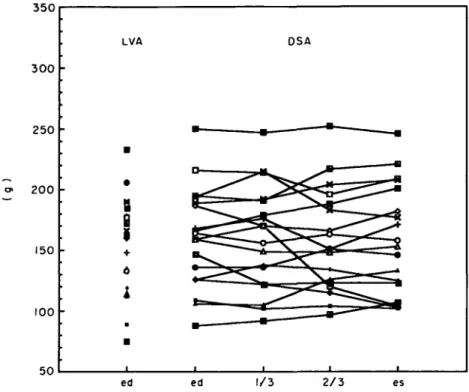
LV end-diastolic muscle mass in RAO and biplane projec-tion was slightly larger with DSA than with LVA. There was, however, a good correlation between these two methods (correlation coefficient 0-82) with a standard error of estimate of 25g ( = 1 5 % of the mean LVA muscle mass). LV muscle mass remained unchanged during systolic contraction (0% change from end-diastole to end-systole in RAO and 4% increase in
Table 2 LV long and short axes (cm) LVA DSA L RAO ed L RAO es L LAO ed L LAO es S RAO ed S RAO es S LAO ed S LAO es *** * * * L 9-4 + 0-9 7-7 + 0-7 7-4+1-1 5-8±0-8 5-4 + 0-7 3-5 + 0-7 6-0 + 0-9 4-4 + 0-8
n
* * * L 9-4 + 0-9 7-9±0-8 7-6+1-1 6-0 + 0-9 5-3±0-6 3-6±0-7 6-1+0-9 4-6±0-8L = long axis, S = short axis, ed = end-diastole, es = tnd-systole, other abreviations are as in Table 1. ***/><0001.
Table 3 LV wall thickness (mm)
LVA DSA W ed RAO W 1/3 RAO W 2/3 RAO W es RAO W % RAO (%) W ed LAO W 1/3 LAO W 2/3 LAO W es LAO W % LAO (%) 8-3+1-2 9-2+1-6 8 - 6 ± l l 9 - 6 ± l l 11-6+1-2 l2-6±l-4 47± 14 9-2+1-3 1 0 0 + 15 12-1+2-1 13-3 + 1-9
J
J
T
9-5+ 17 9-3±2-2 11-7 + 2-5 14-4 ±2-7J .
45+12 52+16W = LV wall thickness, 1 /3 = first-third of systole, 2/3 = second-third of systole, other abreviations are as in Tables 1 and 2.
* />< 0 0 5 , ***/><0001.
biplane projection) although considerable variations were the difference was also small and was not different for observed in single patients (Fig. 7). end-diastolic and end-systolic wall thickness data.
ACCURACY AND PRECISION
The mean difference ( = accuracy) and the standard deviation of the difference ( = precision) were calculated for LV wall thickness between DSA (LAO projection) and M-mode echocardiography. The mean difference was small at diastole (001 cm) but was larger at end-systole (009cm, P < 0 0 5 ) . The standard deviation of
Discussion
Digital subtraction angiography has been shown to be a reliable tool for assessing left ventricular volume and ejection fraction not only at rest112"14', but also during
exercise'"12'. Exact determination of left ventricular
wall thickness and muscle mass by digital subtraction angiography'"15' has been shown to be possible at
LVA DSA LMM ed RAO LMM 1/3 RAO LMM 2/3 RAO LMM es RAO LMMedbi LMM 1/3 bi LMM 2/3 bi LMM es bi 154 + 40 163 + 43 160 ± 41 160±43 158±42 159 + 45 172 ± 4 5 174 + 46 175 + 47 179 + 49
LMM = LV muscle mass, bi = biplane projection, other abreviations are as in Tables 1, 2 and 3.
end-diastole, but end-systolic wall thickness and muscle mass have only been studied in the experimental animal'51,
not in patients during routine cardiac catheterization. Since Rackley and coworkers'81 reported in 1964 that left
ventricular wall thickness and muscle mass can be deter-mined accurately by left ventricular angiocardiography, assessment of systolic wall thickness by this technique has not been performed due to the low contrast and difficult contour detection, although quality of conventional angiography has considerably improved in recent years. Hugenholtz and coworkers'161 have developed a
math-ematical approach to calculate systolic wall thickness assuming muscle mass to be constant during systolic contraction. However, the introduction of digital imaging techniques in the late 1970s enabled us to study more precisely left ventricular geometry and pump func-tion not only by direct administrafunc-tion of small amounts of contrast material into the left ventricle but also by intra-venous injection of contrast medium. The purpose of the present study was to evaluate the value of digital subtrac-tion angiography for determinasubtrac-tion of systolic wall thick-ness using conventional left ventricular angiograms. If determination of systolic wall thickness and muscle mass are correct, then changes in muscle mass from end-diastole to end-systole must be minimal.
DETERMINATION OF SYSTOLIC WALL THICKNESS AND MUSCLE MASS
Only in nine of the 20 patients could systolic wall thickness be delineated by conventional left ventricular cineangiograms (RAO projection n = 2, LAO projection n = 7). In most patients systolic wall thickness could not be seen on the standard angiogram due to low contrast or to superposition of surrounding tissue. After subtraction of the background and digital enhancement of the angio-gram, left ventricular systolic wall thickness could be identified in most patients (RAO: 18 of 20 patients, LAO: 18 of 20 patients). Contour detection was usually easier with time interval difference (TID) than mask mode sub-traction (MMS) because the wall is moving rapidly during systolic contraction (Figs 2 and 3). MMS subtraction tended to be more accurate for detection of end-diastolic wall thickness (slowly moving regions). Thus, the combi-nation of both subtraction modes proved to be best for
thickness.
There was a continuous increase in wall thickness from end-diastole to end-systole (Fig. 6). However, muscle mass remained constant during systolic contraction (Fig. 7) indicating that wall thickness measurements are correct because otherwise muscle mass would change (Table 4). There was a 9% increase in wall thickness (DSA) during the first-third of systole, a 21% increase during the second-third and a 9% increase during the last third of systolic contraction (Table 3 and Fig. 6). In contrast, M-mode echocardiography showed a 2% decrease during the first-third, a 26% increase during the second-third and a 23% increase during the last third of systole (Fig. 6). Interindividual variations in the course of systolic wall thickening observed with M-mode echocardiography could be due to differences in systolic contraction time. However, systolic contraction time varied only minimally (5$ 1-3%) between angio- and echocardiography; this suggests no influence of systolic contraction time on echo-cardiographic assessment of systolic wall thickening. Left ventricular end-diastolic wall thickness was significantly larger in LAO than RAO projection (Table 3) and, there-fore, biplane left ventricular muscle mass was significantly (P<005) larger (172g) than monoplane muscle mass (160 g). Echocardiographic wall thickness compared very well with angiographic wall thickness in LAO projection, but overestimated end-systolic wall thickness signifi-cantly (/><005) when compared to digital subtraction
angiography. Thus, systolic wall thickening was signifi-cantly (P<005) larger with M-mode echocardiography (52%) than with digital subtraction angiography (45%). Over-estimation of end-systolic wall thickness and sys-tolic wall thickening by M-mode echocardiography is likely to be due to non-orthogonal beam direction across the posterior wall. This is probably caused by translational and rotational movements of the heart. Heart motion does not affect angiographic wall thickness determination as much as echocardiographic measure-ments since angiocardiography allows assessment of the outermost border of the ventricle ( = tomographic method).
ACCURACY, PRECISION AND CORRELATIONS WITH M-MODE ECHOCARDIOGRAPHY
Left ventricular end-diastolic and end-systolic wall thickness correlated well (correlation coefficient 0-89, standard error of estimate of the mean wall thickness 13%) between digital subtraction angiography and M-mode echocardiography. The correlation was some-what less good (Fig. 5) when all data points (end-diastole, first- and second-third of systole as well as end-systole) were included in the comparison (correlation coef-ficient 0-78, standard error of estimate of the mean wall thickness 17%). There was, however, a close 1:1 relationship between angiographic and echocardio-graphic wall thickness (slope 10, intercept 0 cm). The mean difference was very small (001 cm) indicating a high accuracy of digital angiography for estimating left ventricular echocardiographic wall thickness. The
0 - 5 •
0 0
ed ed 2 / 3
Figure 6 Angiographic ( = DSA; upper panel) and echocardiographic ( = M-mode echo; lower panel) wall thickness measurements at end-diastole (ed), after the first- (1/3) and second- (2/3) third of systole as well as at end-systole (es) in 17 patients with coronary artery disease or normal left ventricular function. There is a continuous increase in left ventricular wall thickness during systolic contrac-tion; however, echocardiographic wall thickness shows no change during the first-third of systole and shows slightly more scatter for individual patients than DSA. The comparison with conventional angiographic wall thickness (LVA) at end-diastole shows a good agreement between DSA and M-mode echo.
standard deviation of difference was also small (0-19 cm) between the two techniques suggesting a good precision for estimating posterior wall thickness by digital angiography. The mean difference was, however, significantly (P < 005) larger at end-systole (009cm) than at end-diastole (001 cm) and, thus, accuracy is less good for estimation of end-systolic than end-diastolic wall thickness.
CLINICAL IMPLICATIONS
Digital enhancement of standard left ventricular angio-grams allows accurate and precise determination of left ventricular wall thickness over the anterolateral and posterolateral region of the left ventricle. Similar data have been reported by others for end-diastolic wall thick-ness and muscle mass (Table 5). This has not been possible
300 • 250 • 200 • 150 -100 • 50 LVA •
B
II1
6I
• • I • DSA — • — • • • ai ——~*™ _ .... — H- .... u» — • - ^ ^ • i i ed ed 1/3 2 / 3 esFigure 7 Determination of left ventricular muscle mass in the right anterior oblique (RAO) projection by digital subtraction angiography (DSA) at end-diastole (ed), after the first- (1/3) and second- (2/3) third of systole as well as at end-systole (es) in 17 patients with coronary artery disease or normal left ventricular function. There is virtually no change in muscle mass by DSA (see also Table 4). However, three patients show a clear decrease in muscle mass towards end-systole, indicating underestimation of end-systolic wall thickness in the RAO projection over the anterolateral wall. Comparison with conventional angiography (LVA) shows a good agreement for end-diastolic muscle mass between the two techniques.
Table 5 LV wall thickness and muscle mass data from the literature. Comparison of left ventricular wall thickness and muscle mass data from the literature between M-mode echocardiography (Echo) and conventional angiography (LVA) as well as between digital subtraction angiography (DSA) and conventional angiography
Echo SEE
(mm)
SEE Mean Echo (mm) Mean LVA (mm) L V wall thickness Troy"1 Sjoegren""J Murray120' Present data LV muscle mass Troy"' Murray1201 DSA L V wall thickness Grob"" Lauberi'5! Present data LV muscle mass Grob"11 Lauber"" Present data 24 20 21 16 24 21 24 20 16 24 20 18 0-89 0-77 0-77 0-76 0-88 0-83 0-81 0-74 0-72 0-83 0-85 0-83 1-3 4 0 1-9 10 (g) 49 55 0-7 1-8 11 (g) 23 54 25 14 26 19 11 (%) 20 22 8 16 12 (%) 12 19 15 8-5 15-4 8-8 9-5 (g) 214 120 7-7 10 2 9-2 (g) 177 260 172 9-2 15-3 9-8 9-2 (g) 246 249 8-9 110 9-2 (g) 192 285 163 Spooled end-diastolic and end-systolic data.
with conventional angiocardiography and therefore rep-resents a step forward in the determination of systolic function parameters, such as systolic wall stress, end-systolic pressure-wall thickness, end-end-systolic stress-wall thickness relations for the assessment of regional contrac-tility, and regional wall stiffness parameters'1718'. Most
authors have used a simplified approach to calculate sys-tolic wall thickness (Hugenholtz technique) assuming muscle mass to be constant during systolic contraction'16'.
This is a reasonable technique since muscle mass, as in the present study (Fig. 7), remained almost unchanged during systolic contraction.
A major limitation of digital subtraction angiography is its invasive nature. It is also unable to measure the left ventricular regional wall thickness. New imaging tech-niques such as magnetic resonance might be attractive for regional determinations of wall thickness, but long sam-pling times make the technique very sensitive for motion artefacts and hence influence accuracy and precision.
References
[1] Troy BL, Pombo J, Rackley CE. Measurement of left ventricu-lar wall thickness and mass by echocardiography. Circulation 1972; 45: 602-11.
[2] Devereux RB, Casale PN, Eisenberg RR, Miller DH, Klingfield P. Electrocardiographic detection of left ventricular hypertro-phy using echocardiographic determination of left ventricular mass as the reference standard. J Am Coll Cardiol 1984; 3:82-7. [3] Miller SW, Dinsmore RE, Wittenberg J, Maturi RA, Powell WJ Jr. Right and left ventricular volumes and wall measurements: Determination by computed tomography in arrested canine hearts. Am J Roentgenol 1977; 129:257-61.
[4] Florentine MS, Grosskreutz CL, Chang W et al. Measurement of left ventricular mass in vivo using gated nuclear magnetic resonance imaging. J Am Coll Cardiol 1986; 8: 107-12. [5] Radtke W, Buersch JH, Brennecke R, Hahne HJ, Heintzen PH.
Assessment of left ventricular muscle volume by digital angio-cardiography. Invest Radiol 1983; 18: 149-54.
[6] Fischer MR, von Schulthess GK, Higgins CB. Multiphasic cardiac magnetic resonance imaging: normal regional left ventricular wall thickening. Am J Roentgenol 1985; 145: 27-30. [7] Katz J, Milliken MC, Gundersen JS, Buja LM, Parkey RW, Mitchel JH, Peshock RM. Estimation of human myocardial mass with magnetic resonance imaging. Radiology Nov 1988; 169:495-8.
[8] Rackley CE, Dodge HT, Coble YD, Hay RE. A method for determining left ventricular mass in man. Circulation 1964; 29: 666-71.
[9] Krayenbuehl HP, Hess OM, Schneider J, Turina M. Riick-bildung der Herzhypertrophie bei Patienten mit operierten Aortenklappenfehlern. Z Kardiol 1985; 74 (Suppl II): 110-8. [10] Kennedy JW, Twiss RD, Blackmon JR, Merendino KA.
Hemodynamic studies one year after homograft aortic valve replacement. Circulation 1968; 37 (Suppl II): 145-52. [11] Grob D, Hess OM, Monrad E, Birchler B, Grimm J,
Krayenbuehl HP. Determination of left ventricular wall thick-ness and muscle mass by intravenous digital subtraction angio-cardiography: validation of the method. Eur Heart J 1988; 9: 73-86.
[12] Birchler B, Hess OM, Murakami T, Niederer P, Anliker M, Krayenbuehl HP. Comparison of intravenous digital subtrac-tion cineangiocardiography with convensubtrac-tional contrast ven-triculography for the determination of the left ventricular volume at rest and during exercise. Eur Heart J 1985; 6: 497-509.
[13] Brennecke R, Brown TK, Buersch J, Heintzen PH. Digital processing of videoangiocardiographic image series using a minicomputer. Computers in cardiology, St. Louis; 1976: 255-60.
[14] Vas R, Diamond GA, Forrester JS, Whiting JS, Swan HJC. Computer enhancement of direct and venous-injected left ventricular contrast angiography. Am Heart J 1981; 102: 719-28.
[15] Lauber A, Deetjen W, Jehle J, Poelitz B, Schmiel FK, Spiller P. Digitale Subtraktionsangiographie: Genauigkeit der Messung von linksventrikularen Wanddicken und Wandvolumina bei intravenoser Kontrastmittelinjektion. Z Kardiol 1984; 73: 257-63.
[16] Hugenholtz PA, Kaplan E, Hall E. Determination of left ven-tricular wall thickness by angiography. Am Heart J 1969; 78: 513-22.
[17] Buechi M, Hess OM, Murakami T, Krayenbuehl HP. Left ventricular wall stress distribution in chronic pressure and vol-ume overload: effect of normal and depressed contractility on regional stress-velocity relations. Basic Res Cardiol, 1990; 85: 367-83.
[18] Mirsky I, Corin WJ, Murakami T, Grimm J, Hess OM, Krayenbuehl HP. Correction for preload in assessment of myocardial contractility in aortic and mitral valve disease. Circulation 1988; 78: 68-80.
[19] Sjoegren AL, Hytoenen I, Frick MH. Ultrasonic measurements of left ventricular wall thickness. Chest 1970; 57: 37-40. [20] Murray JA, Johnston FW, Reid JM. Echocardiographic
determination of left ventricular dimensions, volumes and performance. Am J Cardiol 1972; 30: 252-7.