Status and prospect of the Swiss continuous Cs
fountain FoCS-2
A Jallageas1, L Devenoges2, M Petersen1, J Morel2, L-G Bernier2, P Thomann1 and T S¨udmeyer1
1 Laboratoire Temps-Fr´equence, Universit´e de Neuchˆatel, Neuchˆatel, Switzerland 2
Photonics, time and frequency laboratory, Federal Institute of Metrology (METAS), Bern, Switzerland
E-mail: [email protected]
Abstract. The continuous cesium fountain clock FoCS-2 at METAS presents many unique characteristics and challenges in comparison with standard pulsed fountain clocks. For several years FoCS-2 was limited by an unexplained frequency sensitivity on the velocity of the atoms, in the range of 140 · 10−15. Recent experiments allowed us to identify the origin of this problem as undesirable microwave surface currents circulating on the shield of the coaxial cables that feed the microwave cavity. A strong reduction of this effect was obtained by adding microwave absorbing coatings on the coaxial cables and absorbers inside of the vacuum chamber. This breakthrough opens the door to a true metrological validation of the fountain. A series of simulation tools have already been developed and proved their efficiency in the evaluation of some of the uncertainties of the continuous fountain. With these recent improvements, we are confident in the future demonstration of an uncertainty budget at the 10−15level and below.
1. Introduction
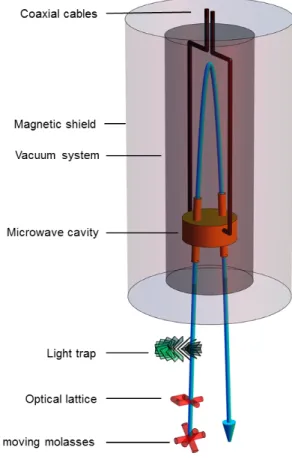
FOCS-2 is the only Cs fountain clock worldwide taking advantage of a continuous atomic beam. This characteristic brings a series of remarkable advantages compared to the classical pulsed fountains. For instance, a frequency stability below the standard Dick limit has been demonstrated using a commercial synthesizer [1] and the low density of the cold atomic beam maintains the collisional shift at a minimum [2]. Furthermore, the fundamentally different principle of operation contributes to the metrological diversity. Several upgrades to the original design have been implemented in the last few years, such as the design and the implementation of a new microwave Ramsey cavity with reduced phase gradients [3]. These improvements led us to focus on the evaluation of electromagnetic perturbations in the system and its effects on the clock frequency. Figure 1 shows a schematic representation of FoCS-2.
2. Shift due to microwave currents
In recent years, many in-depth analyses were carried out on pulsed fountains to evaluate the impact of microwave frequency shifts due to microwave leaks in the atomic resonator [5–7]. In the case of FoCS-2 several investigations led us to postulate that the velocity dependent 140 · 10−15 fractional frequency shift is caused by a peculiar type of microwave leakage. The unwanted electromagnetic field is generated by spurious currents circulating on the surface of the coaxial cables which lie very close to the apogee of the trajectory. When the atomic velocity is varied,
8th Symposium on Frequency Standards and Metrology 2015 IOP Publishing Journal of Physics: Conference Series 723 (2016) 012010 doi:10.1088/1742-6596/723/1/012010
preparation stage. Through the microwave cavity, the atoms ex-perience a first π/2-pulse and evolve freely for 0.52 s before they undergo a second π/2-pulse on the way down. Fi-nally, the transition probabil-ity between |F = 3, m = 0i and |F = 4, m = 0i is measured by fluorescence detection of the atoms in F = 4. A light trap suppresses the stray light from the atomic cooling and state preparation stages from reach-ing the free evolution zone situ-ated above [4].
the distance between the apogee and the coaxial cables is varied hence the velocity dependent frequency shift. In order to avoid this effect a coating of microwave-absorbing graphite was added to the surface of the coaxial cables and on the inner wall of the vacuum chamber. Additionally, several pieces of graphite were placed near the cavity (as shown in figure 2).
Figure 3 shows the substantial decrease in frequency dependency on the velocity from 140 · 10−15 to 3 · 10−15after the implementation of the graphite absorbers. The reduction by a factor 50 of this effect supports the theory of microwave currents and opens up the possibility of reaching the expected performance of the clock. That being so, different sustainable solutions to fully eliminate this shift are under preparation. One consists in a graphite cylindrical shield placed above the microwave cavity to protect the free evolving atoms by absorbing the spurious microwave radiation.
2.1. Optical transport of microwave radiation
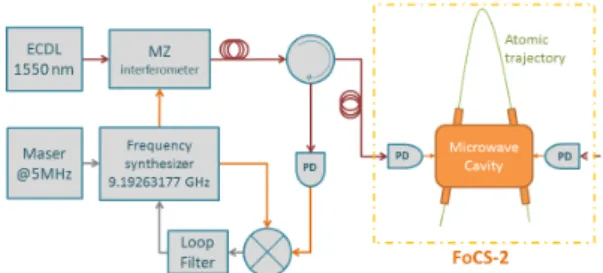
Another solution towards minimizing microwave leak issues consists in transporting the two microwave signals to the microwave cavity optically, using optical fibers, and by performing the optical-electrical conversion directly inside the microwave cavity couplers [8]. Figure 4 shows a schematic of the experimental setup for one of the two microwave feeds. The optical power generated by an extended cavity laser diode (ECDL) emitting at 1550 nm is modulated at 9.19263177 GHz using a Mach-Zehnder Modulator (MZ), driven by a low noise frequency synthesizer. The modulated light is transported to the microwave cavity using a single-mode fiber. The optical-electrical conversion is performed using unbiased PIN photo-diodes (PD)
Figure 2: Photo of the cavity with microwave cables coated with graphite. Pieces of graphite can also be seen around the cavity for additional absorption of the microwave radiation.
Figure 3: Relative frequency offset of FoCS-2 as a function of the average atomic launch velocity varying from 3.90 m/s to 4.10 m/s. Red dots show the measured frequency with the unwanted background microwave radiation. The blue squares show the significantly decreased change in frequency which was obtained using graphite coating cables.
Figure 4: Schematic of the optical transport of the microwave radiation from the synthesizer to the cavity and the opto-electrical conversion made on a fast photo-diode.
Figure 5: Phase noise measurement of the LO at the output of the synthesizer (Squares) and after optical transport over a 2 m long optical fiber (Dots).
directly imbedded in the cavity microwave feeders. A feedback loop, acting on the measured back-reflected light from the PD, allows the compensating of possible thermally induced phase shifts in the fiber.
Therefore, the optical microwave transfer system must preserve the noise properties and spectral purity of the high performance local oscillator (LO) at 9.19263177 GHz. We have measured the phase stability and the excess phase noise on a simplified open loop version of the test setup. A phase drift produces frequency offsets similar to the effect of an end-to-end cavity phase shift. A five day long measurement showed no phase drifts above 10 µrad/s (1.5 · 10−16) across any one hour time period. A continuous fountain is much less sensitive to the Dick effect as compared to a pulsed clock [9], which significantly lowers the constraint on the phase noise performances of the LO. We show in figure 5 the measured phase noise of the LO with and without optical transfer through a 2 meter long optical fiber. The shaded area highlights the
on the numerical data are artifacts due to the limited number of trajectories used in the simulation. (b) Microwave power-dependent frequency shifts for different pulse areas in the experimental and numerical cases. The vertical scale shows the frequency difference between asymmetric and symmetric feeding of the microwave cavity.
noise level where the short term stability of the continuous fountain is still limited by the atomic shot-noise. These preliminary results suggest that this technique is a very promising solution for solving the issue of microwave leakages encountered in many fountains and will be further investigated.
3. Finite element modeling and Monte Carlo simulations
3.1. Numerical evaluation of the microwave cavity related frequency shifts
The microwave cavity of FoCS-2 was designed to have a low mode density and a reduced time-averaged power flow across the interaction zones [3]. Its dimensions were optimized such that the TE105 electromagnetic mode would be resonant at ν0 = 9.19263177 GHz. Four cutoff waveguides confine the field to the cavity. A specific diaphragm design at their upper and lower ends eliminates atomic trajectories close to the edges of the cavity [10]. We used a full 3D finite elements model (FEM) to compute simultaneously the amplitude H and the phase φ of the electromagnetic field throughout the interaction zones. As a first approach to evaluate the FEM and for possible later use in evaluating the gradient phase shift [11], we have solved Maxwell’s equations numerically for symmetric and asymmetric cavity feeding to reproduce the power measurements that were performed experimentally. Using these results and a theoretical model of 2×3 Zeeman sublevels atoms following trajectories through the FoCS-2 fountain, we developed a Monte Carlo simulation allowing us to quantify the phase shifts in the unique FoCS-2 cavity. We present in figure 6 the first results computed to validate the numerical models. Figure 6.a shows the computed Ramsey fringes for the |F = 4, m = 0, ±1i Zeeman sublevels together with the experimental data. The free parameters of the Monte-Carlo simulations were adjusted to reproduce the real atomic trajectories. Figure 6.b shows a rough comparison of the total microwave power-dependent frequency shifts for experimental and numerical cases. We present the frequency difference between the asymmetric and symmetric microwave feeding to eliminate the contribution of other experimental effects. This good agreement between simulations and measurements allows us to use these numerical tools to support the experimental evaluation of FoCS-2.
3.2. Magnetic field homogeneity
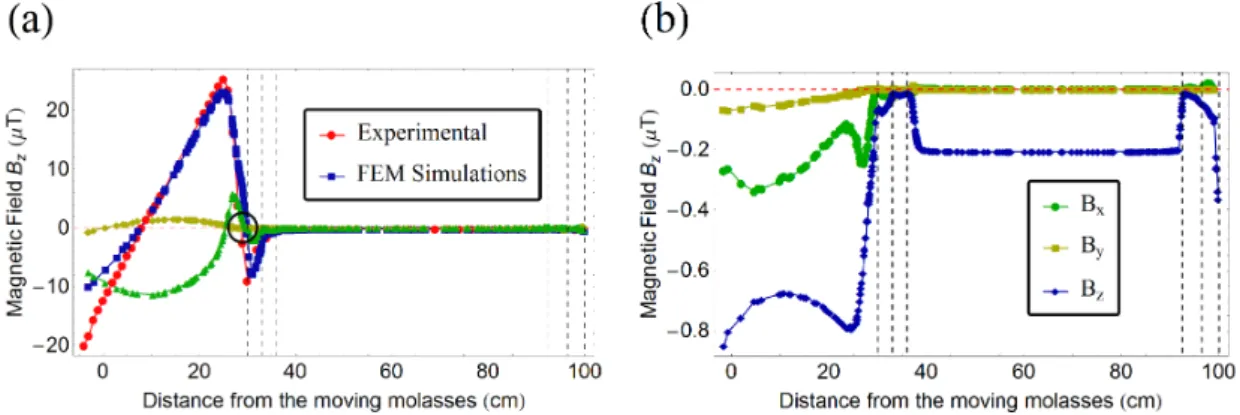
The homogeneity of the magnetic field inside the fountain is important for guaranteeing the efficiency of the state preparation and to avoid Majorana transitions. Zero-crossing of the field can induce atomic state coherences and frequency shifts [12]. Direct measurements of the
Figure 7: (a) Comparison of the vertical magnetic field component Bz from FEM simulations (blue
points) with direct measurements (red points) at different heights in the vacuum system. The green and yellow points show the simulated results of the X and Y components of the magnetic field. The black circle highlights a zero-crossing point of the three components Bx, By and Bz just before the free
evolution region shielded with three layers of mu-metal (vertical dashed lines). (b) Simulation of the three components of the magnetic field after optimization of the compensations coils currents. With this new configuration we suppressed the zero-crossing point to avoid parasitic Majorana transitions.
magnetic field between the optical molasses and the C-field region are not possible under normal clock operation. We developed a finite element model of the magnetic field throughout the whole fountain to predict its behavior when adjusting the external electric coils [13]. We implemented the C-field and the X-Y-Z compensation coils, ionic pump magnets, Earth magnetic field as well as the four layers of mu-metal shielding in the 3D model. All external field values were carefully measured in the laboratory and reproduced in the simulation. Figure 7.a shows the comparison between the model and the measured Bz field at different heights in the vacuum system. In-situ measurements were done with a one-axis flux-gate probe inserted inside the vacuum chamber while it being opened for maintenance. The good agreement between the data gives us a good confidence in the prediction of the magnetic field with the simulation although in this particular configuration it highlights a zero-crossing point. Figure 7.b shows the new magnetic field configuration without zero-crossing point after numerical tuning of the compensation coils.
4. Current status
Recent improvements on the lasers and on the optical setup have led to a better white frequency noise level. The FoCS-2 Allan deviation is now 8 · 10−14 at one second (see figure 8).
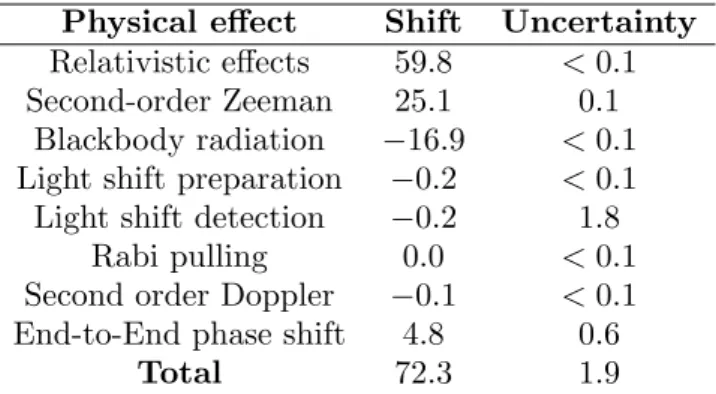
After the significant decrease in the effect of the microwave surface-currents on the microwave cables and the improvement of the stability, it has been possible to improve the investigation on the uncertainty budget. A preliminary version of the uncertainty budget is shown in table 1. Some effects such as the distributed cavity phase shift and the collisional shift are not included as these have not been evaluated yet. The uncertainty on the light shift measurement due to detection light is shown as the limiting factor. This is due to relatively short measurements. Longer measurement series are expected to easily bring down the uncertainty. Eventually, a second light trap can be inserted between the microwave cavity and the detection region. The second-order Zeeman shift is estimated by two methods time-resolved Zeeman spectroscopy and Fourier transform of Ramsey fringes measured on Zeeman sensitive components. The uncertainty is limited by the atomic vertical velocity distribution (basically the vertical temperature). It is expected to be further improved by detailed modeling of the effect of the atomic velocity distribution on the two methods. The end-to-end shift was evaluated using a reversal mechanism
Figure 8: The relative frequency stability (Allan deviation) of the FoCS-2 frequency compared to the local H-maser. The red line shows the best fit at 8 · 10−14τ−1/2.
End-to-End phase shift 4.8 0.6
Total 72.3 1.9
Table 1: Present status of FoCS-2 uncertainty budget (×10−15).
5. Conclusion
The understanding of microwave surface current perturbations and its significant reduction as well as the development of new numerical tools are significant steps toward the complete metrological evaluation of FoCS-2 at the 10−15 level and below. We report here a preliminary uncertainty budget of 1.9 · 10−15(excluding certain important effects) and a short term stability of 8 · 10−14at 1 s, which confirms the relevance of the continuous atomic clock. Our first priority for the time being is to finalize a robust solution for removing the microwave perturbations and to complete the uncertainty budget advancing towards a future contribution to TAI.
References
[1] Devenoges L, Stefanov A, Joyet A, Thomann P and Domenico G D 2012 IEEE Trans. Ultrason. Ferroelectr. Freq. Control 59 211–216 ISSN 08853010
[2] Dudle G, Mileti G, Joyet A, Fretel E, Berthoud P and Thomann P 2000 IEEE Trans. Ultrason. Ferro electr. Freq. Control. 47 438–442
[3] Devenoges L, Bernier L G, Morel J, Di Domenico G, Jallageas A, Petersen M and Thomann P 2013 2013 Jt. Eur. Freq. Time Forum Int. Freq. Control Symp. EFTF/IFC 2013 1 1
[4] F¨uzesi F, Jornod A, Thomann P, Plimmer M D, Dudle G, Moser R, Sache L and Bleuler H 2007 Rev. Sci. Instrum. 78 103–109 ISSN 0034-6748
[5] Shirley J H, Levi F, Heavner T P, Calonico D, Yu D H and Jefferts S R 2006 IEEE Transactions on Ultrasonics, Ferroelectrics, and Frequency Control 53 2376–2384 ISSN 08853010
[6] Weyers S and Schr¨oder R 2006 IEEE Transactions on Ultrasonics, Ferroelectrics, and Frequency Control 173–180
[7] Guena J, Abgrall M, Rovera D, Laurent P, Chupin B, Lours M, Santarelli G, Rosenbusch P, Tobar M E, Li R, Gibble K, Clairon A and Bize S 2012 IEEE Trans. Ultrason. Ferroelectr. Freq. Control 59 391–410 ISSN 08853010 (Preprint 1204.3621)
[8] Jallageas A, Petersen M, Devenoges L, Bernier L G and Morel J 2015 Jt. Conf. IEEE IFCS EFTF, April 12-16 (2015).
[9] Joyet A, Mileti G, Dudle G and Thomann P 2001 IEEE Transactions on Instrumentation and Measurement 50 150–156 ISSN 00189456
[10] Li R and Gibble K 2010 Metrologia 47 534–551 ISSN 0026-1394 (Preprint 1008.1505)
[11] Gu´ena J, Li R, Gibble K, Bize S and Clairon A 2011 Phys. Rev. Lett. 106 130801 ISSN 0031-9007 (Preprint 1103.1633)
[12] Wynands R, Schr¨oder R and Weyers S 2007 IEEE Trans. Instrum. Meas. 56 660–663 ISSN 00189456 [13] Jallageas A, Devenoges L, Petersen M, S¨udmeyer T and Morel J 2014 28th Eur. Freq. Time Forum, June
23-26
[14] Di Domenico G, Devenoges L, Joyet A, Stefanov A and Thomann P 2011 Freq. Control Eur. Freq. Time Forum (FCS), 2011 Jt. Conf. IEEE Int. 1–5 ISSN 1075-6787