Microscopic scale conductivity as explanation of magnetotelluric
results from the Alps of Western Switzerland
Gabriella Losito,
1Pierre-Andre´ Schnegg,
2Candice Lambelet,
2Cecilia Viti
3and
Antonello Trova
11
Dipartimento di Ingegneria Civile, University of Florence, Via di S. Marta, 3, 50139, Florence, Italy, E-mail: [email protected]
2
Institut de Ge´ologie, Universite´ de Neuchatel, Switzerland,
3Dipartimento di Scienze della Terra, University of Siena, Italy
Accepted 2001 July 2. Received 2001 May 21; in original form 2000 May 24
S U M M A R Y
Recent MT soundings carried out in the Penninic Alps of Valais have shown the presence of a very good, outcropping conductor. Extremely high conductivity was attributed to the presence of graphite.
To verify this assumption, the electrical properties of borehole black shales were measured under simulated physical conditions (electrical frequency, hydrostatic confining pressure, internal fluid pressure, temperature). These measurements showed that under all physical conditions (electrical frequency, in the 0.005–200 Hz interval; hydrostatic confining pressure up to 39 MPa; internal fluid pressure up to 23 MPa; temperature up to 180uC) one of the samples studied was very conductive (resistivity less than 2 Vm under all physical conditions). Interestingly, despite similar macroscopic aspect, other samples from a nearby borehole were found to be only slightly conductive. Chemical, mineralogical and petrographic investigations revealed that the enhanced electrical con-ductivity is mostly due to textural characteristics (such as grain size and carbon film distribution at the grain boundaries) rather than to chemical differences.
Key words: Alps, electrical conductivity, magnetotellurics, graphite
1 I N T R O D U C T I O N
Magnetotelluric soundings performed in various areas have indicated the presence of low-resistivity structures in the upper and middle crust. Among these areas there are the follow-ing European sites, the Lapland granulite belt (Korja et al. 1996), the Carpathians (Praus et al. 1990), Scotland and Ireland: Precambrian collision belt (Whelan et al. 1990), the Pannonian basin (Adam & Bielik 1998) the EGT Central segment (ERCEUGT-Group 1992).
The cause for enhanced conductivity is often thought to be related to the presence of carbon in the form of graphite. However, the nature of the good conductor often remains an open issue in the absence of direct investigation techniques, although extremely high conductivity values may be explained only by the presence of graphite and meta-anthracite-bearing rocks (Jo¨dicke 1992). In general, no simple cause is found, and candidates such as saline fluids saturating the pores, or inter-connected graphite are often invoked (Frost et al. 1989; Glover & Vine 1992; Jones 1992; Glover & Vine 1994; Glover & Vine 1995; Shankland et al. 1997; Roberts et al. 1999).
Schnegg (1998) carried out a magnetotelluric survey in the penninic part of the Swiss Alps, canton Valais, western Switzerland. Multidimensional modelling of the resulting data
(Schnegg 1993, 1999) revealed the existence of a very con-ductive slab embedded in a much more resistive rock matrix. The shape of the slab correlates well with reflecting horizons from an existing deep seismic reflection profile acquired across the Western Swiss Alps, that dips 35u SSE (Pfiffner et al. 1997). Furthermore, the modelling required that the northernmost edge of the slab was close to or at the surface. This edge was effectively found in the form of black shales.
VLF profiles have been measured in the area of the outcrop. Low resistivity cover (<5 Vm, challenging values for the VLF receiver) was found in this area. The occurrence of the out-crop provided an opportunity to study the cause of enhanced electrical conductivity in the upper- and middle crust using lab investigations of samples from two boreholes located in the area where MT data modelling indicated proximity to the body responsible for the high conductivity.
2 G E O L O G I C A L S E T T I N G
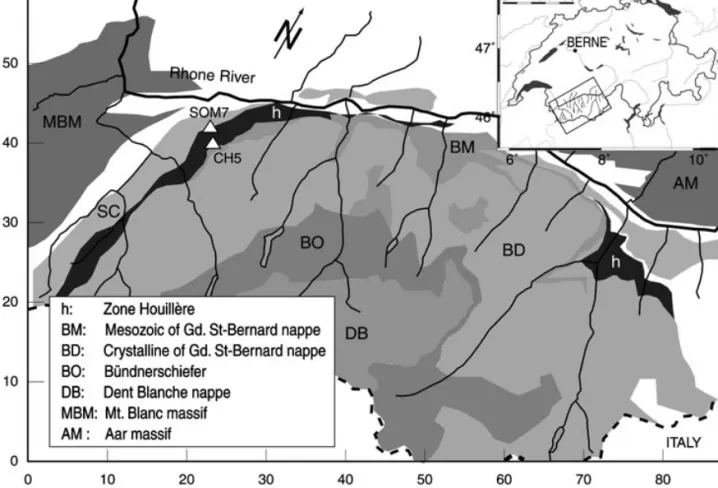
The region surveyed by MT is located in canton Valais and covers an area of 3200 km2
(Fig. 1). The Rhone Valley forms the contact between two domains: the Helvetic Zone to the NNW, and the Penninic domain to the SSE; all the MT field work was done on the latter. These domains overlay a pre-Triassic
basement complex, which has been modified by the Variscan orogeny. Mid-Cretaceous to Pliocene compressional move-ments acting on the Penninic ocean resulted in the development of the Penninic Alps. As many as four tectonic units are stacked over one another moving NNW to SSE. These are (from bottom to top) (Escher et al. 1997): (1) a thick sedimentary series (2) the Grand St-Bernard nappe, with its northernmost con-stituents, the Upper Carboniferous of the Zone Houille`re and the Permo-Carboniferous of the Stalden unit (1–2 km of dark schists and anthracite-bearing slates) representing potentially good conducting layers due to possible graphite content (3) the Schiste lustre´ Mesozoic sediments and (4) the crystalline base-ment rocks of Dent Blanche nappe. To the SW and NE, two crystalline, pre-Permian autochthonous blocks limit the area of study (Fig. 1).
Cylindrical core samples (diameter: 78.5 mm) studied as part of this investigation were obtained from two boreholes drilled in the Zone Houille`re (see location on Fig. 1). This segment forms the lower, external part of the Grand St-Bernard nappe. The samples consisted of sandstone and hand-staining black shales. The Zone extends laterally over more than 200 km and
represents the detrital filling of a Permo–Carboniferous graben system which was detached from its basement by alpine move-ments. The location of CH5 and SOM7 boreholes is given in Table 1.
3 E X P E R I M E N T A L F I E L D M E T H O D S : M A G N E T O T E L L U R I C S U R V E Y ,
S E I S M I C P R O F I L E A N D M O D E L
MT and GDS measurements were taken over an area of 3200 km2limited to the north by the Rhone river and to the South by the Swiss–Italian border. The location of the sites, the magnetotelluric data and the modelling results can be found elsewhere (Schnegg 1998, 1999). 2- and 3D modelling revealed the existence of a very low resistive (0.2 Vm), 1 km-thick slab embedded in a resistive, featureless 1300–3000 Vm rock matrix. The slab plunges in the SSE direction below the Alps with an average dip of 35u and follows the shape of the Alpine arc. With a total length of 20 km, its lower tip reaches a depth of 8 km. At its NNW edge, it crops out at the surface in the middle of the Houille`re Zone.
Figure 1. Tectonic map of the studied area showing the location of the boreholes SOM7 and CH5 (triangles).
Table 1. Location of the boreholes.
Borehole Abbr. Coordinates Elevation (m) Depth (m)
Les Etablons CH5 7u14k6aE /46u7k44aN 2048 318 Som de Pro window SOM7 7u13k13aE /46u8k39aN 1457 31.5
Comparison with existing seismic profiles (Pfiffner et al. 1997) shows very good agreement between the slope of the conducting feature in the MT model and the seismic reflectors. The plunging, very conducting layer can be interpreted as the southward continuation of the Zone Houille`re outcrop.
4 L A B O R A T O R Y E X P E R I M E N T A L M E T H O D S
To constrain the interpretation of the MT and GDS results, we studied the electrical properties of 3 representative samples from two boreholes located 4–5 km to the N of Verbier (SOM7 and CH5, see Fig. 1), on the NE flank of the Pierre Avoi peak. Both boreholes were drilled into the Houille`re Zone. The samples were examined using chemical, mineralogical and petrographical methods.
Three 36 mm diameter high schistosity black shale samples were investigated; two samples from borehole CH5 (CH5): schistosity perpendicular to cylinder axis, length: 40 mm; CH5//: schistosity parallel to cylinder axis, length: 70 mm) and 1 sample from borehole SOM7 (schistosity 45u with respect to cylinder axis, length: 40 mm).
4.1 Experimental electrical resistivity methods
The electrical properties of the samples were studied under simulated physical conditions (temperature T up to 180uC; con-fining hydrostatic pressure Peup to 39 MPa; internal pore fluid
pressure Piup to 23 MPa; current frequency ranging between
0.005 and 200 Hz). This study was performed using the experi-mental method described by Losito et al. (1991). The samples were studied without drying before the experimental cycles, because their cleavage and mineralogical composition make them very fragile. The 2-electrode array technique was used for the smallest samples (CH5) and SOM7), whereas the standard 4-electrode array technique was used for the largest sample (CH5//). As is well known the 2-electrode technique cannot keep the electrode polarization apart from the sample polarizations. The use of a 4-electrode array for the CH5) sample made evaluation of the electrode polarization of this sample possible and allowed us to extrapolate this information to other samples. The electrodes at the cylinder bases consisted of stainless steel plates (36 mm diameter, fully covering the cylinder bases) and are used as current electrodes for the 4-electrode array, but as current and voltage electrode for the of 2-electrode array. Good electrode to sample contact is achieved with a porous surface. The electrodes connect to stainless steel capillary tubes used to inject and pressurize the sample fluids, allowing homogeneous diffusion of the fluid. The voltage electrodes of 4-electrode array consisted of 0.3 mm stainless steel wire. They were installed in an ad hoc sample canal far away from the current electrodes. The electrodes have been accurately tested in the whole frequency interval used for the experiments under dry and hydrated conditions. Polarization phenomena were com-pletely absent. The samples and their electrodes were enclosed in a silicone polymer, selected according its elastic properties under the physical experimental conditions (max. working temperature: 240uC).
The electrical parameters were obtained using a pure sinusoidal waveform as the input signal; the frequency interval has been selected to correspond with the MT frequencies,
because various polarization phenomena may occur at every frequency interval. To describe the electrical behaviour of the rock, the real part of the complex resistivity r (Vm), the permittivity e (F /m) and the loss tangent tan d were auto-matically computed (Losito 1989) for each selected frequency. The total harmonic distortion rate (THD per cent) of the out-put signals was used to filter out the noise and the non-linear component of the output signals (Losito 1989). The complex resistivity parameters were calculated by using only the first harmonics of the input and output signals. To simulate the underground physical conditions, the thermo-baric cycles have been carried out following a rigorous procedure. Under these operating conditions, the heating produces permanent petro-physical alterations, mainly related to water and OHxcontent and distribution (Losito et al. 1991). Pressure can also produce permanent mechanical alterations (micro and macro cracks). We assume that every change (mineralogical or structural) is non-reversible, but the effect of the temperature on the conductivity is more important during the experiment interval. Consequently, we decided to submit the samples first to pressure changes, followed by temperature variations. Before launching the thermo-baric cycle, the sample was hydrated inside the vessel by injection of pure water through a capillary tube–porous electrode system. At the same time the hydration status was monitored by observing (1) resistivity changes of the sample and (2) water output through a second capillary tube–porous electrode system. In the following section, the experimental results will be analytically described, by comparison of the electrical behaviour of the samples with respect to variations of a main conditioning parameter (frequency, external confining pressure Pe, or internal fluid pressure Pi) at T= 20, 50, 80, 110,
150 and 180uC.
4.1.1 Time dependence
The samples, at natural water content, sealed by the silicon glue, were hydrated inside the vessel with deionized water using the porous electrode–capillary tube system. The resistivity at frequency 0.1 Hz has been measured during the initial flow of the injected fluid Pi, controlling the confining pressure Peat
the same time (SOM7 sample: Pi=3 MPa, Pe=6 MPa; CH5
samples: Pi=5 MPa, Pe=9 MPa). Due to the very low hydraulic
conductivity of the samples the applied pressure of the pore fluid did not allow the full saturation of the sample (no fluid observed outside the unconnected capillary tube after 3000 min). The samples were dried after the thermo-baric cycle. The water loss resulted in less than 0.1 per cent weight change, which is consistent with measurements of the mass of water adsorbed.
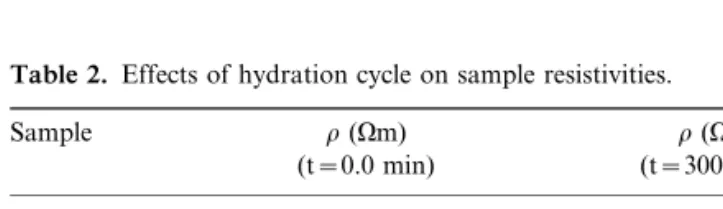
The laboratory measurements illustrate the high resistivity contrast between the two CH5 samples and the SOM7 sample (see. Table 2). In fact the CH5 samples appeared to be 3 orders of magnitude more resistive than the SOM7 sample, in spite of
Table 2. Effects of hydration cycle on sample resistivities. Sample r(Vm) (t=0.0 min) r(Vm) (t=3000 min) CH5// 2280.0 744.0 CH5) 7900.0 6040.0 SOM7 2.3 1.39
a very similar macroscopic appearance. These initial measure-ments also indicate a strong anisotropy effect (Lastovickova et al. 1993) in the CH5 samples. The variation of resistivity with time is slow and small. The observed continuous resistivity decrease must be attributed to the small quantity of water injected, which obviously acts more in the sample CH5//, where the layers are parallel to both water and current flux and thus, allow better formation of surface conduction paths.
4.1.2 Frequency dependence
The frequency dependence was measured in the 0.005–200 Hz range, under the internal pore fluid pressures, hydrostatic pressures, and temperatures as indicated in Figs 2(a), 3(a), and 4(a).
In general the resistivity r(v) shows small linear dispersive phenomena, more pronounced at lower frequencies. In particular
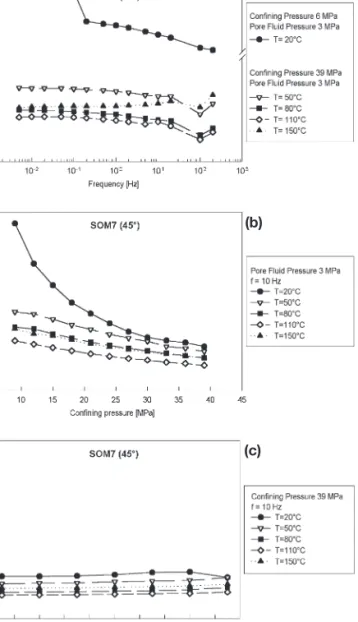
for the CH5 samples a noticeable frequency dispersion of r at very low frequencies (0.005–5 Hz, Figs 2a and 3a) is apparent; this dispersion must be attributed to phyllosilicate minerals (Losito & Muschietti 1987). A second polarization, confirmed by tan d(v) measurements at all temperatures and pressures, is present at frequencies f>0.1Hz and can be attributed to a metallic phase, such as pyrite, or possibly due to graphite (unpublished test on pure dry graphite shows frequency dis-persion in the 20–200 Hz range). The SOM7 sample (Fig. 4a) shows frequency dispersion of r (of about 20 per cent) to occur in the 0.1–100 Hz interval at T=20 uC (at this temperature the confined pressure was 6 MPa). This frequency dispersion is similar to the high frequency dispersion of CH5 samples, but more marked. The frequency trend of SOM7 r at T=20 uC shows a jump at f=0.1 Hz, that could be attributed to a small observed increase of the internal pore fluid pressure (1 MPa). At higher temperatures we have minor frequency dispersion of r respect to T=20 uC curve in a higher frequency range (10–100 Hz). This small frequency dispersion is confirmed also
(a)
(b)
(c)
Figure 2. Resistivity r (Vm) of CH5//sample (CH5 borehole, 318 m depth, layers parallel to the cylinder axis) at the given temperatures, under different simulated physical conditions; (a) as function of fre-quency; (b) as function of hydrostatic confining pressure; (c) as function of internal pore fluid pressure.
(a)
(b)
(c)
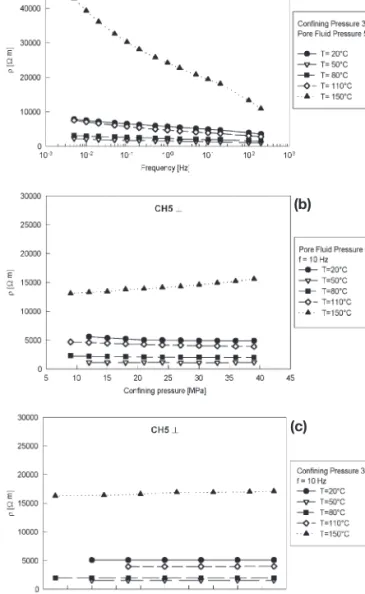
Figure 3. Resistivity r (Vm) of CH5) sample (CH5 borehole, 318 m depth, layers perpendicular to the cylinder axis) at the given temper-atures, under different simulated physical conditions: (a) as function of frequency; (b) as function of hydrostatic confining pressure; (c) as function of internal pore fluid pressure.
by tan d(v), that is 0.35 at 20 Hz. The r behaviour at higher temperatures can be attributed to linear dispersive phenomena, such as those induced by graphite.
4.1.3 Temperature dependence
In general resistivity decreases with temperature up to 80uC. This behaviour depends on the electrokinetic activity of the ions inside the fluid. From Fig. 4, it is evident that the resistivity decrease with temperature of the SOM7 sample is not expected. We attribute this to a higher carbon content compared to the CH5 samples. The curves of SOM7 for T=20 uC are quite different from others; the cause could be the low hydraulic permeability of this sample, which cannot produce high electro-kinetic effects at higher temperatures. At temperatures above 100uC the vapour effect is dominant and the resistivity depends on the joint effects of pressures (confining and pore fluid), temperature and sample foliation with respect to the probe axis,
as shown with the CH5 samples (Figs 2 and 3). The resistivity increase at high temperature may also depend on the OHx layers inside the phyllosilicates, as their movement can be activated by thermal energy.
It is important to note that the whole experimental cycle has been applied to each sample, so the resistivity decrease can be interpreted as an effect of repeated pressure cycling at increasing temperatures and should only be understood as relative con-ductivity measurements with respect to the initial values. However we prefer to show non-normalized resistivities.
4.1.4 External Confining Pressure dependence
The confining pressure produces opposite effects on electrical behaviour (measured at 10 Hz) of CH5 and SOM7 samples: resistivity shows small increases in the CH5//sample and in the CH5) only at T=150 uC, but resistivity decreases in sample SOM7; this behaviour can be attributed both to different grain sizes and carbon content. More specifically, for CH5 samples (Figs 2b and 3b) the foliation affects the electrical resistivity (with an anisotropy factor of more than 10). The increase of external confining pressure produces increase of the resistivity in sample CH5) (layers perpendicular to fluid injection) only at high temperatures (150uC). The resistivity of sample CH5// increases slightly as function of confining pressure at all tem-peratures, or is constant. This is related to the vapour action upon layering (microcracks). For the SOM7 sample (Fig. 4b), the resistivity decrease with increasing confining pressure is apparent at all studied temperatures; this behaviour can be attributed to the reconnection of conductive minerals, such as graphite. The dispersion of r at high frequencies under all temperatures appears to confirm this hypothesis.
4.1.5 Pore Fluid Pressure dependence
For all samples, increasing the pore fluid pressure had no relevant effect on the resistivity. The main cause of this behaviour is the very low hydraulic conductivity of the black shales, as indicated by the hydration cycles (Table 2). Consequently the pressurized pore fluid does not have sufficient access to the rock specimen to enter into connected pores and the pore fluid pressure cannot reach the equilibrium before the measurements were taken. It is possible that experiments of many months could solve the problem, using the working pressures described.
4.1.6 Concluding remarks
The results of the laboratory measurements described require further explanation of the cause of the resistivity difference between the samples from the two boreholes, measured under identical physical conditions. The laboratory results confirm the MT data, but do not allow an immediate petrophysical interpretation based on macroscopic petrographical evidences. Principal selected candidates in solving the problem were the carbon content and its connectivity. Nevertheless it is also important to know the phyllosilicate content and identify the metallic minerals (Losito & Muschietti 1998).
To investigate this issue further, chemical and petrographical investigations were carried out. These are described in the following section.
(a)
(b)
(c)
Figure 4. Resistivity r (Vm) of SOM7 sample (SOM7 borehole, 31.5 m depth, layers 45u with respect to the cylinder axis) at the given temper-atures, under different simulated physical conditions: (a) as function of frequency; (b) as function of hydrostatic confining pressure; (c) as function of internal pore fluid pressure.
5 P E T R O G R A P H I C A N D M I N E R A L O G I C A L S T U D I E S
The SOM7 and CH5 samples are black shales with similar appearance in hand specimen (no clear differences in texture, grain size and colour). Petrographic, chemical and mineralogical investigations were carried out to understand their different electrical behaviour. Attention was mostly paid to the C-content, the occurrence of C-minerals and to the rock texture (distribution of the C film).
The petrographic studies were carried out starting from four petrographic sections for each sample; the sections have been selected in different orientations with respect to the main foliation (one parallel, one perpendicular and two oblique). The SOM7 and CH5 samples appear to be mostly made of quartz and finely intergrown phyllosilicates. By comparing the corresponding petrographic sections of SOM7 and CH5 (i.e. sections in the same orientation with respect to the main foliation), only slight textural difference is observed; in particular, foliation is wider and broader in CH5 than in SOM7; moreover, grain size of the SOM7 sample appears to be smaller than in CH5. This evidence has been recently confirmed by crystallite size analyses, performed for samples SOM7 and CH5 at the Department of Earth Sciences in Florence. Reasonably, grain size could influence the C-film connectivity (in particular, the lower the grain size, the higher the connectivity).
The whole-rock chemical composition of SOM7 and CH5 have been obtained by X-ray fluorescence (XRF) spectrometry (Philips PW1414). Samples have very similar compositions (Table 3): main differences are in Na2O, MgO, K2O, Ba and Sr.
These data have been integrated by recent elemental measures at the Chemical Laboratory of Florence University, revealing that the C-content is 3.3 per cent for SOM7 and 1.34 per cent for CH5. The observed slight difference in the C-content cannot explain the difference in resistivity. The absence of a direct correlation between rock C-content and conductivity has been already observed by Korja et al. (1996).
X-ray diffraction (XRPD) patterns on whole-rock powders have been collected on a Philips PW1710 diffractometer, working
at 45 kV and 25 mA (radiation: CuKa): XRPD patterns provide a list of characteristic dhklspacing, from which it is possible to
determine the main rock-forming minerals. The experimental patterns of both SOM7 and CH5 revealed the presence of quartz, micas and chlorite (except for four very weak peaks, which cannot be related to any of the above minerals). Graphite was not detected, possibly due to its low crystallinity (producing very weak and broad diffraction) and to the interference between graphite peaks and those of the other present minerals.
The petrographic sections of SOM7 and CH5 have been examined at the scanning electron microscope (SEM, Philips XL30 working at 20 kV). An X-ray energy dispersive spectro-meter (EDS–EDAX DX4) has been used for mineral chemistry determinations. Since the X-ray detector is equipped with an ultra-thin window, it was possible to detect also light elements such as carbon. Moreover, owing to their high conductivity, neither SOM7 nor CH5 samples needed to be carbon-coated, as usual in electron microscopy: consequently, the presence of carbon minerals has been unequivocally evidenced from the corresponding EDS spectra.
In order to identify graphite in SEM images, mostly Back Scattered Electrons (BSE) have been used for image formation. In fact, contrast in BSE images is related to the mean atomic number; minerals with a low mean atomic number are dark, whereas minerals with higher mean atomic number are more or less bright. In SOM7 and CH5, dark areas correspond to graphite. Coarse grained grey crystals are mostly quartz (rarely feldspar), grey fine grained aggregates correspond to phyllosilicate intergrowths, white radial aggregates are formed by chloritoid, white euhedral crystals are apatite and opaque minerals (Figs 5 and 6). The BSE images show very well the differences in texture and in graphite distribution between SOM7 and CH5. In sample CH5, two different foliations are often evident (Fig. 5). Graphitic aggregates typically occur in thin layers (up to 50–100 mm wide) parallel to the foliations. These layers are irregularly spaced within the sample, separating wide areas mainly formed by silicates. Graphite is not homo-geneously distributed along the layers, but appears as a dark continuum on the optical microscope. The size of the graphite aggregates, always elongated parallel to the foliation, is variable. When two foliations are evidenced, coarse grained aggregates (up to 200 mm) are associated with the first foliation, whereas finer aggregates occur parallel to the second foliation.
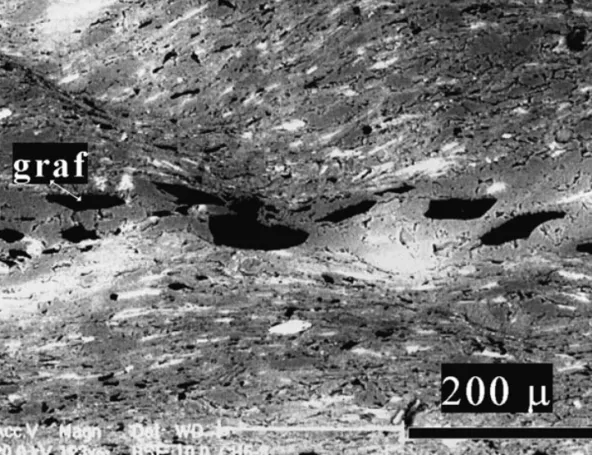
In SOM7 graphite layers are finer and homogeneously distri-buted in the sample; graphite surrounds the silicate crystals, thus producing a continuous film (Fig. 6). We suppose that the high conductivity of SOM7 is due to the finely dissembling distribution of graphite.
The transmission electron microscopy (TEM) provides extremely wide information; in particular we can simultaneously obtain enlarged images of the sample, the corresponding diffraction pattern and the chemical composition, with a spatial and analytical resolution higher than with other conventional instruments. The availability of both chemical and diffraction data from very small C-rich areas allows the rigorous identi-fication of graphite. A TEM microscope (Philips 400T, 120 kV), with a nominal point to point resolution of 4 A˚ was used to carry out the present study. Samples have been prepared by the ion-thinning method, using a Gatan Dual Ion Mill 600. Electron diffraction patterns are referred to areas as small as c. 0.5 mm in diameter (SAED=selected area electron diffraction). An EDAX DX4 energy dispersive spectrometer (EDS), equipped
Table 3. Chemical composition of studied samples. * (FeO+Fe2O3).
SOM7 CH5 wt% ppm SOM7 CH5 H2O 5.75 4.98 Nb 21 11 Na2O 2.73 1.53 Zr 203 275 MgO 0.70 1.33 Y 34 43 Al2O3 23.12 22.03 Sr 334 84 SiO2 58.82 58.60 Rb 126 250 P2O5 0.09 0.05 Ni 18 29 K2O 2.44 5.22 Cr 54 86 CaO 0.17 0.12 V 93 134 TiO2 0.76 1.02 Ba 434 1173 MnO 0.05 0.04 La 62 53 Fe2O3* 5.37 5.07 Ce Pb Co Th U Zn 110 031 017 030 008 083 91 0044 0017 0030 0014 0090
with ultra thin window, also provides chemical data for carbon. Chemical data have been calculated according to the method of Cliff & Lorimer (1975).
Graphite has been clearly identified by TEM; it forms irregular microcrystalline aggregates, whose maximum dimen-sions are approximately 5r2 mm. EDS analyses revealed that only carbon is present in these aggregates. Graphitic aggregates are round-shaped and slightly elongated according to the main foliation. Graphite single crystals are featureless and not clearly evident in images: anyway, crystal size appears to be below 500 A˚ . Electron diffraction patterns of aggregates are ring-shaped (thus indicating a polycrystalline structure), weak and
diffuse. Only a few diffraction rings are present, but the corresponding dhklcan be attributed to graphite. At the TEM
scale, there are no clear differences between SOM7 and CH7 graphitic aggregates. Moreover, we can argue that the low crystallinity of graphite does not strongly influence the sample conductivity.
C O N C L U S I O N S
In a former work, magnetotelluric (MT) and geomagnetic depth soundings (GDS) have revealed the existence of a very high conducting layer below the Penninic Alps of Valais. Outstanding geometrical fit of the conductivity model with seismic lines helped identify the lithology responsible for the enhanced conductivity (Zone Houille`re). This layer crops out at the surface, making it possible to check in the laboratory the reality of this electric conductor. The electrical properties of black shales from the boreholes, measured under simulated physical conditions showed that under all physical conditions the sample from one borehole (SOM7) was very conductive (r<2.0 Vm), despite a close visual resemblance to the much less conductive samples from the second borehole nearby (CH5, r>300 Vm). Moreover, the laboratory results (SOM7) confirmed the field data, but could not suggest an immediate petrophysical interpretation.
The principal explanations for the difference were differences in carbon content and variations in conductive mineral con-nectivity. It was also important to know the phyllosilicate content and to identify the metallic minerals. To these ends chemical and petrographical investigations were performed, using
Figure 6. SEM image of a SOM7 sample. Section parallel to the schistosity. Graphitic areas are denoted by the mention ‘graf’.
both classical (optical microscope) and sophisticated (TEM, SEM). These investigations revealed that the cause of the electrical conductivity was not of chemical origin, but petro-graphical and related to structure layering, the grain size of phyllosilicates, and the presence of a carbon film at the grain boundaries. Grain size and layering are typical of fluvial deposits, leading to stratigraphic heterogeneities such as lenses and channels. Bed continuity is not insured over large distances. Under these circumstances, it is not surprising to find large conductivity variations between neighbouring wells, and even within the same rock core.
A C K N O W L E D G M E N T S
The authors are grateful to Dr J.-P. Gisiger of Electrowatt AG, for providing access to cores from two boreholes. This research was carried out with the support of the Geophysical Commission of the Swiss Academy of Natural Sciences. The authors are grateful to Dr M. Muschietti, for co-operation in acquiring data of sample resistivities and to Dr G. Pratesi for C and crystallite size analyses of the samples.
R E F E R E N C E S
Adam, A. & Bielik, M., 1998. The crustal and upper-mantle geo-physical signature of narrow continental rifts in the Pannonian Basin, Geophys. J. Int., 134, 157–171.
Cliff, G. & Lorimer, G.W., 1975. The quantitative analysis of thin specimens, J. Microscopy, 103, 203–207.
ERCEUGT-Group, 1992. An electrical resistivity crustal section from the Alps to the Baltic Sea (central segment of the EGT, Tectonophysics, 207, 123–139.
Escher, A., Hunziker, J.C., Marthaler, M., Masson, H., Sartori, M. & Steck, A., 1997. Geologic framework and structural evolution of the Western Swiss-Italian Alps, Results of NRP 20; Deep Structure of the Swiss Alps, eds. Pfiffner, O.A., Lehner, P., Heitzman, P., Mueller, P. & Steck, A., pp. 205–221, Birkhaeuser Verlag, Basel.
Frost, B.R., Fyfe, W.S., Tazaki, K. & Chan, T., 1989. Grain Boundary Graphite in Rocks and Implications for High Electrical Conductivity in the Lower Crust, Nature, 340, 134–136.
Glover, P.W.J. & Vine, F.J., 1992. Electrical conductivity of carbon– bearing granulite at raised temperatures and pressures, Nature, 360, 723–726.
Glover, P.W.J. & Vine, F.J., 1994. Electrical conductivity of the continental crust, Geophys. Res. Lett., 21, 2357–2360.
Glover, P.W. & Vine, F.J., 1995. Beyond KTB—Electrical conductivity of the deep continental crust, Surv. Geophys., 16, 5–36.
Jo¨dicke, H., 1992. Water and graphite in the Earth’s crust—An approach to interpretation of conductive models, Surv. Geoph., 13, 381–407.
Jones, A.G., 1992. Electrical conductivity of the continental lower crust. In: Continental Lower Crust, ed. Fountain, D.M., Arculus, A.J. & Kay, R.W., pp. 81–143, Elsevier, Amsterdam.
Korja, T., Tuisku, P., Pernu, T. & Karhu, J., 1996. Field, petro-physical and carbon isotope studies on the Lapland granulite belt; implications for deep continental crust, Terra Nova, 8, 48–58. Lastovickova, M., Losito, G. & Trova, A., 1993. Anisotropy of
electrical conductivity of dry and saturated KTB samples, Phys. Earth planet. Inter., 81, 315–324.
Losito, G., 1989. A new rock physics laboratory apparatus with programmed thermo-baric cycles & controlled pore fluid internal pressure (theory, hardware-software, electrical measurements), CNR-ENEA, PFE SP Energia Geotermica, LB-21,1–150.
Losito, G. & Muschietti, M., 1987. Comportamenti elettrici a bassissime frequenze di campioni mono e bi-mineralogici, Proc. VI Conv. Naz. CNR-GNGTS, Vol. 3, 1349–1359.
Losito, G. & Muschietti, M., 1998. Is the illite group the cause of high electrical conductivity in certain lithospheric areas? Annali Di Geofisica, 41, 369–382.
Losito, G., Muschietti, M. & Trova, A., 1991. Laboratory Electrical Responses of Rock Samples Under Geothermal Temperature-Hydrostatic Pressure Conditions, Geothermics: Pergamon Press, UK, 20, 3, 165–178.
Pfiffner, O.A., Lehner, P., Heitzmann, P., Mueller, S. & Steck, A., 1997, Deep Structure of the Swiss Alps, Results of the NRP 20, Birkha¨user, Basel.
Praus, O., Pecova, J., Petr, V., Babuska, V. & Plomerova, J., 1990. Magnetotelluric and seismological determination of the lithosphere-asthenosphere transition in Central Europe, Phys. Earth planet. Inter., 60, 212–228.
Roberts, J.J., Duba, A.G., Mathez, E.A., Shankland, T.J. & Kinzler, R., 1999. Carbon-enhanced lectrical conductivity during fracture of rocks, J. geophys. Res., 104, 737–747.
Schnegg, P.-A., 1993. An Automatic Scheme for 2-D Magnetotelluric Modelling, Based on Low-Order Polynomial Fitting, J. Geomag. Geoelectr., 45, 1039–1043.
Schnegg, P.-A., 1998. The magnetotelluric survey of the Penninic Alps of Valais, Mate´riaux pour la Ge´ologie la Suisse, Swiss Geophys Commission., 32, ISSN 0253–1186.
Schnegg, P.-A., 1999. A computing method for 3D magneto-telluric modelling directed by polynomials, Earth Planets Space, 51, 1005–1012.
Shankland, T.J., Duba, A.G., Mathez, E.A. & Peach, C.L., 1997. Increase of electrical conductivity with pressure as an indicator of conduction through a solid phase in midcrustal rocks, J. geophys. Res., 102, 14 741–14 750.
Steck, A., et al., 1997. Geologic interpretation of the seismic profiles through western Switzerland, Deep Structure of the Swiss Alps, pp. 123–138, Birkha¨user, Verlag, Basel.