The fake food buffet – a new method in nutrition behaviour research
T. Bucher*, K. van der Horst and M. Siegrist
ETH Zu¨ rich, Institute for Environmental Decisions (IED), Consumer Behaviour, Universita¨tstrasse 22, CHN J 78, CH-8092 Zu¨ rich, Switzerland
(Submitted 28 January 2011 – Final revision received 20 July 2011 – Accepted 20 July 2011 – First published online 16 September 2011)
Abstract
Experimental research in behavioural nutrition is often limited by practical applicability. In the present study, we assess the reproducibility and validity of a new experimental method using food replicas. A total of fifty-seven people were invited on two separate occasions with an interval of 2 weeks to serve themselves a meal from a fake food buffet (FFB) containing replica carrots, beans, pasta and chicken. The external validity of the FFB was assessed in a second study by comparing meals served from replica foods (beans, pasta, chicken) with meals served from a corresponding real food buffet (RFB). For the second study, forty-eight participants were invited on two separate occasions; first to serve themselves a meal from the FFB or an RFB and 2 weeks later from the other buffet. The amounts of food items served and (theoretical) energy content were compared. Correlation coefficients between the amounts of fake foods served were 0·77 (95 % CI 0·68, 0·86) for chicken, 0·79 (95 % CI 0·68, 0·87) for carrots, 0·81 (95 % CI 0·69, 0·89) for beans and 0·89 (95 % CI 0·82, 0·93) for pasta. For the FFB meal and the RFB meal, the correlations ranged between 0·76 (95 % CI 0·73, 0·91) for chicken and 0·87 (95 % CI 0·77, 0·92) for beans. The theoretical energy of the fake meal was 132 kJ (32 kcal) lower compared to the energy of the real meal. Results suggest that the FFB can be a valuable tool for the experimental assessment of relative effects of environmental influences on portion sizes and food choice under well-controlled conditions.
Key words:Fake food buffet: Experimental nutrition research: Food choice: Validity: Reproducibility
A balanced diet is essential to maintain good health and involves eating a variety of foods in healthy proportions(1 – 3). A diet rich in fruit and vegetables has been shown to reduce the risk of cancer(4) and CVD(5), improve bone health(6,7)
and reduce age-related cognitive decline(8), while eating an unbalanced diet can cause weight gain and lead to poor health(9,10). To improve general nutrition, it is important to understand how people compose meals and whether they are able to practically implement current dietary rec-ommendations such as the food pyramid(11).
Most people seem to be aware that a healthy diet requires more than consuming vitamins and minerals(12). People are able to estimate the amount of energy in a meal to a certain extent, but they tend to underestimate the energy content as the meal size increases(13). Having this knowledge, however, does not suggest that it helps people to make healthy diet choices or that people are able to use this knowledge when composing meals. To make healthy food choices, people should be able to create a balanced meal that consists of enough vegetables, starchy foods and reasonable amounts of meat.
Food choice is influenced not only by explicit decisions. Research has shown that environmental factors play a major role when choosing food. It has been shown that the variety of food presented(14), portion sizes(15), the plate size or even the number of peers at the table can influence consump-tion(16). Changes in the food environment, such as increasing the availability of healthy foods, are therefore potential measures for influencing consumers’ food selection towards better nutrition, without affecting the consumers’ freedom of choice.
Investigation of consumers’ abilities to compose balanced meals and investigating environmental influences on food choice are methodological challenges. Methods currently applied in the field of nutrition research range from detailed individual weight records over several days to FFQ, household survey methods and simple food lists(17,18). The
appropriate-ness of a tool depends on the purpose for which the tool is intended. Each method has its merits, associated errors and practical difficulties. Very few methods enable the investigation of procedural nutritional knowledge, which is defined as knowledge of the way in which actions are performed(12,19).
* Corresponding author: T. Bucher, fax þ 41 44 632 10 29, email [email protected] Abbreviations: FFB, fake food buffet; RFB, real food buffet.
qThe Authors 2011
British
Journal
of
Experimental methods assessing consumers’ nutritional abil-ities and influences on food choice are often limited by very practical issues such as high costs, limited availability of suitable infrastructure, the effort of preparing food and its subsequent waste and spoilage. Elaborate experiments investigating food choice were sometimes conducted in cafeteria-like settings(20,21) or even in specialised
infrast-ructures such as artificial kitchens or restaurants(22). In those settings, however, participants have usually been tested in big groups(20,23). Group testing has the disadvantage that participants may influence each other during experiments. It is, for example, known that more food is consumed when more people sit at a table(24,25) or when people are more
distracted(16). Individual testing of participants and standardis-ation of the environmental influences are desirable, when studying people’s ability to compose healthy meals. Each participant should find the same selection of food, which should look similarly appealing at all times. However, individ-ual testing and keeping the environment constant are two different requirements related to high methodological effort with respect to food preparation and cost.
In this study, we present the fake food buffet (FFB) as a new method for experimental nutrition research. Among various other applications, the FFB allows for assessing influences on food choice and consumers’ practical nutritional knowl-edge under well-controlled conditions. The FFB is a buffet of replica food items, from which consumers are invited to choose. Food replicas, such as the Nasco food models (Nasco International, Inc., Fort Atkinson, WI, USA), have been used in nutrition research as measurement aids for por-tion size(26 – 29). Canada was one of the first countries to use a collection of three-dimensional food models in the National Nutrition Survey(30). The validity of these food models, how-ever, remains questionable(31 – 34), and more research assessing
the accuracy of portion size measurement aids in controlled testing environments is required(35). To the best of our knowl-edge, replica foods have not yet been validated for exper-imental nutrition research. This is the first study to assess the validity and reproducibility of food replicas in a buffet setting, where consumers compose a meal from replica food items. The reproducibility of the FFB method was assessed in a test – retest reliability study (Study 1), where participants served themselves two meals from the FFB within a 2-week period. The validity was assessed in a second study (Study 2) by comparing meals served from an FFB with meals served from a corresponding real food buffet (RFB).
Experimental methods Subjects
Subjects were recruited via the subject pool of the University of Zu¨rich (mainly students and staff). Persons following a medically prescribed diet, vegetarians and people who had previously participated in food studies were excluded from the present study.
A total of fifty-nine persons were recruited for the reprodu-cibility study (Study 1). Data from fifty-seven participants
(twenty-nine males and twenty-eight females) were analysed. Two persons were excluded, as they failed to participate in the retest. A total of fifty-one participants were recruited for the validity study (Study 2). Data from forty-eight subjects (twenty males and twenty-eight females) were analysed. Three people were excluded: two for non-participation and one for not completing the questionnaire.
Both studies were conducted according to the guidelines laid down in the Declaration of Helsinki. Written informed consent was obtained from all subjects. Participants received monetary compensation for participation. All participants were informed about the study’s aim subsequent to study completion.
Reproducibility study protocol (Study 1)
Participants were invited twice, with a 2-week interval between occasions, to serve lunch from the FFB, containing the following replica food items: cooked carrots, cooked green garden beans, pasta and fried chicken breast pieces (see Fig. S1, supplemen-tary material for this article, http://www.journals.cambridge. org/bjn, for illustration of the FFB used in the reproducibility study). Each person was tested individually. Upon entering the experimental room, the participant was provided with a standard serving plate (27 cm diameter) and instructed to serve himself/herself a meal, such as he/she would normally eat for lunch, from the presented selection. After serving himself/herself, the participant filled out a questionnaire asses-sing hunger and recent food intake. Meanwhile, the investigator quantified each food component of the meal by weighing it (Shimadzu UW6200H; Swiss Waagen DC GmbH Uster, Switzerland). Two weeks later at the same time of day (^ 1 h), the participant was again invited to select a meal, as he/she would normally eat for lunch, from the same FFB selection. After serving himself/herself, the participant filled out a questionnaire assessing hunger, recent food intake and anthropometric data. Participants were also asked to rate the authenticity of the replica foods.
Validity study protocol (Study 2)
Students were invited to participate in a food study twice, with a 2-week interval between sessions. All subjects were tested individually. During the first session, the participant was pre-sented with either an FFB or an RFB (random assignment) containing replica beans, pasta and chicken or the respective real food items (see Fig. S2, supplementary material for this article, http://www.journals.cambridge.org/bjn, for an illustra-tive comparison of replica and real foods). The participant was instructed to serve himself/herself a meal, such as he or she would normally serve for lunch, from the presented buffet (randomly assigned FFB or RFB). Fourteen days later, at the same time of day, the participant was instructed to serve himself/herself a meal from the other buffet; so participants who served themselves first from the FFB would serve them-selves from the RFB in the second session and vice versa. Each food component of the replica and the real meal was quantified by weighing it.
British
Journal
of
Calculation of energy contents
The values that were used for the energy (kJ) calculations are summarised in Table S1 of the supplementary material for this article (http://www.journals.cambridge.org/bjn). All energy estimates are based on the values for the corresponding raw food items found in the Swissfir database(36).
Cooked real food items
To estimate the energy content of the cooked foods, the beans, pasta and chicken were weighed before and after cooking. The energy content of the cooked food was calcu-lated from the value for the raw product by correcting for the mass change due to processing (cooking/frying).
Beans. Approximately 100 g of green garden beans were chopped into pieces comparable to the replica beans and cooked for 20 min. The exact weight of the beans was measured before and after cooking and chilling. Cooked beans (100 g) are estimated to correspond to 103 kJ (raw beans (100 g) ¼ 103 kJ(36)).
Pasta. A type of pasta was selected that looked similar to the replica pasta in size and shape after cooking. Pasta (90 g) was cooked for approximately 10 – 12 min, and the weight was measured before and after cooking and chilling. Cooked pasta (100 g) is estimated to contain 668 kJ (uncooked egg pasta (100 g) ¼ 1498 kJ(36)).
Chicken. Chicken breast was flavoured and subsequently fried in a pan. The weight of the raw and fried meat was measured as well as the frying oil remaining on the chicken. The frying oil was taken into account to calculate the
energy content of the fried chicken breast. Fried chicken (100 g) is estimated to contain 648 kJ (raw chicken breast (100 g) ¼ 456 kJ(36)).
Fake food items
To estimate the theoretical energy content of the replica foods, corresponding real foods were prepared, and the weights were measured. This procedure was repeated three times for each food item to calculate an average conversion factor.
Replica carrots. Raw carrots were chopped into pieces comparable to the replica carrots. Fifty pieces of replica car-rots and fifty pieces of real carcar-rots were selected randomly. The weight of the real and replica carrots was measured. Fake carrots (100 g) were estimated to correspond to a theor-etical energy value of 149 kJ (raw carrots (100 g) ¼ 135 kJ(36)). Replica beans. Green garden beans were chopped into pieces comparable to the replica beans. A total of forty replica beans and forty real beans were selected randomly. The weight of the real and replica beans was measured. Replica beans (100 g) have a theoretical energy content of 75 kJ.
Replica pasta. A type of pasta was selected that looked simi-lar in size and shape after cooking to the replica pasta. Forty pieces of real pasta and forty pieces of replica pasta were selected randomly. The weight of the real and replica pasta was measured. Replica pasta (100 g) corresponds to 455 kJ.
Replica chicken. Chicken breast was flavoured and sub-sequently fried in a pan. The weight of the raw and fried chicken was measured as well as the frying oil remaining on the chicken. The chicken breasts were then chopped into pieces similar to the replica food. A total of six similarly shaped pieces of real and replica chicken were selected and measured. The procedure was repeated three times. Replica chicken (100 g) corresponds to 636 kJ. Note that for chicken, the oil remaining on the meat after frying was taken into account, while for all other food items, no addition of fat was assumed.
Measures
The outcome variable, energy fake meal, was established by weighing all served replica food items, multiplying the
Table 1. Descriptive characteristics of reproducibility study subjects (Mean values and standard deviations, n 57)
Men (n 29) Women (n 28) Total (n 57)
Mean SD Mean SD Mean SD
Age (years) 25·2 4·1 24·4 3·8 24·8 3·9
Weight (kg) 76·2 12·3 58·4 8·5 67·4 13·8
Height (m) 180·8 6·0 166·8 5·7 173·9 9·1
BMI (kg/m2) 23·4 4·2 20·9 2·1 22·2 3·6
Table 2. Reproducibility of the fake food buffet†
(Mean values and standard deviations, n 57 (twenty-nine male/twenty-eight female) subjects) Replica food
served in T1 (kJ)
Replica food served in T2 (kJ)
Paired sample t test food served in T1 and T2 Correlation food served in T1 and T2 Mean SD Mean SD t d r Carrots 71 34 68 36 1·14NS 0·10 0·79* Beans 48 26 50 32 20·92NS 20·08 0·81* Pasta 644 256 611 280 1·95NS 0·12 0·89* Chicken‡ 596 239 610 273 20·60NS,‡ 20·05 0·77*‡
Total energy fake meal 1359 446 1338 389 0·67NS 0·06 0·80*
T1, test; T2, retest. * P, 0·001.
† Mean energy fake food served in 14-d T1 – T2 study.
‡ Data are non-normal. Therefore, z value of Wilcoxon signed-rank test and Spearman’s correlation coefficient are reported.
British
Journal
of
weight of the individual food items by the corresponding factor and calculating the total energy in kJ. Similarly, the out-come variable, energy real meal, was determined by weighing all real food items and calculating the total energy content of the meal. The mean energy of the fake meal is the mean energy of the fake meals served in the test and retest study. Participants provided self-reported height, weight and age measurements. These measurements were used to calculate the BMI (weight in kg divided by height in m2
) and the individual’s personal energy need per d (weight multiplied by energy per kg body weight factor, which depends on age and sex(37)). The students completed questions about their levels of hunger, recentness of food intake and the auth-enticity of the replica foods. Hunger was assessed with the question, ‘How hungry are you right now?’ on a 6-point scale (1 ¼ not hungry at all; 6 ¼ very hungry). The authen-ticity of the replica foods was measured with the question, ‘How realistic were the following replica foods?’ on another 6-point scale (1 ¼ not realistic at all; 6 ¼ very realistic). The recentness of the food intake was assessed by asking for the time of the last food intake (any energy-containing) as well as the time of the last meal intake.
Statistical analysis
Statistical analysis was performed using Predictive Analytics SoftWare Statistics, version 18.0 (SPSS, Inc., Chicago, IL, USA). For normal data, mean differences were assessed with the paired-sample t test, and Pearson correlation coefficients were reported. For non-normal data, mean differences were assessed with the Wilcoxon signed-rank test, and Spearman’s correlation coefficients were reported. All tests are based on a 0·05 significance level. For the t tests, the test values t and Cohen’s d are reported. The examine SPSS procedure was
used to detect outliers or extreme values (values more than 1·5 or 3 interquartile ranges, respectively). Analysis with and without outliers provided virtually identical results. Therefore, only results of the complete sample are reported.
Results
Reproducibility of the fake food buffet (Study 1)
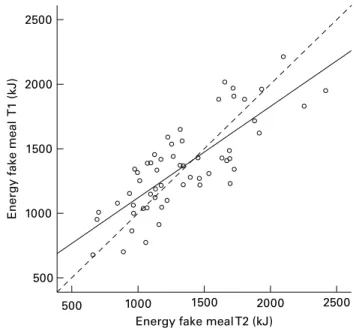
To measure the reproducibility of the FFB method, 2-week test – retest reliability data of fifty-seven students (twenty-nine males and twenty-eight females) were analysed. Descriptive characteristics of the study population can be found in Table 1. The mean amounts (kJ) of individual replica foods served in the test-and-retest study did not differ significantly (see Table 2). The correlation coefficients ranged from 0·77 for replica chicken to 0·89 for the amount of replica pasta. Furthermore, the theoretical energy of the fake meal served in the test-and-retest study was highly correlated, indicating the good overall reproducibility of the method (r 0·80, P¼ 0·000). A bivariate plot of the total energy (kJ) of the fake meal measured in the test and retest is shown in Fig. 1. Bivariate plots of the energy (kJ) of individual replica food items measured in the test and retest may be found in Fig. S3 of the supplementary material for this article (http://www.journals.cambridge.org/bjn).
High overall ratings for the authenticity of the replica food items give an indication of the usefulness of replica foods (carrots (4·79 (SD 1·15)); beans (4·84 (SD 1·05)); pasta (4·86
(SD1·04)); chicken (3·61 (SD1·42)); all foods in general (4·81 (SD0·83))).
Men (1574 (SD325) kJ) served themselves significantly more energy (mean energy test and retest) compared to women (1143 (SD 237) kJ; t(55) ¼ 5·33, P¼ 0·000). The personal
energy need of the study subjects was significantly related to the mean energy of the fake meal served in the test and retest (r 0·53, P¼ 0·000, n 57), indicating a natural behaviour. Note that height and weight are self-reported, and therefore, the calculated personal energy needs might be lower than the actual energy needs(38). Hunger was not related to the amount of energy served in either the test (r 0·22, P¼ 0·106, n 57) or the retest (r 0·18, P¼ 0·188, n 57). In addition, the amount of time since the last food intake was not significantly related to the amount of energy served (test: r 0·23, P¼ 0·083, retest: r 0·12, P¼ 0·376). 2500 2000 1500 1000 1000 1500 2000 2500
Energy fake meal T2 (kJ) 500
500
Energy fak
e meal
T1 (kJ)
Fig. 1. Reproducibility of the fake food buffet (FFB): bivariate plot of energy served from the FFB in the test (T1) and retest study (T2). , Linear regression R20·63; , energy T1 ¼ energy T2.
Table 3. Descriptive characteristics of validity study subjects (Mean values and standard deviations, n 48)
Men (n 20) Women (n 28) Total (n 48)
Mean SD Mean SD Mean SD
Age (years) 23·3 3·1 22·7 2·8 23·1 2·9 Weight (kg) 76·2 8·5 58·5 6·4 65·9 11·4 Height (m) 179·8 5·6 168·0 6·3 172·9 8·4 BMI (kg/m2) 23·6 2·2 20·7 1·6 21·9 2·3
British
Journal
of
Nutrition
Validity of the fake food buffet (Study 2)
For the validity study, forty-eight persons (twenty males and twenty-eight females) were recruited over a 2-week period. Descriptive characteristics of the study population can be found in Table 3. Participants were instructed to first serve a meal from the FFB or RFB and 2 weeks later from the other buffet. The meals served from the FFB were compared to meals served from the RFB (within-subject comparison). The results are summarised in Table 4. Correlations between served amounts of fake and real foods were high and ranged from rs 0·76 (chicken) to r 0·87 (beans). The
corre-lation of the total energy served from the RFB and the FFB is high (r 0·76). The theoretical energy of the fake meal was 132 kJ lower compared to the energy of the real meal. For the individual food items, we found a significant difference between the energy from the fake and real beans (t ¼ 4·44, P¼ 0·00, d ¼ 0·51) as well as the fake and real pasta (t ¼ 5·79, P¼ 0·00, d ¼ 0·61). The energy from the chicken did not differ between the real and fake food (t ¼ 0·13, P¼ 0·90, d ¼ 0·20). Overall, participants served themselves slightly more energy (mean difference ¼ 132 kJ) from the RFB than from the FFB.
We found that if pasta is cooked for 12 instead of 8 min, the weight of the pasta increased by 20 %, which in turn led to an energy reduction of 15 %/100 g. When the foods cool down, they again lose humidity and decrease in volume.
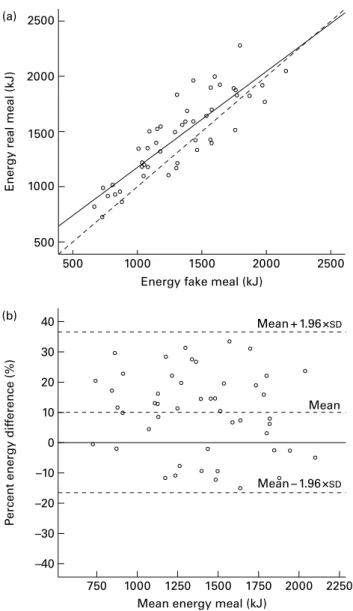
A bivariate plot of the total energy of the fake meal and energy of the real meal is shown in Fig. 2(a). Bivariate plots of the amounts of individual fake and real food items may be found in Fig. S4 of the supplementary material for this article (http://www.journals.cambridge.org/bjn). The agreement of the FFB and the RFB was assessed with the Bland – Altman method(39). The percentage energy differences between the meals served from the FFB and the RFB were plotted against the mean energy of those two meals. The Bland – Altman plot shows that there was no systematic variation between the amounts of food served from an FFB or an RFB (Fig. 2(b)). There is, however, a slight bias to serve more energy from the RFB compared to the FFB. Bland – Altman plots of individ-ual food items (Fig. S5, supplementary material for this article, http://www.journals.cambridge.org/bjn) as well as a sample
Table 4. Validity of the fake food buffet (FFB) method
(Mean values and standard deviations served from fake food buffet and real food buffet, n 48 (twenty male/twenty-eight female))
Replica food served (kJ)
Real food served (kJ)
Correlation food served from FFB and RFB
Mean SD Mean SD r
Beans 78 35 92 43 0·87*
Pasta 660 223 781 252 0·82*
Chicken† 587 250 584 224 0·76*,†
Total energy meal 1325 369 1457 373 0·86*
RFB, real food buffet. * P, 0·001.
† Data are non-normal. Therefore, the Spearman’s correlation coefficient is reported.
2500 (a) (b) 2000 1500 1000 1000 1500 2000 2500
Energy fake meal (kJ) 500 40 30 20 10 –10 –20 –30 –40 750 1000 1250 1500 1750 2000
Mean energy meal (kJ)
2250 Mean – 1.96 ×SD Mean + 1.96 ×SD Mean 0 500
Energy real meal (kJ)
P
ercent energy dif
ference (%)
Fig. 2. Agreement of energy served from replica foods and real foods between the fake food buffet (FFB) and a corresponding real food buffet (RFB)(39). (a) Bivariate plot of energy served from FFB (kJ) and RFB
(kJ). , Linear regression r20·74; , energy FFB ¼ energy RFB. (b) Bland–Altman plot of percentage energy ((RFB 2 FFB)/(RFB þ FFB) £ 100) difference of the meals served from RFB and FFB against mean energy ((FFB þ RFB)/2) served from both FFB and RFB. Mean relative differ-ence and the 95 % boundaries of true significance (mean ^ 1·96SD).
British
Journal
of
picture of a plate served by participant number 33 (Fig. S6, supplementary material for this article, http://www.journals. cambridge.org/bjn) may be found in the supplementary material.
Conclusion
Environmental influences on food choice are an important area of investigation, as changes in the food environment are potential measures to subconsciously influence consumers into selecting more nutritious foods(39). To examine the influence on food behaviour and consumers’ practical skills, experimental studies are needed. Controlling environmental influences is essential in such experiments. However, current methods to study food choice and meal composition are lim-ited by practical problems, such as the effort of food handling and individual testing under a constant or experimentally manipulated environment. In this study, we present the FFB, an innovative method in nutrition research. The results in this study show that the FFB method is reproducible, as high correlations were found for test – retest reliability. Further, we found that women serve less energy from fake foods com-pared to men. The energy served correlates with the actual personal energy requirement. Furthermore, students rated the appearance of the replica food items as very realistic. Altogether, these findings indicate that participants behaved naturally when serving the replica food (face validity). The participants chose a meal related to their energy need rather than momentary feelings of hunger or recentness of food intake. This indicates that participants indeed followed the instruction to serve a meal similar to one they would normally eat for lunch, rather than just serving a meal they would have chosen at that moment.
The amounts of food served from the FFB were highly cor-related to the amounts of food served from a corresponding RFB. Absolute amounts of energy are somewhat lower for fake beans and pasta, compared to real beans and pasta. The theoretical energy of the fake meal was 132 kJ (32 kcal) lower compared to the energy of the real meal. This difference is significant, but rather small when compared to the potential changes in the energy content of the real food due to proces-sing (cooking). When fake foods are used in experimental designs, the small underestimation of energy served from fake foods will be present in all experimental groups, and is therefore not very likely to affect results, as relative energy differences are of interest. Whether absolute amounts of energy served from the FFB are valid remains a subject of further investigation. Real foods are susceptible to compo-sitional changes such as water and energy content and to changes in pleasantness to the consumer. Fake foods on the other hand are stable over time, enabling food experiments without the variability due to processing of foods.
Limitations
Although of outstanding quality, the replica foods were fake. An important limitation of using replica foods is that served theoretical energy may not be identical to consumed energy.
Even though it is known from previous research that people tend to empty their plates(16) and take single portions as
units for consumption, rather than compensating by eating more portions(40), parts of meals might be left over or a second serving eaten. Also, fake foods have certain limitations when it comes to liquids such as sauces or dressings. An FFB will never represent a complete choice but will always be a selection. An important limitation of the FFB was found in the validity study (Study 2), as there appears to be a tendency of people to serve themselves slightly more energy from real foods compared to fake foods. Therefore, even though the method seems suitable to assess relative differences in serving sizes, it may be less suitable to measure absolute amounts of energy served. The comparability in terms of energy depends on the similarity of the individual food replicas to the corre-sponding real food, as well as the accuracy of theoretical energy estimated for replica food items. Other limitations are that the study was conducted with only a small range of food items, and the participants of this study were mainly students.
Practical implications
Food replicas have numerous advantages over real food in experimental nutrition research. Fake foods do not spoil and do not require preparation. For FFB experiments, there is no need for specialised infrastructure, such as a kitchen. FFB experiments can be conducted in a normal experimental room, where temperature, light, noise level or other factors might be kept constant or varied systematically. The fake foods can be used repeatedly, which makes the method inex-pensive besides helping avoid food wastage. The FFB method allows for the study of practical nutritional knowledge and environmental influences on food choice under well-con-trolled laboratory conditions. Experiments to investigate the comprehensibility of dietary guidelines such as the food pyra-mid require minimal effort. Furthermore, interesting FFB studies could be carried out to assess the dietary behaviour and nutritional knowledge of children. In young children, issues such as literacy, writing skills or limited food recog-nition skills from pictures might be overcome by using fake foods. The FFB also facilitates studying environmental influences such as ambience, plate size or the serving order on consumers’ meal composition.
In a recent study, we used fake foods to investigate the effect of vegetable variety on meal composition(41). To our knowledge, this is the only study that has used fake foods for experimental nutrition research. We found that consumers chose a higher percentage of energy from vegetables if they are offered two instead of only one vegetable in a buffet set-ting. The overall energy of the served meal, however, did not increase, indicating that participants chose a more balanced meal when offered a higher variety of vegetables. The reliability and validity studies together with the earlier-men-tioned study on variety show that the FFB is a practical and appropriate method for investigating environmental influ-ences. We suggest application of the FFB for experimental assessment of relative effects on portion sizes and food
British
Journal
of
choice, but it remains unclear whether it can be used for quantification of absolute amounts of energy.
Acknowledgements
The studies reported in the present paper received no specific grant from any funding agency in the public, commercial or not-for-profit sectors. The authors had no conflicts of interest in writing this paper. T. B., K. v. d. H. and M. S. jointly designed the study. T. B. performed data acquisition, data analysis and led the writing. K. v. d. H. and M. S. provided critical feedback on drafts of the article.
References
1. US Department of Agriculture (1992) Food guide pyramid. A guide to daily food choices. In The USDA Home and Garden Bulletin no. 252 [US Department of Health and Human Services, editor]. Hyattsville, MD: US Department of Agriculture.
2. Derrickson JP, Sakai M & Anderson J (2001) Interpretations of the ‘balanced meal’ household food security indicator. J Nutr Educ 33, 155 – 160.
3. Bundeasmt fu¨r Gesundheit BAG (2010) Empfehlungen fu¨r eine ausgewogene Erna¨hrung (Recommendations for a Balanced Diet). http://www.bag.admin.ch/themen/ ernaehrung_bewegung/05207/05209/index.html?lang¼de 4. World Cancer Research Fund, American Institute for Cancer
Research (2007) Food, Nutrition, Physical Activity, and the Prevention of Cancer: A Global Perspective. Washington, DC: World Cancer Research Fund and American Institute for Cancer Research.
5. Bazzano LA, He J, Ogden LG, et al. (2002) Fruit and veg-etable intake and risk of cardiovascular disease in US adults: the first National Health and Nutrition Examination Survey Epidemiologic Follow-up Study. Am J Clin Nutr 76, 93 – 99.
6. Prynne CJ, Mishra GD, O’Connell MA, et al. (2006) Fruit and vegetable intakes and bone mineral status: a cross sectional study in 5 age and sex cohorts. Am J Clin Nutr 83, 1420 – 1428.
7. Tucker KL, Hannan MT, Chen H, et al. (1999) Potassium, magnesium, and fruit and vegetable intakes are associated with greater bone mineral density in elderly men and women. Am J Clin Nutr 69, 727 – 736.
8. Morris MC, Evans DA, Tangney CC, et al. (2006) Associations of vegetable and fruit consumption with age-related cogni-tive change. Neurology 67, 1370 – 1376.
9. Melhorn SJ, Krause EG, Scott KA, et al. (2010) Acute exposure to a high-fat diet alters meal patterns and body composition. Physiol Behav 99, 33 – 39.
10. Grundy SM (2000) Metabolic complications of obesity. Endocrine 13, 155 – 165.
11. Schweizerische Gesellschaft fu¨r Erna¨hrung (Swiss Nutrition Society) (2010) Die 3D-Pyramide: Die dreidimensionale Pyramide fu¨r Beratung und Ausbildung (The 3D-Pyramid: The three-dimensional pyramid for guidance and training). http://www.sge-ssn.ch/ernaehrungsinfos/gesundes-essen-und-trinken/die-3d-pyramide.html
12. Dickson-Spillmann M & Siegrist M (2011) Consumer’s knowl-edge of healthy diets and its correlation with dietary beha-vior. J Hum Nutr Diet 24, 54 – 60.
13. Wansink B & Chandon P (2006) Meal size, not body size, explains errors in estimating the calorie content of meals. Ann Intern Med 145, 326 – 332.
14. Remick AK, Polivy J & Pliner P (2009) Internal and external moderators of the effect of variety on food intake. Psychol Bull 135, 434 – 451.
15. Rolls BJ, Morris EL & Roe LS (2002) Portion size of food affects energy intake in normal-weight and overweight men and women. Am J Clin Nutr 76, 1207 – 1213.
16. Wansink B (2004) Environmental factors that increase the food intake and consumption volume of unknowing consumers. Annu Rev Nutr 24, 455 – 479.
17. Thompson FE & Subar AF (2008) Dietary assessment meth-odology. In Nutrition in the Prevention and Treatment of Disease, 2nd ed., pp. 1 – 37 [A Coulston and C Boushey, edi-tors]. San Diego: Academic Press.
18. Wrieden W, Peace H, Armstrong J, et al. (2003) A Short Review of Dietary Assessment Methods Used in National and Scottish Research Studies. Dundee: Centre for Public Health Nutrition Research, Department of Medicine, Univer-sity of Dundee.
19. Anderson JR (2010) Cognitive Psychology and its Impli-cations, 7th ed. New York, NY: Worth.
20. Cinciripini PM (1984) Changing food selections in a public cafeteria – an applied behavior analysis. Behav Modif 8, 520 – 539.
21. French SA, Hannan PJ, Harnack LJ, et al. (2010) Pricing and availability intervention in vending machines at four bus garages. J Occup Environ Med 52, Suppl. 1, S29 – S33. 22. Wansink B (2007) Mindless Eating: Why We Eat More Than
We Think. New York, NY: Bantam.
23. Wansink B & Payne CR (2007) Counting bones: environ-mental cues that decrease food intake. Percept Motor Skill 104, 273 – 276.
24. Decastro JM (1994) Family and friends produce greater social facilitation of food-intake than other companions. Physiol Behav 56, 445 – 455.
25. Hetherington MM, Anderson AS, Norton GN, et al. (2006) Situational effects on meal intake: a comparison of eating alone and eating with others. Physiol Behav 88, 498 – 505. 26. US Department of Agriculture (1998) ARS. Food and Nutrient
Intakes by Individuals in the United States by Sex and Age, 1994 – 96. USDA Nationwide Food Surveys Report no. 96 – 2. Washington, DC: USDA.
27. Ministry of Health (1997) Food Comes First: Methodologies for the National Nutrition Survey of New Zealand. Wellington: Ministry of Health.
28. Anonoymous (1994) Plan and Operation of the Third National Health and Nutrition Examination Survey, 1988 – 94. Vital Health and Statistics, Series 1, Programs and collection procedures; no. 32. Hyattsville, MD: United States Department of Health and Human Services.
29. Parnell W, Scragg R, Wilson N, et al. (2003) NZ Food NZ Children: Key Results of the 2002 National Children’s Nutrition Survey. Wellington: Ministry of Health.
30. Health and Welfare Canada (1973) Nutrition Canada National Survey. Ottawa: Information Canada.
31. Cypel YS, Guenther PM & Petot GJ (1997) Validity of portion-size measurement aids: a review. J Am Diet Assoc 97, 289 – 292. 32. Foster E, Adamson AJ & Anderson AS (2009) Estimation of portion size in children’s dietary assessment: lessons learnt. Eur J Clin Nutr 63, Suppl. 1, S45 – S49.
33. Steyn NP, Senekal M, Norris SA, et al. (2006) How well do adolescents determine portion sizes of foods and beverages? Asia Pac J Clin Nutr 15, 35 – 42.
British
Journal
of
34. Kirkcaldy-Hargreaves M, Lynch GW & Santor C (1980) Assessment of the validity of four food models. J Canadian Diet Assoc 41, 102 – 110.
35. Gibson RS (2005) Principles of Nutritional Assessment, 2nd ed. New York. NY: Oxford University Press.
36. ETH (2010) Database ETH Zu¨rich. SwissFIR. Paolo Colom-bani. http://nwdb.ethz.ch:8080/nwdb/request?xml¼Message Data&xml¼MetaData&xsl¼SearchField&lan¼de&page Key¼ Start
37. Deutsche Gesellschaft fu¨r Erna¨hrung (German Nutri-tion Society) (2001) Referenzwerte fu¨r die Na¨hrstoffzufuhr. 2. korr, Nachdr. ed. (Reference Values for Nutrient
Intake. 2nd ed., reprint). Frankfurt am Main: Umschau/ Braus.
38. Perez-Cueto FJA & Verbeke W (2009) Reliability and validity of self-reported weight and height in Belgium. Nutr Hosp 24, 366 – 367.
39. Wansink B (2010) From mindless eating to mindlessly eating better. Physiol Behav 100, 454 – 463.
40. Geier AB, Rozin P & Doros G (2006) Unit bias – a new heur-istic that helps explain the effect of portion size on food intake. Psychol Sci 17, 521 – 525.
41. Bucher T, Van der Horst K & Siegrist M (2011) Improve-ment of meal composition by vegetable variety. Public Health Nutr 14, 1357 – 1363.