Christian Lanvermann*, Sergio J. Sanabria, David Mannes and Peter Niemz
Combination of neutron imaging (NI) and digital
image correlation (DIC) to determine intra-ring
moisture variation in Norway spruce
Abstract: The hygroscopic behavior of wood has a strong
influence on its mechanical performance, yet the moisture
gradients within the growth ring structure have not been
sufficiently investigated. The main challenge is that
mois-ture variations are coupled with strong sample
deforma-tion, which complicates the spatial referencing of moist
and dry states. In this work, neutron imaging (NI) for the
detection of water and digital image correlation (DIC)
for the detection of local deformation were combined to
calculate the local gravimetric moisture content (MC
grav)
and the volumetric moisture content (MC
vol) within single
growth rings. Specimens of Norway spruce [Picea abies
(L.) Karst.] were exposed to an adsorption-desorption
cycle, with relative humidity (RH) steps varying from 0%
(oven dry) up to 95% RH. After each acclimatization step,
neutron transmission and DIC images were acquired. The
local deformations determined by DIC were used to assign
the corresponding dry density in the undeformed state to
the compartment in a moist state and thus to calculate
its MC by NI. No significant MC gradients could be found
between earlywood (EW) and latewood (LW) within ± 0.5%
accuracy. However, strong density gradients between EW
and LW can be directly correlated with MC
vol. It appears
that the MC in the cell wall is constant regardless of the
particular growth ring position.
Keywords: digital image correlation (DIC),
gravimet-ric and volumetgravimet-ric moisture content (MC), growth rings,
hygroscopic region, neutron imaging (NI), Norway spruce
*Corresponding author: Christian Lanvermann, ETH Zurich, Institute for Building Materials, Woodphysics, Schafmattstrasse 6, 8093 Zurich, Switzerland, e-mail: [email protected]
Sergio J. Sanabria and Peter Niemz: ETH Zurich, Institute for Building Materials, Woodphysics, Schafmattstrasse 6, 8093 Zurich, Switzerland
David Mannes: Paul Scherrer Institut, 5232 Villigen, Switzerland
Introduction
The hygroscopic behavior of wood has been studied
since a long time on the microscopic and macroscopic
scales. A characteristic variable is the gravimetric
mois-ture content (MC
grav), defined as the mass of water per dry
wood mass. Changes in MC are accompanied with
swell-ing and shrinkage stresses, which are highly relevant for
the application of wood as construction material, because
the stresses can induce cracks that decrease the service
life of wooden structural members (Niemz 1993).
Varia-tions in the magnitude and relation of the swelling
coef-ficients have been observed with respect to tree species,
wood density, cellulose microfibril angle, presence of
reaction wood, distance from pith, and growth ring width
(Kollmann and Côté 1968; May 1978; Quirk 1984; Skaar
1988; Bengtsson 2001; Badel and Perré 2002; Donaldson
2008). However, these studies have been generally
con-ducted on macroscopic wood samples, thus neglecting
the variability on the growth ring scale. For softwoods,
several studies identified strong gradients between
early-wood (EW) and lateearly-wood (LW) with respect to cell
geom-etry, swelling, shrinkage, elastomechanical properties,
and density (Harris and Meylan 1965; Fengel and Stoll
1973; Eder et al. 2009; Taguchi et al. 2011).
High-resolu-tion techniques (0.5–1 μm voxel size), such as
micro-com-puter tomography, offer insight in the 3D response toward
moisture changes (Trtik et al. 2007; Mannes et al. 2010;
Derome et al. 2011) but are restricted to a few cell layers
being simultaneously imaged. Derome et al. (2011) found
pronounced anisotropic swelling and shrinkage for the
low-density EW, with lowest strain in the radial direction,
whereas the high-density LW showed an almost isotropic
behavior. Digital image correlation (DIC) allows
observ-ing the local surface deformation, not only of a few cells
but also of larger areas, with recent developments in
user-friendliness and accuracy (Valla et al. 2010; Hansmann
et al. 2011). Recent investigations confirmed a pronounced
correlation between wood density and moisture-induced
radial deformation (Keunecke et al. 2012).
Only a few studies have addressed the question
whether gradients of MC
gravexist within the annual ring.
Early investigations indicated 0.9% higher MC
gravin LW
than in EW for Scots pine (Pinus sylvestris) (Boutelje
1962) and fir (Abies alba) (Popper and Bariska 1972).
Pang and Herritsch (2005) found a MC
gravincrease
of 0.1% to 0.6% for Radiata pine (Pinus radiata) and
attributed this to an increased content in
hemicellu-loses. Moon et al. (2010) found a MC
gravincrease of 1%
for Loblolly pine (Pinus taeda). However, the
afore-mentioned investigations were carried out on isolated
samples of EW and LW. Recently, Dvinskikh et al. (2011)
and Eitelberger et al. (2011a) measured bound water in
the hygroscopic region along full annual ring profiles
by magnetic resonance imaging (MRI). A direct
propor-tionality was found between cell wall density and local
water concentration, which was interpreted as an even
moisture distribution within the cell wall. MRI does not
require deformation compensation due to the
simul-taneous measurement of local water and dry density
of cell wall polymers from the moist state. The main
drawback is the measurement time, due to the
point-wise testing scheme, which is generally restricted to
single profiles. An alternative nondestructive technique
is neutron imaging (NI). NI was only recently applied
for wood research (Lehmann et al. 2001a; Mannes
et al. 2009a; Lehmann and Mannes 2012). In addition
to its high sensitivity toward some light elements such
as hydrogen, NI allows for full-field imaging of
time-dependent processes with second time resolution while
at the same time providing submillimeter spatial
reso-lution. This makes it suitable for the detection of bound
water during diffusion (Mannes et al. 2009b;
Sondereg-ger et al. 2010) or the radial moisture transport during
drying (Rosner et al. 2012). However, due to the
signifi-cant inhomogeneous deformation in radial and
tangen-tial directions, a specific local position in a moist state
cannot be directly assigned to the same position in the
dry condition (i.e., additional referencing information
is required between moist and dry images).
This problem is addressed here: NI and DIC will be
combined to provide simultaneously data sets on MC
and local deformation. These data sets, referenced to
the dry state of the sample, enable the simultaneous
full-field calculation of the local MC
gravand
deforma-tion. Norway spruce samples were subjected to a full
adsorption and desorption cycles. The MC
grav, MC
vol, and
moisture-induced strain were calculated as a function of
the local growth ring position for each relative humidity
(RH) step.
Climate control device
Climate chamber Dry air Saturated air Air Pump PC PC PC Trigger CCD-camera Neutron radiation CCD-camera rh sensor Scintilator CCD-Detector Glass window Sample Al-foil
Figure 1 Schematic of experimental setup.
Materials and methods
Wood samples
A total of four 40 × 40 × 5 mm3 (R × T × L) samples were cut from a
stem of Norway spruce [Picea abies (L.) Karst.] at 1 m above ground (Lanvermann et al. 2013). Growth rings with low curvature and well aligned with the samples were chosen. This sample size affords a large RT-surface and the equilibrium moisture content (EMC) can be obtained within a short time due to the high diffusion coefficient in the longitudinal direction. The mean growth ring width was 2.81 mm at a mean density of 362 kg m-3.
A random speckle pattern was applied on one of the RT-surfaces as a reference for the strain calculation with DIC. A water-based color was sprayed in two steps (airbrush gun with a nozzle size of 0.2 mm): first, a white background, and second, a fine randomly distributed black foreground. The samples were dried at 103°C and kept in sealed plastic bags and covered with silica gel; the assembly was covered with a second plastic bag to prevent moisture changes before experi-ments at the NI facility.
Experimental setup
Instrument: thermal neutron beamline NEUTRA (Lehmann et al. 2001b) situated at the Paul Scherrer Institut (Villigen, Switzerland). The setup consists of the NI system, the DIC setup, and a climate box with air stream regulation (Figure 1). The neutron radiography method was described by Lehmann et al. (2001a) and Mannes et al. (2009a,b). The imaging detector is a 6LiF:ZnS scintillator (thickness,
100 μm), which converts neutron radiation into visible light, being subsequently reflected by a mirror onto a CCD camera with a resolu-tion of 2048 × 2048 pixel2. The digital pixel size was 154 μm and the
field of view was approximately 315 mm. The exposure time for the images was 22 s.
The DIC images were acquired by a commercial VIC3D System (Correlated Solutions, Columbia, SC, USA). Two CCD cameras were used with a digital pixel size of approximately 70 μm, which were covered with lead sheets to shield the electronics from neutron ra-diation. The setup was illuminated with two cold-light sources (color temperature, 5000 K).
The samples were stored in a climate box that serves two pur-poses: (1) it defines the humidity-controlled volume and (2) it allows for a reproducible sample orientation perpendicular to the neutron beam path. The front of the climate box is equipped with a glass win-dow to allow for optic measurement with DIC. The backside foil of the box and the sample holder are made of aluminum, known to be almost transparent for neutron radiation (Figure 1). The acclimati-zation of the box is achieved by mixing dry and moist air streams (Derome et al. 2011). The samples were stored in the lower part for a minimum of 6 h. The following nominal RH states were consecutively investigated: adsorption (RH): 0% (reference state), 15%, 30%, 45%, 65%, 75%, 90%, and 95%; desorption (RH): 90%, 75%, 65%, 45%, 30%, 15%, and 0%.
After each 6 h conditioning period, the weight of the samples was gravimetrically measured (Mettler-Toledo, Greifensee, Switzer-land; 0.01 g precision). The samples were then positioned in a slotted aluminum profile, and the NI radiographies and DIC optic images were acquired. This procedure was repeated for all RH states and samples.
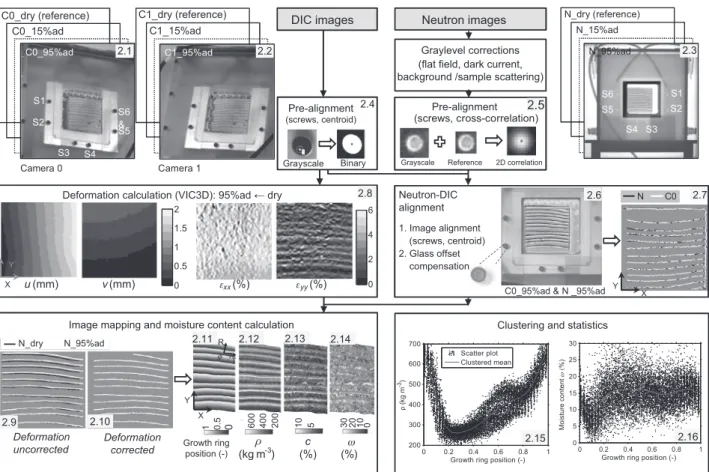
Deformation compensation (Figure 2)
First, the grayscale values of the raw NIs were corrected by stand-ard procedures for inhomogeneities in the detector and neutron beam, background, and sample scattering (Mannes et al. 2009a). The commercial correlation software (VIC3D version 2007; Cor-related Solutions) was used to calculate the in-plane deforma-tion fields (u, v) with respect to the initial dry image coordinates (x, y), together with the strain fields εxx = ∂xu, εyy = ∂yv, and εxy = 0.5 (∂yu+∂xv).
The NIs were aligned with respect to each other and to the cal-culated deformation fields with self-developed software based on the image processing packages of MATLAB (The Mathworks, Inc., Natick, MA, USA). In a first step, the optic (2.1 and 2.2) and neutron stacks (2.3) were independently prealigned with respect to the dry state to compensate for positioning uncertainties and vibration of cameras, neutron radiography, and sample positioning systems. Six steel screws Si = {S1, S2, . . ., S6} distributed around the sample field of view served as reference markers for image registration. In the optic stacks, the heads of the screws appear as surface reflectors with varying illumination, which are binarized with Otsu’s method followed by a centroid detection (2.4); in the neutron stacks, the integrated transmission patterns at screw regions are optimally tracked by maximizing the 2D cross-correlation with respect the reference image (2.5) (Gonzalez et al. 2004). In a second step, the neutron and optic stacks were aligned with respect to their marker
N_15% N_d C1_dry (reference) C1_15%ad C0_dry (reference) C0_15%ad N_dry N_95%ad
Image mapping and moisture content calculation
Y X u(mm) v(mm) εxx(%) εyy(%) T 0 2 4 6 0 0.5 1 1.5 2 R Camera 0 Camera 1
DIC images Neutron images
Graylevel corrections (flat field, dark current, background /sample scattering)
Pre-alignment (screws, cross-correlation) Pre-alignment
(screws, centroid)
Deformation calculation (VIC3D): 95%ad ← dry
φ C0_95%ad N_95%ad ad ry (reference) S1 S3 S4 S5 S6 & S4 S3 S2 S1 Grayscale Binary C1_95%ad X Neutron-DIC alignment 1. Image alignment (screws, centroid) 2. Glass offset compensation Y
Grayscale Reference 2D correlation
S2 S5
S6
X Y
Clustering and statistics
Deformation
uncorrected Deformationcorrected Growth ringposition (-) (kg mρ-3) (%)c (%)ω
C0_95%ad & N _95%ad
2.1 2.2 2.3 2.5 2.4 2.6 2.7 2.8 2.9 2.10 2.11 2.12 2.13 2.14 0 0.2 0.4 0.6 0.8 1 200 300 400 500 600 700
Growth ring position (-) Growth ring position (-)
ρ (k g m -3) Scatter plot Clustered mean 2.15 0 0.2 0.4 0.6 0.8 1 0 5 10 15 20 25 30 M oi st ur e co nt en t ω (% ) 2.16 1 0.5 0 600 400 200 10 5 30 20 10 0 N C0
centroids (2.6). The transformation between control point pairs in reference images (xSi, ySi) and aligned images
(
x y was in each ˆ ,Si ˆSi)
step described with a projective mapping, which defines a general 2D projection of a 3D scene for a pin-hole camera model (Sutton et al. 2009):(
)(
)
(
)(
)
1 11 12 13 31 32 33 1 21 22 23 31 32 33 ˆ ˆ , Si Si Si Si Si Si Si Si Si Si x h x h y h h x h y h y h x h y h h x h y h − − = + + + + = + + + + (1)where the elements of the transformation matrix hij are uniquely de-termined by four control point pairs. The two additional markers al-lowed reduction of position uncertainties by fitting with linear least squares in Equation (1) and provided a position error estimate. In the second alignment step, for example, the hij with minimum fitting error was chosen from several fittings calibrated with selected ref-erence images. Because the centroid detection is influenced by the marker geometry (Heikkilä and Silvén 1997), the second alignment step was repeated twice to achieve consistent marker geometry in both neutron and optic stacks.
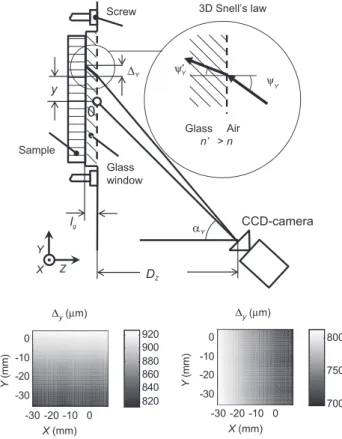
A comparison of the aligned neutron and optic stacks (2.6) reveals an offset in the wood sample position, which was associ-ated to the perspective effect and light refraction introduced by the lg = 1.5 mm thick glass window at the front of the climate box (Figure 3). The offset was approximated with a constant for all im-ages, which was averaged along the displacements (ΔX, ΔY) over the field of view simulated in function of the camera distance Dz = 0.8 m and inclination (αX, αY) = (22°, 18°) and the refraction indexes of air (n = 1.0) and glass (n′ = 1.5): CCD-camera Screw Sample
0
3D Snell’s law Air Glass ψ′ ψ Y DZ Glass window y lg Y Z Y X n’ > n -30 -20 -10 0 -30 -20 -10 0 X (mm) -30 -20 -10 0 X (mm) Y (m m ) 820 840 860 880 900 920 -30 -20 -10 0 Y (m m ) 700 750 800 ∆y (µm) ∆y (µm) Y YFigure 3 Characterization of inhomogeneous offset (ΔX, ΔY) between DIC and NIs due to front glass window of climate box.
{ } { } { } { }
(
)
{
{ } { }(
)
}
{ }(
{ })
, , 1/ 2 2 2 2 , , , , 1 , , tanarcsin sin / 1 tan cos 1- /
tan tan / , g X Y X Y X Y X Y X Y Y X X Y X Y z l n n n n y D ψ ψ ψ ψ θ ψ α − − ∆ = ′ = + ′ ′ ′ = + (2)
Equation (2) is an extension of the equation of Eitner et al. (2010), combining trigonometric considerations with a 3D expression of Snell’s refraction law. Figure 2 shows the images after offset com-pensation (2.7), and the sample edges and LW/EW transitions appear at consistent positions.
Finally, the VIC3D deformation fields (u, v) (2.8) were compen-sated for the NIs to reference specific moist states. Figure 2 shows the LW/EW transitions in moist (95% Ad.) and dry NIs before (2.9) and after (2.10) deformation correction. The moistening leads to vis-ible year ring swelling, especially in the tangential direction, which is compensated for in the corrected images. Bicubic interpolation was used to minimize noise, and all above-described image transforma-tion steps were grouped into a single coordinate transformatransforma-tion.
Calculation of MC
gravand MC
volThe deformation-corrected images were mapped and the local dry wood density ρw (2.12), volumetric moisture content (MCvol) (2.13),
and MCgrav (2.14) were calculated according to Lambert-Beer’s law for each pixel. The equations of Mannes et al. (2009b) were extended to account for the heterogeneous deformation of the pixel dimen-sions in dry state (dx, dy) to a size
(
dx dy dxˆ, ˆ)
=(
[
1+εxx]
,dy1+εyy in)
the moist state. The swelling results in a lower effective density of wood substance in the moist state for the same pixel size. MCgrav isexpressed as the water mass in the deformed pixel (mh) over the dry wood mass:
(
)
(
)
(
)
( )
grav ˆ ˆ MC / / 1 1 / , h w h h w z xx yy h h w z m m Z dxdy l dxdy Z l ρ ρ ε ε ρ ρ = = = + + (3)where zh is the effective water column length in the moist state, lz is the initial sample thickness, and ρh and ρw are the densities of wa-ter and dry wood substance, respectively. MCvol is calculated as the
volume of water (Vh) over the total volume (Vu) of the moist sample: MCvol = Vh/Vu = zh/[lz (1+εzz)]≈zh/lz. (4)
The out of plane strain εzz in the fiber direction was very small (15 μm for an expected maximum swelling coefficient of 0.3%) (Koll-mann and Côté 1968) and thus not considered. zh is expressed as a function of the neutron parameters with:
zh = -1/Σh {lnT-lnT0/[(1+εxx) (1+εyy)]}, (5) where Σh is the neutron attenuation coefficient of water and T and T0
are the open-beam normalized neutron transmission through moist and dry wood, respectively. ρw is expressed as a function of the mass-attenuation coefficient of wood (Σ/ρ)w and lz:
ρw = -lnT0 [(Σ/ρ)wlz]-1. (6) The calculated quantities were plotted as a function of the relative growth ring position ϕ(0, . . ., 1), with 0 and 1 defining EW and LW regions.
ϕ is calculated by segmenting and fitting to cubic smoothing splines the LW-EW transitions in the dry reference NIs, and the slope of the spline provides the annual ring angle φ. The strain fields calculated with VIC3D (εxx, εyy) are then referred to the material directions R and T with
ε{TT, RR} = εXX cos2 φ + ε
YY sin2 φ ± 2 εXY cos φ sin φ. (7) Figure 2 shows scatter plots for the point-to-point mapping of ρw (2.15) and MCgrav (2.16) with φ. Considerable random noise is
avail-able due to both the remaining background noise in the NIs and the natural variability among the investigated annual rings of the tested sample. To create smooth trends between the test quantities, the clustering procedure described by Sanabria et al. (2013) was applied to the scatter plots. ϕ was clustered into 0.05 long intervals, for which the mean value was calculated (∼4500 averages per cluster).
Results and discussion
MC and influence of deformation
compensation
The gravimetrically determined MC ω, plotted as the mean
of four samples against the RH, is shown in Figure 4. The
hysteresis behavior is clearly reflected between
adsorp-tion and desorpadsorp-tion. However, when comparing the
mean sorption isotherm with a mean isotherm calculated
with the Hailwood-Horrobin model (values from Popper
and Niemz 2009), they are 2% to 3% lower for the whole
humidity range. The most likely explanation for this can
be found in the relatively short acclimatization time of 6 h
per RH step. The acclimatization time of 6 h step did not
lead to fully equilibrated samples, although the sample
0 10 20 30 40 50 60 70 80 90 100 0 5 10 15 20 25 30 Relative humidity (%)
Gravimetric moisture content
ω
(%
) ωω
mean
ωH-H
Figure 4 Gravimetrically determined sorption isotherm for adsorp-tion and desorpadsorp-tion (hollow circles), mean sorpadsorp-tion isotherm (bold line), and computed mean sorption isotherm (dashed line) calculated according to the Hailwood-Horrobin model (Popper and Niemz 2009).
thickness of 5 mm was chosen, which, in view of a mean
tracheid length in Norway spruce of 2.8 mm (Wagenführ
2000), should lead to a good accessibility of the open
lumen and the equilibrium should be achieved under
ambient conditions within short time. However, due to
the sample orientation with the smallest dimension
par-allel to the longitudinal direction, no effective moisture
profiles are visible in the images. An additional factor to
decrease EMC can be found in the prior drying treatment
of the samples at 103°C that reportedly leads to slightly
reduced EMC (e.g., Kollmann and Côté 1968; Niemz 1993).
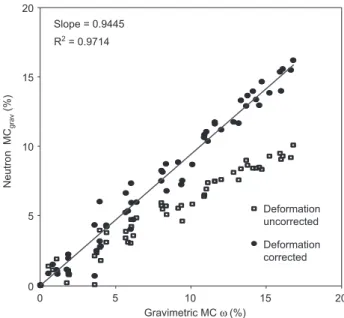
When comparing MC
gravω with those obtained by MC
NIas the mean of the evaluated sample surface (Figure 5),
the values are in good agreement as indicated by a linearly
fitted slope of 0.9445 and a coefficient of determination
of 0.9714. This demonstrates the overall applicability of
the NI procedure for MC determination, however, within
an uncertainty range of ± 2% as indicated by the scattered
data. The effect of neglecting the strain terms
εxxand
εyyin Equation (2) results in an additional MC deviation of
up to 6% with respect to the reference MC
grav(Figure 5)
and also increases the intra-ring variation from ± 0.5%
to ± 1.5% (data not shown). Therefore, the strain
informa-tion cannot be neglected in the local MC
gravcomputation.
Confrontation of volumetric and gravimetric
MC and strain
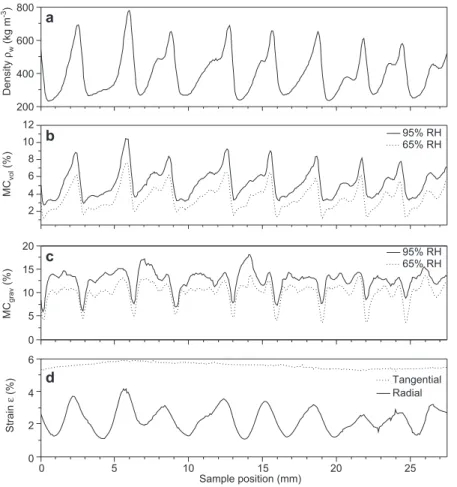
The complete data (i.e., local dry density, MC
voland MC
gravfor 65% and 95% RH and the corresponding radial and
Slope = 0.9445 R2 = 0.9714 20 15 10 5 0 0 5 10 15 20 Deformation uncorrected Deformation corrected Gravimetric MC ω (%) Neutron MC grav (% )
Figure 5 Comparison between MCgrav and mean MC determined
tangential strains) of a representative sample are given
in Figure 6. The pronounced radial density gradients are
found within the growth rings (Figure 6a), with a minimum
density of approximately 250 to 300 kg m
-3in the EW
regions, which increases to a maximum of approximately
600 to 800 kg m
-3in the LW regions and abruptly drops
to the next EW. These densities fairly agree with those
reported in the literature (Wagenführ 2000; Keunecke
et al. 2012). The observed peak values are influenced by
the effective lateral resolution of the NIs (∼700 μm), which
results in a smoothing of the density profiles. The MC
vol,
as displayed in Figure 6b for 65% and 95% RH, shows a
strong correlation with the density within the growth
rings. Whereas the low-density EW regions show a MC
volof
3% to 4%, the high-density LW regions show about twice
the MC
vol(8–10%) at 95% RH. Whereas density and MC
volare closely interrelated, MC
gravshows a different
behav-ior (Figure 6c). The individual growth rings seem to be
characterized by a roughly constant MC
gravthroughout the
center portion of the rings and sudden drops around the
growth ring boundary regions. Additional oscillations are
found for the narrow growth rings at sample positions 7
200 400 600 800 Density ρw (kg m -3) Strain ε (% ) MC vo l (% ) MC grav (% ) 2 4 6 8 10 12 0 5 10 15 20 Sample position (mm) 0 5 10 15 20 25 0 2 4 6 Tangential Radial 95% RH 65% RH
a
b
c
d
95% RH 65% RHFigure 6 Oven-dry density ρw (a), MCvol (b), MCgrav (c), and corresponding radial and tangential strain ε (d) over a sample. MCgrav drops at
growth ring boarders are artifacts due to smoothing effects and do not reflect physical reality.
and 14 mm. When accounting for the corresponding radial
and tangential strain pattern for the 95% RH state as
pre-sented in Figure 6d, radial strain shows a strong
correla-tion with density, where the lowest strains are found for
EW (∼1%) with a continuous increase toward LW (3–4%).
At the same time, the tangential strain is fairly constant
(∼5.5%) over the evaluated area. Again, the lateral
resolu-tion especially influences the radial strain maxima, and
in the case of DIC, where the smoothing is an integral part
of the procedure, it can be minimized but cannot be
elimi-nated completely (Valla et al. 2010; Keunecke et al. 2012).
The occurrence of MC
gravdrops at the LW-EW
inter-faces can be numerically reproduced (Figure 7) by
artifi-cially incorporating smoothing to ideal neutron
transmis-sion profiles. T and T
oare simulated by backward solving
Equations (3) to (6) for high-resolution (∼70 μm) density
profiles, which were experimentally determined by X-ray
densitometry (Evans 1994; Evans et al. 1999). Thus, ideally
constant MC
gravprofiles (dashed lines) can be obtained,
which are influenced by random noise, positioning
uncer-tainties, and smoothing and the subsequently
recalcu-lated MC
gravand ρ
ware represented by solid lines. The
simulated MC
gravtrends (Figure 7) are in fair agreement
with the experiments (Figure 6), which shows that the
aforementioned effects are most likely measurement
arti-facts than physical reality.
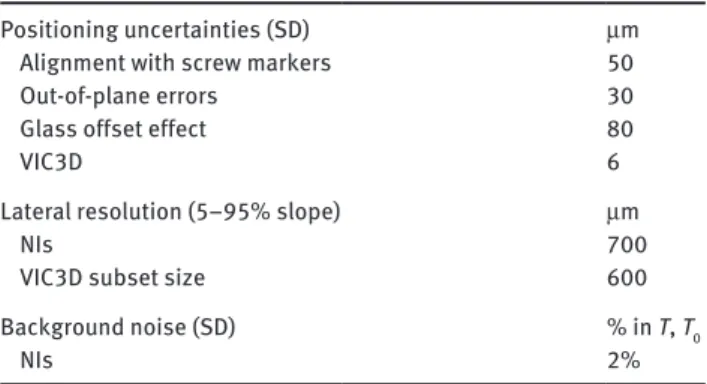
Measurement uncertainty and improvements
Despite the good correlation between mean NI MC
gravvalues and those determined by gravimetry, there are
uncertainties in the NIs due to artifacts related to
posi-tioning uncertainties, the limited lateral resolution, and
background noise (Table 1). The most important
contri-bution to the former is the NI-DIC registration due to the
front glass distortion (Figure 3). A possible approach for
improvement is the compensation of inhomogeneous
offset fields (Haile and Ifju 2012). The out-of-plane
dis-placements (misalignment and swelling) are small, which
allows simplifying the DIC setup to a single camera (2D
correlation) with MC
gravdeviations below 0.2% (mean
square error). The smoothing artifacts (Figures 6 and 7)
are mainly a consequence of the limited lateral resolution
of NIs. Reducing positioning uncertainties by a factor of
10 reduces MC
gravdrops only by 2. The DIC subset size is
not critical, and a reduction from the 15-pixel subset used
200 400 600 800 1000 Density ρw (kg m -3) MC grav (% ) Sample position (mm) 0 0.5 1 T0 T 0 10 20 2 4 6 8 10 12 14 16 18 Neutron transmission (a.u.)
Figure 7 Simulation of effect positioning uncertainties, NI lateral resolution, and background noise on MC determination. NI normalized transmission in dry and moist state T0, T are backward solved for a flat MC and a high-resolution density profile (dashed lines). Density ρw and MCgrav are recalculated (solid lines) after adding up experimental uncertainties (Table 1).
Table 1 List of main uncertainty sources influencing NI/DIC mois-ture measurements.
Positioning uncertainties (SD) μm
Alignment with screw markers 50
Out-of-plane errors 30
Glass offset effect 80
VIC3D 6
Lateral resolution (5–95% slope) μm
NIs 700
VIC3D subset size 600
Background noise (SD) % in T, T0
NIs 2%
here for DIC correlation to a 9-pixel subset led to < 0.07%
changes in MC
gravalong the full ϕ range while reducing the
evaluable sample area. Overall, the lateral resolution of NI
is a compromise with the sample size, and a lateral
reso-lution of approximately 150 μm has been achieved with
1-mm-thick samples (Mannes et al. 2007). As for noise in
the NI images, the main contribution is the remaining
background scattering of the climate box, caused
espe-cially by the lateral walls (Plexiglass). There is a place for
optimization of the box construction with
neutron-trans-parent materials (e.g., glass and aluminum).
Intra-ring MC variation
The growth rings of all samples were aligned and their
mean properties were calculated to minimize the
afore-mentioned artifacts and to present a more general view
of the correlation between local oven-dry density within
a growth ring and corresponding MC
grav. The resulting
density and MC
gravcurves for the RHs are presented for
adsorption in Figure 8 as a function of the normalized
growth ring position ϕ. As stated before, the sharp
transi-tion at the growth ring boundary is artifact prone.
There-fore, ϕ values from 0 to 0.3 (depicted as gray area) are
omitted from the discussion. The density progression in
the growth rings (Figure 8a) can be simplified with two
straight lines. The density increases from approximately
275 kg m
-3in EW until a relative growth ring position of
approximately 0.8 and then the slope abruptly increases
toward the end of the growth ring, where the maximum
density of approximately 600 kg m
-3is reached. The
indi-vidual RH (Figure 8b) steps can be clearly separated with
respect to MC
grav, where an increasing RH leads to a higher
mean MC
grav. They are fairly constant for all ϕ with a slight
variation of ± 0.5%. However, this variation seems to be
250 300 350 400 450 500 550 600 650
Growth ring position (-)
0 0.2 0.4 0.6 0.8 -2 0 2 4 6 8 10 12 14 16 1 95% RH 90% RH 75% RH 65% RH 45% RH 30% RH 15% RH Density ρw (kg m -3) MC grav (% )
a
b
Figure 8 Dry density ρw and MCgrav in adsorption for different RH
states depending on position within growth ring. 0 denotes EW and 1 denotes LW. Growth ring position from 0 to 0.3 (gray rectangle) is an artifact and is therefore excluded from evaluation.
reproducible for all displayed RH steps during
adsorp-tion as well as for desorpadsorp-tion (data not shown), except for
the 65% RH. From the EW (ϕ = 0.3) the MC
gravshows local
maxima at approximately ϕ = 0.5 and 0.9, coinciding to
changes in slope in the LW density, which are similarly
associated to spatial smoothing artifacts. Under
consid-eration of the total uncertainty between MC
NIand MC
grav(Figure 4) and the MC trends of Figure 6, it can be
con-cluded that the MC
gravis constant within the growth ring
within a ± 0.5% uncertainty range. Smaller MC
gravvaria-tions fall below the measurement uncertainty and cannot
be reliably attributed to a physical effect.
A clear distinction has to be made between MC
voland MC
grav. MC
volhas a strong correlation with density as
demonstrated by nuclear magnetic resonance
spectros-copy for steady-state moisture diffusion (60% RH
differ-ence) in radial direction with high MC
volin the dense LW
and low MC
volin the light EW (Eitelberger et al. 2011a).
Similar results were found for P. sylvestris by other authors
(Hameury and Sterley 2006; Dvinskikh et al. 2011;
Eitel-berger et al. 2011b). Clearly, our data further support these
observations under equilibrium conditions. Whereas the
MRI method of Dvinskikh et al. (2011) and Eitelberger et al.
(2011b) achieves a better lateral resolution (78 μm) and
consequently gives rise to a larger artifact-free year ring
portion, the combined NI and DIC measurements allow
full-field in situ monitoring of combined moisture and
deformation processes, providing both MC
voland MC
gravin
addition to the corresponding deformations.
The general conclusion drawn from the observed flat
MC
gravtrend is that the amount of water in a given volume
of cell wall material is approximately constant regardless of
the growth ring position. However, the total MC
volis
signifi-cantly higher in LW than in EW due to its thicker cell walls,
which are reflected in the overall higher density. This plays
an important role when accounting for wood
hygrome-chanical properties, which show a strong correlation with
MC
grav(Gerhards 1982). Furthermore, in the hygroscopic
region (below fiber saturation point), the relation between
RH and swelling of bulk wood is known to be linear
(Koll-mann and Côté 1968). From our observations, this relation
seems to be also true at the growth ring scale. The higher
MC
volin LW is accompanied by a higher deformation of the
compartment, which leads to a constant MC
grav.
Conclusion
The question was in focus, in which relation are the
param-eters MC
grav, cell geometry, density, and elastic properties
within the growth rings of Norway spruce. The method
tested, which combines NI and DIC, shows promising
fea-tures because it allows for calculating the local MC
gravand
MC
vol. The local MC
volis strongly influenced by the oven-dry
density, but the MC
gravis constant within a range of ± 0.5%
in the hygroscopic region. Unfortunately, the region ϕ = 0,
. . ., 0.3 in the vicinity of LW-EW interfaces is artifact prone
and cannot be interpreted safely. The agreement between
MC
gravand MC
NIvalues for individual samples is ± 2%. The
swelling strains need to be included in the MC
gravcalcu-lations; otherwise, the error would be ± 5%. The
combi-nation of NI and DIC permits the simultaneous analysis
of moisture distribution and deformation in materials.
The method could be useful for the observation of
time-dependent sorption behavior and drying. The NI+DIC
method is rapid with data acquisition in a few seconds
and permits the simultaneous computation of strain and
moisture related quantities. After further improvements,
which could involve a simplification of the method by
using solely the NI images for cross-correlation and an
improved referencing frame, it could be an alternative for
the study of moisture transport and deformation in wood.
Acknowledgments: The first author financed by the
Swiss National Science Foundation (Grant No. 125184).
The Building Physics group at EMPA is acknowledged for
using the conditioning device. Furthermore, Ms. V.
Krack-ler and Mr. F. Michel are gratefully acknowledged for
help-ing with the experiments at Paul Scherrer Institut, and
Dr. Falk Wittel for his contribution in the data evaluation.
Received October 23, 2012; accepted March 25, 2013; previously published online May 4, 2013
References
Badel, É., Perré, P. (2002) Predicting oak wood properties using X-ray inspection: representation, homogenisation and localisation. Part I: digital X-ray imaging and representation by finite elements. Ann. For. Sci. 59:767–776.
Bengtsson, C. (2001) Variation of moisture induced movements in Norway spruce (Picea abies). Ann. For. Sci. 58:568–581. Boutelje, J.B. (1962) The relationship of structure to transverse
anisotropy in wood with reference to shrinkage and elasticity. Holzforschung 16:33–46.
Derome, D., Griffa, M., Koebel, M., Carmeliet, J. (2011) Hysteretic swelling of wood at cellular scale probed by phase-contrast X-ray tomography. J. Struct. Biol. 173:180–190.
Donaldson, L. (2008) Microfibril angle: measurement, variation and relationships – a review. IAWA J. 29:345–386.
Dvinskikh, S.V., Henriksson, M., Berglund, L.A., Furó, I. (2011) A multinuclear magnetic resonance imaging (MRI) study of wood with adsorbed water: estimating bound water concentration and local wood density. Holzforschung 65:103–107. Eder, M., Jungnikl, K., Burgert, I. (2009) A close-up view of wood
structure and properties across a growth ring of Norway spruce (Picea abies [L] Karst.). Trees-Struct. Funct. 23:79–84.
Eitelberger, J., Hofstetter, K., Dvinskikh, S.V. (2011a) A multi-scale approach for simulation of transient moisture transport processes in wood below the fiber saturation point. Compos. Sci. Technol. 71:1727–1738.
Eitelberger, J., Svensson, S., Hofstetter, K. (2011b) Theory of transport processes in wood below the fiber saturation point. Physical background on the microscale and its macroscopic description. Holzforschung 65:337–342.
Eitner, U., Köntges, M., Brendel, R. (2010) Use of digital image correlation technique to determine thermomechanical deformations in photovoltaic laminates: measurements and accuracy. Sol. Energy Mater. Sol. C 94:1346–1351.
Evans, R. (1994) Rapid measurement of the transverse dimensions of tracheids in radial wood sections from Pinus radiata. Holzforschung 48:168–172.
Evans, R., Hughes, M., Menz, D. (1999) Microfibril angle variation by scanning X-ray diffractometry. Appita J. 52:363–367.
Fengel, D., Stoll, M. (1973) Über die Veränderungen des Zellquer-schnitts, der Dicke der Zellwand und der Wandschichten von Fichtenholz-Tracheiden innerhalb eines Jahrringes. Holzforschung 27:1–7.
Gerhards, C.C. (1982) Effect of moisture content and temperature on the mechanical properties of wood: an analysis of immediate effects. Wood Fiber Sci. 14:4–36.
Gonzalez, R.C., Woods, R.E., Eddins, S.L. Digital Image using Matlab Processing. Pearson Prentice-Hall, Upper Saddle River, 2004.
Haile, M.A., Ifju, P.G. (2012) Application of elastic image registration and refraction correction for non-contact underwater strain measurement. Strain 48:136–142.
Hameury, S., Sterley, M. (2006) Magnetic resonance imaging of moisture distribution in Pinus sylvestris L. exposed to daily indoor relative humidity fluctuations. Wood Mater. Sci. Eng. 1:116–126.
Hansmann, C., Konnerth, J., Rosner, S. (2011) Digital image analysis of radial shrinkage of fresh spruce (Picea abies L.) wood. Wood Mater. Sci. Eng. 6:2–6.
Harris, J.M., Meylan, B.A. (1965) The influence of microfibril angle on longitudinal and tangential shrinkage in Pinus radiata. Holzforschung 19:144–153.
Heikkilä, J., Silvén, O. (1997) A four-step calibration procedure with implicit image correction. In: Proceedings of the IEEE Computer Society Conference on Computer Vision and Pattern Recognition, pp. 1106–1112.
Keunecke, D., Novosseletz, K., Lanvermann, C., Mannes, D., Niemz, P. (2012) Combination of X-ray and digital image correlation for the analysis of moisture-induced strain in wood: opportunities and challenges. Eur. J. Wood Wood Prod. 70:407–413.
Kollmann, F.F., Côté, W.A. Principles of Wood Science and Technology: Part I Solid Wood. Springer Verlag, 1968.
Lanvermann, C., Schmitt, U., Evans, R., Hering, S., Niemz, P. (2013) Distribution of structure and lignin within growth rings of Norway spruce. Wood Sci. Technol. Published online first. DOI: 10.1007/ s00226-013-0529-8.
Lehmann, E.H., Mannes, D. (2012) Wood investigations by means of radiation transmission techniques. J. Cult. Herit. 13:35–43. Lehmann, E.H., Vontobel, P., Scherrer, P., Niemz, P. (2001a)
Anwendung der Methode der Neutronenradiographie zur Analyse von Holzeigenschaften. Eur. J. Wood Wood Prod. 59:463–471.
Lehmann, E.H., Vontobel, P., Wiezel, L. (2001b) Properties of the radiography facility NEUTRA at SINQ and its potential for use as a European Reference Facility. Nondestr. Testing Eval. 16:191–202. Mannes, D., Lehmann, E., Cherubini, P., Niemz, P. (2007) Neutron
imaging versus standard X-ray densitometry as method to measure tree-ring wood density. Trees 21:605–612. Mannes, D., Josic, L., Lehmann, E., Niemz, P. (2009a) Neutron
attenuation coefficients for non-invasive quantification of wood properties. Holzforschung 63:472–478.
Mannes, D., Sonderegger, W., Hering, S., Lehmann, E., Niemz, P. (2009b) Non-destructive determination and quantification of diffusion processes in wood by means of neutron imaging. Holzforschung 63:589–596.
Mannes, D., Marone, F., Lehmann, E., Stampanoni, M., Niemz, P. (2010) Application areas of synchrotron radiation tomographic microscopy for wood research. Wood Sci. Technol. 44:67–84. May, H. (1978) Einflüsse von Rohdichte und Jahrringbreite auf das Quellungsverhalten von Fichten-und Kiefernholz. Eur. J. Wood Wood Prod. 36:199–202.
Moon, R.J., Wells, J., Kretschmann, D.E., Evans, J., Wiedenhoeft, A.C., Frihart, C.R. (2010) Influence of chemical treatments on moisture-induced dimensional change and elastic modulus of earlywood and latewood. Holzforschung 64:771–779. Niemz, P. Physik des Holzes und der Holzwerkstoffe. DRW,
Leinfelden-Echterdingen, 1993.
Pang, S., Herritsch, A. (2005) Physical properties of earlywood and latewood of Pinus radiata D. Don: anisotropic shrinkage, equilibrium moisture content and fibre saturation point. Holzforschung 59:654–667.
Popper, R., Bariska, M. (1972) Die Azylierung des Holzes – Erste Mitteilung: Wasserdampf-Sorptionseigenschaften. Eur. J. Wood Wood Prod. 3:289–294.
Popper, R., Niemz, P. (2009) Wasserdampfsorptionsverhalten ausgewählter heimischer und überseeischer Holzarten. Bauphysik 31:117–121.
Quirk, J. (1984) Shrinkage and related properties of Douglas-fir cell walls. Wood Fiber Sci. 16:115–133.
Rosner, S., Riegler, M., Vontobel, P., Mannes, D., Lehmann, E.H., Karlsson, B., Hansmann, C. (2012) Within-ring movement of free water in dehydrating Norway spruce sapwood visualized by neutron radiography. Holzforschung 66:751–756. Sanabria, S.J., Hilbers, U., Neuenschwander, J., Niemz, P.,
Sennhauser, U., Thömen, H., Wenker, J.L. (2013) Modeling and prediction of density distribution and microstructure in particleboards from acoustic properties by correlation of non-contact high-resolution pulsed air-coupled ultrasound and X-ray images. Ultrasonics 53:157–170.
Skaar, C. Wood-Water Relations. Springer-Verlag, Heidelberg, 1988.
Sonderegger, W., Hering, S., Mannes, D., Vontobel, P., Lehmann, E.H., Niemz, P. (2010) Quantitative determination of bound water diffusion in multilayer boards by means of neutron imaging. Eur. J. Wood Wood Prod. 68:341–350.
Sutton, M.A., Orteu, J.J., Schreier, H.W. Image Correlation for Shape, Motion and Deformation Measurements: Basic Concepts, Theory and Applications. Springer, New York, 2009.
Taguchi, A., Murata, K., Nakamura, M., Nakano, T. (2011) Scale effect in the anisotropic deformation change of tracheid cells during water adsorption. Holzforschung 65:253–256.
Trtik, P., Dual, J., Keunecke, D., Mannes, D., Niemz, P., Stahli, P., Kaestner, A., Groso, A., Stampanoni, M. (2007) 3D imaging of microstructure of spruce wood. J. Struct. Biol. 159:46–55. Valla, A., Konnerth, J., Keunecke, D., Niemz, P., Müller, U., Gindl,
W. (2010) Comparison of two optical methods for contactless, full field and highly sensitive in plane deformation
measurements using the example of plywood. Wood Sci. Technol. 45:755–765.