Developing a Data-Driven Approach for Improving Operating Room
Scheduling Processes
by Gregory C. Sham
B.S. Systems Engineering, U.S. Naval Academy, 2003
Submitted to the MIT Sloan School of Management and the Engineering Systems Division in
Partial Fulfillment of the Requirements for the Degrees of
RCIVES
Master of Business Administration IASSH is T3
i
TTUTEand
Master of Science in Engineering Systems
JUN
14 20
In conjunction with the Leaders for Global Operations Program at theMassachusetts Institute of Technology
iBF RRI FS
June 2012
0 2012 Gregory C. Sham. All rights reserved.
The author hereby grants to MIT permission to reproduce and to distribute publicly paper and electronic copies of this thesis document in whole or in part in any medium now known or hereafter created
Signature of Author
MIT{flein School of Management, Engineering Systems Division May 11, 2012 Certified by
David Simchi-Levi, Thesis Supervisor Professor of Civil and EnvironmentajY.ggineering and Engineering Systems
Certified by -____
Vivek Farias, Thesis Supervisor Robert N. Noyce Careef elopment Associate Professor, Sloan School of Management Accepted by
T T ,TClair, Engineering Systems Education Committee Associate Professor of Aeronautics and Astronautics and Engineering Systems Accepted by
Maura Herson, Director, MRA Program MIT Sloan School of Management
This page intentionally lefi blank.
Developing a Data-Driven Approach for Improving Operating Room
Scheduling Processes
by
Gregory C. Sham
Submitted to the MIT Sloan School of Management and the Engineering Systems Division on May 11, 2012 in Partial Fulfillment of the Requirements for the Degrees of Master of Business
Administration and Master of Science in Engineering Systems
Abstract
In the current healthcare environment, the cost of delivering patient care is an important concern for hospitals. As a result, healthcare organizations are being driven to maximize their existing resources, both in terms of infrastructure and human capital. Using a data-driven approach with analytical techniques from operations management can contribute towards this goal. More specifically, this thesis shows, drawing from a recent project at Beth Israel Deaconess Medical Center (BIDMC), that predictive modeling can be applied to operating room (OR) scheduling in order to effectively increase capacity.
By examining the current usage of the existing block schedule system at BIDMC and developing a linear regression model, OR time that is expected to go unused can be instead identified in advance and freed for use. Sample model results show that it is expected to be operationally effective by capturing a large enough portion of OR time for a pooled set of blocks to be useful for advanced scheduling purposes. This analytically determined free time represents an improvement in how the current block system is employed, especially in terms of the nominal block release time. This thesis makes the argument that such a model can integrate into a scheduling system with more efficient and flexible processes, ultimately resulting in more effective usage of existing resources.
Thesis Supervisor: David Simchi-Levi
Title: Professor of Civil and Environmental Engineering and Engineering Systems Thesis Supervisor: Vivek Farias
Acknowledgments
To begin I would like to thank the LGO program staff for their assistance and BIDMC for sponsoring this project. Specifically, my company supervisor Elena Canacari and project champion Dr. Brett Simon have been the key people in guiding this first LGO project with BIDMC. In addition, the following staff members welcomed me to the Medical Center and provided invaluable expertise throughout the project: Dr. Pete Panzica, Dottie Sarno, Jane Cody,
Elizabeth Wood, and Gail Piatowski.
I would also like to thank my advisors David Simchi-Levi and Vivek Farias for their assistance and input throughout the project. In particular, Vivek's analytical insights and passion for driving operational improvements in healthcare have been an inspiration. I would also like to
acknowledge Retsef Levi for his work in making healthcare operations, including this project, a part of the LGO experience.
Furthermore, I want to acknowledge my LGO classmates as well as my wife Cheryl for all their support during the last two years. Finally, none of this would have been possible at all except by the grace of God and for that I am incredibly thankful.
A b stra ct...3
Acknow ledgm ents ... 5
List of Figures...9
1 Introduction ... 10
1.1 Background ... 10
1.2 Project M otivation... 11
1.3 Problem Statem ent and Purpose...11
1.4 Thesis Overview ... 12
2 Scheduling Current and Future State ... 14
2.1 M edical Center Perioperative Services Overview ... 14
2.2 Current Scheduling System ... 16
2 .2 .1 F lo w s ... 17
2.2.2 Block Scheduling System ... 17
2.3 Current State Assessm ent... 19
2.4 Desired Future State ... 20
2.5 Dedicated Robotic Surgery Room ... 21
3 Data Collection and Predictive Analytics ... 23
3.2 Discussion of variability in scheduling data ... 23
3.3 Data Quality and Lim itations... 26
3.4 Analytical techniques... 26
3.4.1 Regression techniques... 26
3.4.2 Block schedule optim ization... 28
4 Case Study ... 31
4.1 Introduction...31
4.2 Approach...31
4.3 Dataset and odn ... 33
4.4 Sam ple Results ... 39
4.5 Recom m endations ... 43
5 Decision Support...45
6 Organizational Considerations ... 47
6.1 M edical Center Culture ... 47
6.2 Operations and Business Strategy ... 48
7 Future Considerations and Conclusion ... 51
List of Figures
Figure 1 -Perioperative Services Overview... 14
Figure 2: Block Schedule Example ... 18
Figure 3: Scheduled OR demand for selected blocks... 25
Figure 4: Filled Schedule Example ... 29
Figure 5: Rearranged Schedule ... 30
Figure 6: Advanced Booking Distribution ... 33
Figure 7: Scheduled M inutes Distribution ... 34
Figure 8: Linear Regression M odel... 35
Figure 9: Regression Coefficients and R Squared Values... 40
Figure 10: Results by M onth ... 40
Figure 11: Overall Results by Day ... 40
Figure 12: Predictive M odel Value Added... 41
1 Introduction
The processes for how a hospital schedules surgeries in its operating rooms can be seen from a system-level perspective. For a large organization with a greater number of rooms, this system becomes more complex and difficult to manage. The time-tested method of using a block scheduling approach merits closer examination on how potential improvements can be made to the processes, especially when there is much as stake, both financially and in terms of patient care. By using a case-study approach, based on a major Boston-area healthcare organization, this thesis will show the value added by taking a data-driven approach to revamping the existing scheduling system using analytical methods.
1.1 Background
Boston's Longwood Medical Area (LMA) is a nationally known center for healthcare
organizations, featuring academic institutions such as Harvard Medical School, hospitals such as Children's Hospital of Boston, and various research institutes. Given the proximity of so many prominent organizations, the competition for everything from patients to funding and staff is intense. For Beth Israel Deaconess Medical Center (BIDMC)1, a major teaching hospital located in LMA, its location reinforces only reinforces the need to carefully consider costs and measure performance in order to thrive, which this thesis will explore in greater detail.
It is increasingly common for hospitals to operate in cooperation with other groups -BIDMC for example has affiliate hospitals in Needham and Milton as well as various other partnerships.2 This is important because it means that the sharing of resources and other logistical concerns must be taken into consideration, making the overall system more complex. At the present time, the American healthcare system is continuing to go through major changes, many of which are
1 In referring to BIDMC, the term Medical Center will be used interchangeably in this thesis 2 http://www.bidmc.org/AboutBIDMC/Overview/AffiliatesandPartnerships.aspx
large in scale due to shifts in federal and state governmental policy. Ultimately, healthcare delivery organizations are attempting to maintain and improve their standard of patient care under an increasingly tight set of regulatory and financial constraints.
1.2 Project Motivation
The Leaders for Global Operations (LGO) program has a growing interest in the area of healthcare delivery, with one example being a developing relationship with BIDMC.
Specifically, key BIDMC leaders from the Anesthesia Department and from Perioperative Services are pursuing the idea of taking a non-traditional approach to analyzing and improving existing processes and systems. With this in mind, a project was conceived that would examine
different aspects of perioperative services for potential improvement, including operating room (OR) scheduling, resource allocation, and patient flows. As the project progressed, we
determined that we would focus on the area of OR scheduling, which has an important relation and impact on many other areas and served as the basis for the case study that is featured later in this thesis.
1.3 Problem Statement and Purpose
A hospital's goals will likely include delivering excellent patient care using its available resources. BIDMC summarizes its mission with the following short statement on its website: "To provide extraordinary care, where the patient comes first, supported by world-class education and research."3 In addition to the knowledge available, maximizing fixed (infrastructure) and human resources are necessary to achieve this purpose. However, the reality of the current healthcare landscape is that an organization must also carefully consider its costs as well, which
are subject to both internal and external forces. Given the importance of surgical patients to a healthcare delivery organization, using an analytical approach for perioperative processes can contribute towards to this goal by leading to improvements in operating performance while also reducing the effects of uncertainty present. In an environment where financial constraints can be a considerable concern, obtaining the most use from existing infrastructure and resources is a valuable approach to take in parallel along the consideration of capital expenditures.
This thesis strives to show, largely drawing from the LGO project conducted from June to December 2011 at BIDMC, how a predictive model using linear regression adds value to the OR scheduling system by identifying expected unused free time in advance. By increasing the effective capacity of existing resources, this data-driven approach can be expected to be operationally useful by providing a way to smooth and level OR demand. While operations management models and tools are certainly not meant to replace clinical experience and
personnel judgment, there is a place for their use in the overall system to supplement and improve existing processes and decision-making.
1.4 Thesis Overview
Chapter 2 covers the current and future state of BIDMC's perioperative services, with a focus on scheduling processes. Chapter 3 reviews the available data and analytical techniques,
emphasizing predictive analytics. Chapter 4 contains the project case study, which applies the quantitative model that was developed to a sample dataset to demonstrate how value is added to the scheduling system. Chapter 5 reviews possibilities for how the project's data-driven approach can be extended to be part of an overall decision support system. Finally, Chapter 6 gives an overview of relevant organizational issues and also the place of scheduling in the organization's business and operations strategy while Chapter 7 finishes with future considerations and
conclusions. While there is no dedicated chapter, relevant examples of previous research in healthcare and operations management are referenced throughout the thesis.
2 Scheduling Current and Future State
In order to understand what is at stake by improving the operating room scheduling processes, it is necessary to examine the place of scheduling within the overall perioperative flow in a hospital. Before developing an improvement framework, we took the approach of understanding the current state of the scheduling system and projecting a desired future state.
2.1 Medical Center Perioperative Services Overview
For those unfamiliar with how a hospital typically operates, perioperative services are a standard aspect, although there are variances across different places. For this thesis we will define perioperative as covering the periods of time before and after surgery, overall from time of hospitalization to time of discharge. The different clinical events and administrative procedures that apply to a surgical patient comprise perioperative services and can be broken down into more discrete intervals, focused on the type of care needed. In order to set the appropriate context, we will cover the general perioperative services workflow based on observations at BIDMC. The following figure shows a high-level flow of the processes:
Case OR Pre-
Post-Booking Scheduling Admission Surgery Anesthesia
Testing Care
Figure 1 -Perioperative Services Overview
Case Booking: Once it is determined that a patient will require surgery, this will necessitate that the case be booked at some point. At the Medical Center, a central scheduling office receives its
inputs from the surgeons or their services, usually an administrative contact, and then books elective surgical cases onto the schedule. For most services, the scheduling process is done through direct communication between the clinician side and scheduling office. More recently, an online booking request system has been introduced that improves administrative accuracy and enhances patient safety by allowing booking information to be captured in real-time by the surgeon. The process for non-elective surgeries is different due to their time-sensitive nature.
OR Scheduling: Once cases are initially booked into blocks on the schedule, they generally will remain there until the scheduling clinical manager (or other designated person) shifts them into other blocks for various reasons.4
There is a team of schedulers, supervised by the lead
scheduler, which coordinate and make the bookings. The scheduling clinical manager serves an important role as a central point of contact and is responsible for making a variety of scheduling decisions by coordinating with anesthetists, surgeons, and office staffs throughout the Medical Center. BIDMC's two campuses each have teams of clinical personnel as well to handle different day-to-day operational situations.
If there is not space available for the desired preferences for an elective surgery, it will placed on the waitlist, where it will remain until an appropriate block becomes available closer to the surgery date. In addition to this booking process that applies to elective surgeries, there are separate processes for add-on and emergent procedures. Add-on cases are inpatients5 with a same-day request for surgery, whereas emergent cases comprise several categories of surgeries that must be performed within a specific time frame (i.e. immediately or within 24 hours) out of medical necessity.
Preoperative Assessment Testing (PAT): Once a patient is confirmed to be on the schedule, he or she will also need to undergo preoperative assessment testing at some point. Depending on 4 The block system is a key element of the scheduling process and is discussed in more detail in Chapter 3 5 Patients admitted to the hospital and assigned a bed for minimum of overnight stay
certain medical criteria, this screening can be performed in advance either over the phone or in person at the hospital's PAT area. Either way, before being delivered to the OR suite on the day of surgery, the patient will also be assessed and prepped by nursing and anesthesia staff in a holding area, with additional preoperative clinical care carried out.
Surgery: Surgery will take place in a regular OR suite or a specialized room on either BIDMC's East or West campus. Besides being located in various buildings only some of which are interconnected, the range of equipment features for each room adds more complexity to the perioperative process, along with the need for clinical staffing to be tailored to the types of surgeries being performed. The perioperative aspects that apply here are not the actual procedure itself but the transition of the patient and materials to and from the room. For example, the turnover time, which measures how long it takes to prepare the room for another patient and procedure, is an important factor towards efficient patient flow and system throughput. Also related to this is the efficiency of the PAT process, where delays can push back case start times leading to disruption throughout the system. Another aspect of scheduling that affects this phase is the amount of time that the procedure is scheduled for versus how long it actually takes. Longer disparities between the two can contribute to inefficiencies and suboptimal utilization.
Post-Anesthesia Care: This is the period where patients recover from the effects of surgery and anesthesia in dedicated Post-Anesthesia Care Units (PACUs) located on each campus. From here, they can either be discharged to home or moved to an inpatient bed. Similarly to how the number of operating rooms is a system constraint, the amount of available space in the PACU must be carefully considered as well in the perioperative flow. The challenge of balancing surgical volume and capacity in the scheduling process will also have a downstream impact on
PACU loading and inpatient beds.
2.2.1 Flows
The movement of patients physically traveling to and from the different areas of the hospital is an example of flows in the perioperative process. Another would be the staff's movement, such as the paths of the nurses within a surgical unit. Within healthcare, improving these flows is an area that has been more commonly examined, especially using techniques from lean manufacturing. Applying these methods can have considerable impact, such as when changing the flow of patients through a preoperative admission testing or holding area can result in better system efficiency. At BIDMC, there is a dedicated group that seeks to make improvements using this sort of approach.
Once it is determined that a surgery will be required, a representative of the surgeon's office will compile the necessary information and contact the central scheduling office. Depending on the
availability of block time for that particular surgeon or service, the scheduler will either place the case on the schedule or on a waitlist. Further interaction will occur as scheduling changes become necessary, such as with cancellations or shifts in room assignments. One area of potential improvement is in this information flow.
When inaccurate information is handed off between the office staffs and the scheduling office, personnel time and attention on both ends is taken up as a result and downstream impact to the overall schedule can result. An additional contributor of errors is that there are varying levels of experience in the surgeon's administrative offices due to turnover and training levels. As a result, more complex bookings requiring more input and attention to detail may require rework, leading to schedule disruptions later down the line.
2.2.2 Block Scheduling System
Like many large hospitals, the Medical Center currently uses a block scheduling system for its operating room assignments. This system reserves an interval of time (the 'block') on a given
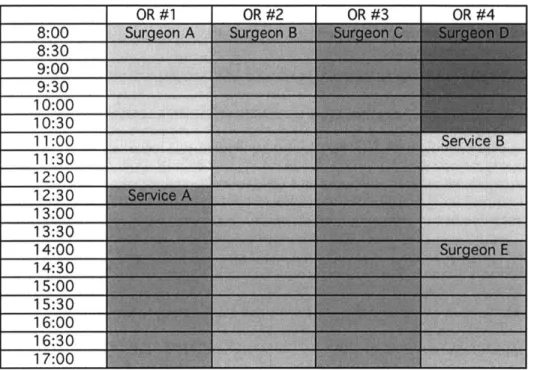
day of the week in a specific room for an individual surgeon. In addition, blocks can also be assigned to a group of surgeons within a certain service, such as General Surgery or Gynecology. Furthermore, specialized surgeries such as cardiac cases or robotic surgery can have dedicated blocks and/or specialized rooms. The figure below gives a generic example of what a block schedule could look like for four operating rooms.
Figure 2: Block Schedule Example
In general, blocks will remain saved for their respective surgeons until made available for open use -generally referred to as block release. This is usually a set four days before the surgery date, at which point waitlisted cases and those from surgeons without block time can be added to the schedule (block release time). For add-ons and emergent cases on the day of surgery that were not assigned a block in advance, the anesthesia floor managers and clinical advisors handling each campuses' set of OR suites coordinate without needing the scheduling office's direct involvement.
This use of block scheduling in the perioperative process has similarities to production scheduling or forecasting in a manufacturing organization's factory or supply chain. Like in those
environments, the staff is balancing the expected usage and demand of a limited resource
-machines and materials in the former compared to staff and rooms in the latter. However, given the healthcare industry's unique nature and goals, there are also distinct differences in a hospital's perioperative process such as the variability across the range of surgeries being performed and how each patient and procedure is handled.
One associated result of implementing a block system is the use of utilization as a metric. In this context, utilization is the amount of OR time used against the amount assigned, commonly
expressed as a percentage. As is usually done with a block schedule, BIDMC tracks surgeon and service utilization in various ways as a factor in making block assignments and gauging
performance. However, there are limitations on the use of utilization as seen in research by Wachtel and Dexter (2008), which described ten comprehensive reasons that utilization based on historical OR time should not determine block time. We will later build upon this idea that utilization is an imperfect metric by looking at alternate ways of measuring the effectiveness of the block system.
2.3 Current State Assessment
We identify several different areas in perioperative services where processes could be improved. First of all, communications with the scheduling office can be more standardized and streamlined. There are policies and procedures in place, but these are fairly broad in nature. However, it is important not to impose a degree of standardization that would present an additional
administrative burden or inhibit individual decision-making by the schedulers. Second, using the block system to assign OR time has become overly complex due to a variety of factors, resulting in an associated burden on the staff. There are number of ways to potentially simplify the process
as well as possibly re-examining the premise of using a block schedule to begin with. Finally, we observe that overall OR usage should be more closely examined, and may be sub-optimal in part because assigned block time may not be released sufficiently in advance to be flexibly used.
2.4 Desired Future State
After analyzing the current state of the scheduling process, we highlight the following desirable characteristics for system's future state:
- Maximize existing resources (infrastructure and human capital) e Greater degree of standardization in communications
- Push vs. Pull system for identifying and using free block time in the schedule. The current process manually releases block time without a direct way to let the surgeons know about extra available space.
e Incentives for surgeons to release unused block time further in advance (beyond in tracked utilization). While not directly self-beneficial, if surgeons choose to make their blocks available to others once they know it will be unused, this will have a positive effect throughout the entire system. One way of encouraging this behavior is by appealing to their collective sense of good for the Medical Center while another is to establish certain tangible benefits.
s Block release time that aligns with the typical advanced booking nature of elective cases for a surgeon or service (in contrast to the current close-in nominal time)
In considering these desirable characteristics, we determine that an analytical model can contribute to the scheduling process by addressing the current block release process. Using a data-driven approach can assist in bringing about system-level changes like those mentioned above. It has been argued that hospitals should identify when the standard block system is not applicable but the OR schedule should be instead optimized for efficiency (Macario 2010). In
this sense, our quantitative approach is aimed at supplementing the utilization-based schedule by presenting a dynamic and adaptive view of the same historical data with the goal of increasing flexibility and efficiency. This thesis will explore the benefits and risks of developing such an approach, and the following BIDMC example gives an indication of how this might look in practice.
2.5 Dedicated Robotic Surgery Room
Robotic surgery has become more widespread as the technology advances and organizations become willing to invest in the necessary expenditures for equipment and training. The Medical Center decided to dedicate an individual OR suite to robotic surgeries, which incorporated into the scheduling process several of the desirable future state attributes mentioned in the previous section. Once the block assignments for this room became available in advance just for robotic surgery, several accompanying changes were also made. Specifically, the release time for robotic surgery blocks was increased from a nominal value of 4 days to 14 days. This intuitively made sense based on the available data because the nature of the robotic surgeries means most cases are booked far in advance. Furthermore, it was determined that available space on the schedule after this release time would be systematically announced to interested surgeons, who could then request the time. As long as there was sufficient demand, this approach reduced the usual burden on the scheduling staff and was observed to improve overall utilization of the room.
However, these results must be put in the context of the sample, which here is a much smaller pool of case types and surgeons than BIDMC as a whole. If it was practical to dedicate room or blocks to each type of a variety of cases, then this approach could be applied more widely. While that is done to some extent now, such as with a cardiac room or orthopedic trauma room, physical and staffing constraints keep it from being even more broadly applied, which is a reason why more sophisticated measures may be necessary.
Another variation of this approach is the idea of service blocks, which is OR time that the assigned group takes responsibility for and allocates out to its surgeons. However, this has the downside of removing scheduling and quality control from the central office and is also counter to the desire of surgeons to have individual block assignments. Building on the desirable future characteristics and the example of the robotic surgery room, an approach to changing the scheduling process by incorporating analytics began to take form.
3 Data Collection and Predictive Analytics
Once we determine that a quantitative approach would be used to look at the scheduling process, it is necessary to more closely examine the available data and analytical techniques.
3.1 Available Data
The data for the LGO project consisted of historical scheduling information filtered by surgeon over different periods of time. Due to privacy requirements, all personal patient information was removed prior to analysis, so that only de-identified data was used for modeling purposes. The relevant information for each surgical case was the following:
- Initial scheduling date (when first booked) - Date and time case was performed
e Assigned surgeon and service - OR suite case was performed in - Number of scheduled OR minutes
3.2 Discussion of variability in scheduling data
With respect to the available data, one concern is that there are multiple sources of variability in the perioperative process with varying degrees of impact. To begin, there is seasonal variation in surgical volume, which at BIDMC largely comes as a result of surgeon preferences. For
example, it is noted that volume is lower in the summertime when a greater number of surgeons will take personal time off. In addition to personal time off, the specific availability of individual surgeons also depends on their clinic and conference schedules. The arrival of the cases also has a random element, which can be further related to characteristics such as elective and non-elective or scheduled and waitlisted. The difference in actual duration of the procedures
to suboptimal performance of the scheduling system. While BIDMC does have a method for determining the scheduled duration, there could be merit in examining whether taking a different approach could have benefits. Previous research has shown that using a statistical model with a 3-parameter lognormal distribution for predicting times led to improvements in OR scheduling (Stepaniak, Heij, Mannaerts, de Quelerij, & de Vries, 2009).
In order to keep the project's scope manageable, we decided to minimize the variability impact by focusing on the scheduled time for elective cases that are placed on the schedule prior to block release time. Therefore waitlisted, add-on, and emergent cases were excluded from consideration by the model. In a previous LGO project at Massachusetts General Hospital, Price (2011)
explored in detail the variability in the perioperative process including waitlisted cases and recommended using open surgical blocks as a way of handling it. From our observations at BIDMC, this intuitively makes sense and is done to a limited extent for certain purposes. However, at a system-wide level, adding open time without extra physical capacity is not practical at the Medical Center due to existing constraints on block assignments.
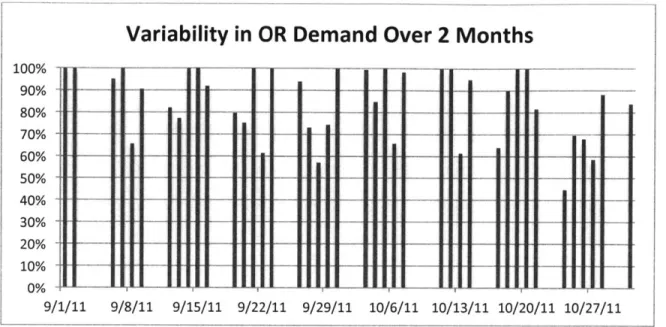
For a visual example of the variable demand, the figure below shows scheduled OR demand (scheduled minutes over available minutes) for the pool of surgical blocks used in this thesis' case study. For these two months (September and October 2011), the number of schedule minutes for the applicable surgeons was summed and then divided by the sum total of the block capacities. Clearly, while a level-loaded surgical schedule is desirable, it is difficult to obtain.
6 This is similar to utilization, which is typically calculated using the actual OR time over capacity, but since we are focusing on expected demand, the scheduled time is used instead
Variability in OR Demand
--~n
- _ _ II I
-l
I
Over 2 Months
I I
1U7 90% 80% 70% 60% 50% 40% 30% 20% 10% 0% 9/ 9/29/11 10/6/11 10/13/11 10/20/11 10/27/11Figure 3: Scheduled OR demand for selected blocks
As the above figure demonstrates, there is variability in the scheduled OR time in a number of ways, such as by day of the week, day to day, and week to week. Being able to qualitatively determine trends and future demand from the historical data is difficult. However, the relevant question is whether or not it is possible to predict and account for the variability. We believe that using quantitative methods will prove more effective than the current practices.
One approach to this uncertainty in demand can be seen in the associated area of OR staffing. Wachtel and Dexter (2010) showed that the newsvendor problem from the operations
management field is strongly analogous to OR staffing but that actual usage of the technique by managers varied, with the important behavioral implications that inherent biases affect decision-making. In that sense where impact depends not only on the technique but how it is applied, it is necessary for us to be mindful of how our quantitative approach's results match up with
scheduling decisions and be properly interpreted and used by managers. 9/8/11 9/15/11 9/22/11
1/11
-3.3 Data Quality and Limitations
One way of improving the data available for analytical purposes is to capture additional information on waitlisted cases. Specifically, being able to gain a better understanding of waitlisted case behavior and how they are booked benefit the schedulers as surgical volume continues to increase and approaches the limits of existing block space. Since waitlisted cases also introduce variability into the scheduling process, they can be more effectively accounted for
in the system through the same type of analytical approach discussed in this thesis.
Another area where data collection can be improved is the information on which room a case was originally booked as opposed to the available information on where it was performed. Since procedures can be moved around, these two are not necessarily the same. While there is an audit trail captures information about how booking information has changed, this is not easily compiled under the current setup. Improving this area could help in determining the optimal arrangement of the OR schedule in a more dynamic fashion. Finally, in terms of data quality, collecting the project data required a great deal of manual effort and due to some system issues also needed a certain amount of rechecking. For future analysis, coming up with automated functions and tools
for extracting and then organizing the scheduling data in the desired format would be significantly positive.
3.4 Analytical techniques
3.4.1 Regression techniques
Now that we have examined the relevant data, the next step is to consider what types of analytics can be applied. For our desired ability to gauge OR demand using historical data, there are different types of predictive statistical techniques available. Linear regression was selected as the technique for our model and its application is detailed in Chapter 4. Other forms of linear
regression such as exponential and polynomial regression were also considered for the predictive model, but early results showed that the benefit from applying these alternate forms were minimal for our purposes.
One benefit of using a linear regression for modeling in this situation is the flexibility in selecting variables. While the scenarios we considered used a certain advance point in time as the
dependent variable, it would be simple to change that to another day in order to obtain different results relative to the actual procedure date. The intervals chosen for the independent variables can also be changed to suit the nature of the group or service being examined.
In addition to linear regression and conditional probabilities, another approach is to use logistic regression with a discrete dependent variable to determine the likelihood that a certain number of hours would be available in advance. For example, a possible output could be that there is a 30% probability that a 4-hour block will be free. One advantage of this approach is that it addresses the need for the model output to be in a form that is useful to decision makers. By setting a threshold for the likelihood of free time being available, decision-makers can interpret the results easily and use the model as a scheduling aid. In addition, if more independent variables besides
scheduled minutes are identified, the coefficients in the logistic regression equation could be used for different interpretative purposes. Multivariate logistic regression is already clinically used in the medical field, especially in the determination of risk for disease.
There are also considerably more powerful techniques that can be applied to the scheduling system. Treating the scheduling data as a time series of data would allow for advanced
forecasting techniques, like those used in a manufacturing supply chain, to be applied. However, as we developed the model, it became clear that keeping the core concept understandable and relatable by using a linear regression was necessary for engaging and convincing the
stakeholders. While it is likely that using other techniques would have definite benefits, exploring that will be an area for future consideration.
Overall, predictive analytics is suitable for our data-driven approach because the aim is to be able to quantitatively determine anticipated OR demand to balance with capacity. The model results will be useful as an additional input to scheduling decision makers in two main ways
-operationally by assisting in determining when additional cases (waitlisted or non-block surgeons) can be added and strategically as a supplement to existing metrics of utilization and throughput.
3.4.2 Block schedule optimization
Another operational aspect of the OR scheduling process which benefits from an analytical approach is how to reorganize of cases on the schedule once they are booked. Ideally, the initial block assignments will lead to an optimal schedule, but this does not occur since cases are usually booked as they arrive and not every block is always used. In this sense, having fixed assignments that do not become open until released can be counter to making an optimal schedule. A prior study testing different scheduling strategies with simulation software concluded that allocating block time on expected case load and scheduling into the first open block available within 4 weeks would maximize OR utilization (Dexter, Macario, Traub, Hopwood, & Lubarsky, 1999).
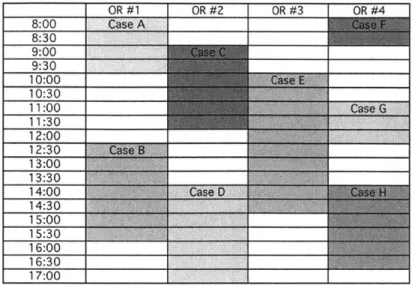
To refer to the BIDMC booking process, as long as space is available a procedure will normally be placed into the appropriate block. However, the schedule for a given date will likely have free time between scheduled cases. To illustrate, refer back to Figure 2, which showed a generic block schedule and Figure 3 below, which shows that schedule now filled with surgeries at some arbitrary point in advance.
Figure 4: Filled Schedule Example
Clearly, the configuration of cases is not optimal for scheduling additional surgeries before that actual date. For example, if a 3 hour long case was to be placed, that would not be possible under the arrangement above.
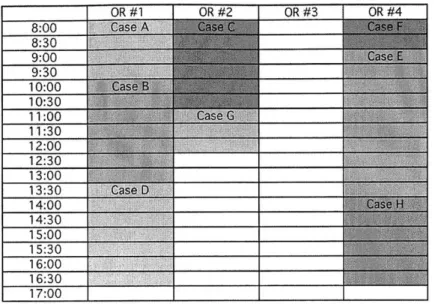
From scheduler's experiences, longer intervals of available OR time are preferred over more numerous but shorter ones since this allows for more flexibility in putting on lengthier waitlisted cases. The time that an individual case is scheduled for is mainly a function of two factors: the surgery that is being performed and the surgeon performing it. Therefore, it is difficult to determine a single optimal block of open time for an entire range of surgical suites. One alternative is to rearrange procedures so that an entire room is free if possible or to create the largest open periods in a room. However, it is important to note that moving procedures around involves meeting staffing requirements and equipment requirements. For surgeons in particular, availability depends on a variety of factors including their case preferences and academic teaching obligations. For our example, one possible reconfiguration is as follows:
Figure 5: Rearranged Schedule
The above is a simplified example to show how a block schedule based in part on surgeon preferences and historical utilization does not necessarily lead to an optimal schedule in terms of efficiency and flexibility. With a manageable number of constraints and by establishing a single objective function, this problem could be optimized using a simple linear program. Multi-objective optimization of the system could be possible as well. However, given the complexity that a large shifting schedule such as BIDMC's can reach, even more powerful algorithms might be needed. In a recent study done at a Netherlands medical center, applied bin-packing
techniques along with portfolio diversification theory from finance were used to show
improvement in OR efficiency (Van Houdenhoven, van Oostrum, Hans, Wullink, & Kazemier, 2007). Due to the level of difficulty that such a problem could reach, we did not further pursue the block schedule optimization as a project objective.
4 Case Study
4.1 Introduction
Over the course of the LGO project at BIDMC, we examined a variety of issues within
perioperative services. While it was clear that there were improvements that could be made to the communication processes and flows, the idea of taking a quantitative look at the block schedule was compelling. Eventually, we determined that developing a data-driven approach to address the issue of capturing value from unused operating room time was worth focusing on, with the following main goals:
- Predict unused OR time well in advance using linear regression
- Develop ideas on how this identified free time can be made operationally useful in order to maximize existing resources
- Specifically for the model, predict the OR demand in minutes for a group of blocks 5 days in advance using historical data
This resulting project work is captured here in a case study to describe how these objectives were pursued, building upon the different topics discussed so far.
4.2 Approach
In considering the goal of being able identify unused OR time in advance, the initial question at hand was to define what is considered to be unused time. As previously discussed, variability in demand can be a significant factor in managing OR assignments. Because of this and other causes, individual OR usage can end up varying considerably. For our purposes, the difference between the scheduled OR time and capacity was considered to be unused time. However, only the time we can determine in advance that is likely be unused by some metric is be useful for
scheduling purposes. In practice, 100% utilization may not necessarily be desirable or possible anyways due to constraints such as staffing and equipment.
Using a quantitative model differentiates this approach from the other scheduling processes in place. Once we determined the predictive method, the next step was to select groups for testing purposes. In order to gain the benefits of pooling blocks together, it was necessary to choose compatible surgeons. What this meant was that the selected blocks are interchangeable in terms of room staffing and equipment. This allows for flexibility in the booking of additional cases into free space and the re-arrangement of existing cases.
Initially, smaller groups of surgeons within one service, such as Ear-Nose-Throat (ENT) or Plastic Surgery were selected and analyzed. We were able to determine that pools of blocks with less variability in booking behavior (better predictability) are a suitable fit for our approach. However, it was necessary to find larger groups of blocks with more surgical volume in order to be able to shows greater gains beyond individual service blocks, which are already in use.
Our data-driven approach also involved regular meetings with stakeholders and collaboration with subject matter experts on the BIDMC staff. One noteworthy aspect of the project was the opportunity to make several presentations to Medical Center leadership who were not directly involved with the project. The organizational considerations involved with convincing others of the project's validity will be described later on and are an important complement to the
quantitative aspects.
Eventually we determined that the data-driven approach should incorporate a model that accomplishes the following:
- Increase effective capacity without impacting existing block owners e Show how system can smooth and level demand on ORs
- Provide flexibility for waitlisted cases and surgeons without block time - Demonstrate sufficient accuracy and robustness
" Adapt to changes in behavior and schedule
4.3 Dataset and Modeling
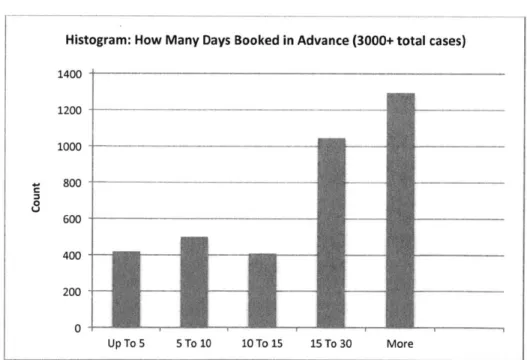
With the assistance of the clinical scheduling manager, we identified a sufficiently large group of blocks across two different services, General surgery and Gynecology surgery. It is important to note that all selected blocks were on just one of BIDMC's two campuses. This was necessary because not only are the case types different between the campuses, but also they are physically separated such that procedures are not easily interchangeable. The following figures show the characteristics of this data set:
Histogram: How Many Days Booked in Advance (3000+ total cases)
1400 1200 -1000 --800 - --_- -- - --400 -200 - - -0 Up To 5 5 To 10 10 To 15 15 To 30 More
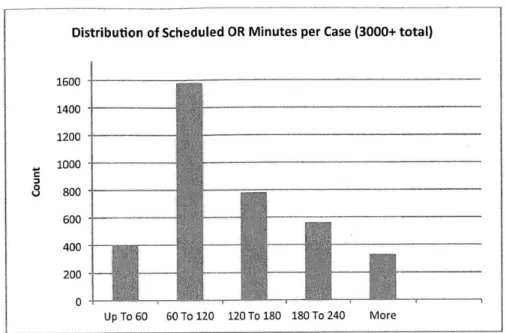
Distribution of Scheduled OR Minutes per Case (3000+ total) 1600 1400 1200 1000 _ U 800 600 400 200 Up To 60 60 To 120 120 To 180 180 To 240 More
Figure 7: Scheduled Minutes Distribution
Once this group was chosen, we went through an iterative process of data collection,
developing, and refining the quantitative model. Once the data was compiled, an Excel pivot table is created to make it usable for regression purposes. The resulting data is formatted as a running total of scheduled minutes by date in discrete intervals. For this project, the intervals were not selected in a deliberate way but for future development this could be tailored to the group being analyzed.
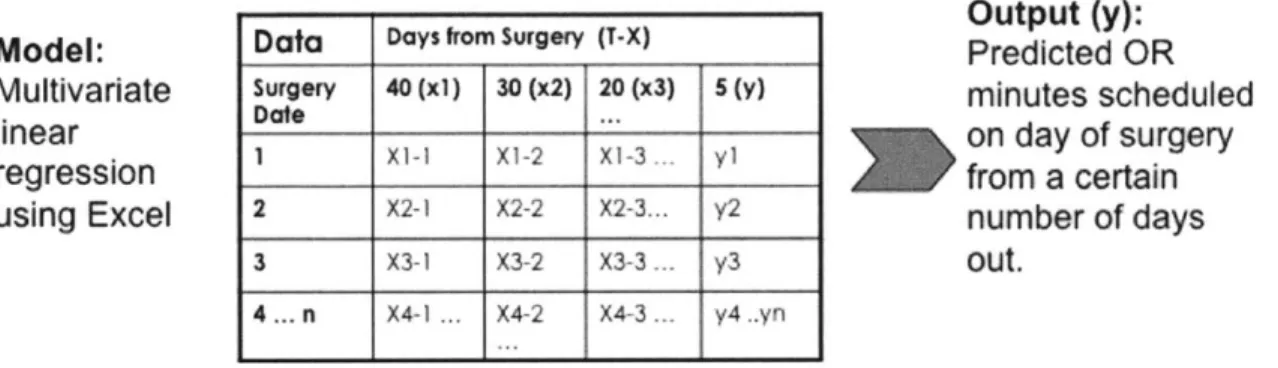
The basis of the predictive model is a multivariate linear regression using the least squares method. For analysis, the scheduling data can be used with different techniques and setup in a variety of ways. In this scenario we set the scheduled OR time five days prior to date of surgery
(T-5) 7 in minutes as the dependent variable and the cumulative scheduled OR time at advance
intervals as the independent variables.
7 To avoid confusion, the nomenclature T-X will be used, where X denotes the number of days prior to surgery. For example, T-3 would represent the data for three days beforehand.
This regression equation takes the form of:
y = mix1 + m2x2 + m3x3 + m4x4 + b
xi = T-40 value, x2 = T-30 value, x3 = T-20 value, x4 = T-15 value
Mi, M2, M3, m4 represent the regression coefficients while b is the intercept value
y represents the T-5 value that we are trying to predict
The resulting regression equations can then be tested with current scheduling data to make a
prediction on the number of scheduled OR minutes. A visual example of the data arrangement
for the linear regression for a set of intervals is shown below:
Model:
Multivariate
linear
regression
using Excel
Output (y):
Predicted OR
minutes scheduled
on day of surgery
from a certain
number of days
out.
Figure 8: Linear Regression Model
With the data in a usable format, it can then be separated into an in-sample part and out-of-sample part. For each set of predictions, the in-out-of-sample set represents the data that was used to determine the regression equation. The out-of sample set is the data that are used as inputs to that regression equation in order to determine y, which is the predicted T-5 value in minutes. Microsoft Excel's TREND function was used to determine and apply the regression efficiently, while the LINEST function was used to get the specific details for each linear regression.
Data Days from Surgery (T-X)
Surgery 40 (xi) 30 (x2) 20 (x3) 5 (y)
Date ...
1 X1-I Xi-2 Xi-3. y1
2 X2-1 X2-2 X2-3... y2
3 X3-1 X3-2 X3-3 y3
In using this approach, we considered that there could be issues of colinearity in using the cumulative total values at the advance intervals as the independent variables for multivariate linear regression. While we determined that this would not have an adverse impact, an alternate method is to use the number of minutes scheduled in the intervals between discrete points as opposed to a cumulative total. For example, see the following table with illustrative data:
The regression equation for the running total method resembles that of a regular linear regression because the resulting coefficients for the T-40, T-30, and T-20 variables make them relatively negligible compared to the T- 15 term, which dominates. With the interval approach, however, all coefficient terms factor into the output and can be considered to be more interpretive. More importantly, we observed that both approaches produce similar results because the information in the intervals is also contained in the running total.
Once the regression is applied to the out-of-sample (test) data, the output of the dependent variable is the prediction for T-5. At this point, we also added in an additional safety factor (SF), which is a user-defined fraction of the standard deviation of the set of differences between Predicted and Actual T-5 results for the regression (out of sample) data. In this case, a static period was used to set the SF for all the predictions, but it can be tailored so that more current data is used for each set of regressions. The SF for a particular day of the week (Monday, Tuesday etc.) can be shown as the following equation:
T-40 T-30 T-20 T-15
Cumulative (min) 60 115 262 385
Safety Factor = x * Stdev(Predicted-Actual T-5 values) where x is a user-defined percentage
This factor is adjustable for different levels of desired conservativeness. The sum of the predicted y value and the safety factor is the Predicted Demand. The Predicted Free time can then be obtained from that and the capacity value, which is the sum of the assigned block times in minutes for the group for that specific day (i.e. first Monday of the month, third Thursday etc.)
Predicted Free = (Capacity -Predicted Demand)+
Since the testing is only using historical data for now (as opposed to real-time), we can compare the predicted values with the actual values to measure the model's performance. In other words, the regression equations from the in-sample data can be applied to the out-of-sample data to get an idea of the model's effectiveness. The two metrics that we developed for this purpose were the "Fraction Free" and "Error Rate", which are obtained from the out-of-sample data by the month as follows:
Actual Free = (Capacity -Actual Demand)+
Fraction Free = Predicted Free/Actual Free
Total Error Rate = Y (Predicted Free-Actual Free)* / E (Actual Free)
The Fraction Free value gives an indication of how much of the free time that was actually available was identified by the model, which can be thought of as how much value was captured. Error Rate, on the other hand, determines what percentage of the total predicted minutes was comprised of over-predictions on a per day basis, which is time that the model showed would be free when it actually was not. Since conservativeness is desirable to avoid impacting existing stakeholders, a lower Error Rate is better. One way that the user can adjust this is by changing the aforementioned Safety Factor while another would be refine the underlying regression
technique. Increasing that factor will generally lower the Fraction Free but also lower the Error Rate.
It is also important to address the issue of seasonality, which was previously discussed in terms of data variability. For modeling purposes, there are different techniques to address this issue when using a linear regression. For example, adding an additional independent variable accounting for season to the multivariate linear regression could be useful. For simplicity, we decided to address seasonality by using a rolling timeframe to determine the linear models.
Therefore, instead of choosing a single static period as the in-sample data, a set number of preceding months (6) were used as the in-sample period for regression analysis for each month of out-of-sample data. In other words, the linear model that was used for each month of results is based on the previous 6 months. This is still not ideal because there is still not a complete alignment of the timeframes, but compromises between using a shorter fixed period and a much longer range of outdated data.
Another issue during model development was how specific to make the datasets for regression purposes. For example, fitting and applying a regression for a given day of the week (Monday, Tuesday, etc) using the same data could give a better fit versus using the aggregated whole week. The individual day's predictions could then be applied towards the larger group although this would increase the difficulty in implementation. However, one downside of this is that there would also be significantly fewer data points used for each regression, increasing the sample error and lead to a tradeoff in the results. Again for simplicity in the initial testing and
implementation, we decided to use one multivariate linear regression for the whole group, while keeping in mind the reduced fit.
Furthermore, due to limitations of the data and block schedule setup, we had to make a number of assumptions so that the model could be applied. Most significantly:
e Since block assignments and cases are not linked in the scheduling system, it is assumed that a procedure done by a surgeon with assigned time was originally booked in his or
her block. This is normal scheduling practice, but cases are frequently shifted to other times or rooms after booking.
* Over the historical period examined, block assignments did change. We attempted to minimize the impact of this when selecting the test group, but capacity was calculated by
finding an average of the block times over the full period using the values at certain intervals. While not precisely matching the block capacity for each out of sample period, this gave a reasonable approximation of the total block time assigned to the group.
* We selected the T-5 day as the point to predict because the nominal block release time is 4 days for the selected blocks. However, the actual block release time depends on the time that is 4 business days before the actual date. Therefore, choosing T-5 does not precisely capture the time right before block release but approximates it across all the weekdays. Furthermore, this model does not capture block time that is released in advance by the owner. Due to information systems limitations, this would have significantly added to the complexity of analyzing a longer period of time.
4.4 Sample Results
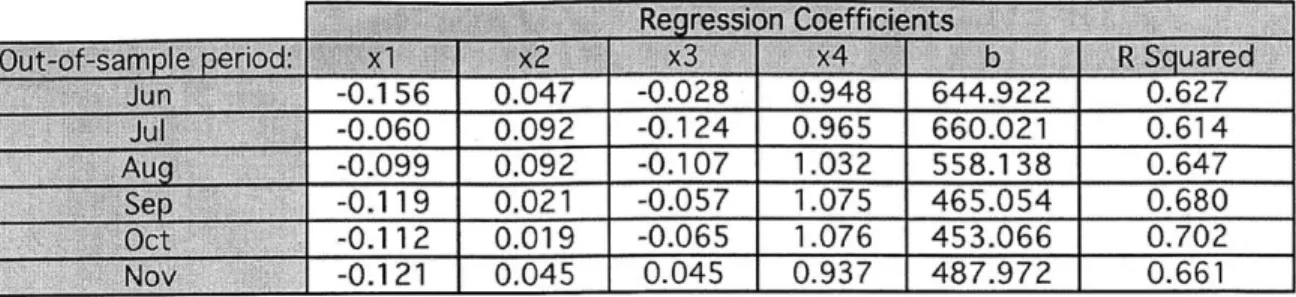
As the model continued to develop, we applied it on the dataset described earlier. Using a safety factor of 50% and the cumulative total approach for inputs to the linear regression, we obtain the following sample results for a 6-month historical period in 2011 to demonstrate the value of the predictive model.
8 For each out-of-sample month, the coefficients represent the regression equation obtained from the previous 6-months in-sample data, as previously described.
Figure 9: Regression Coefficients and R Squared Values
Figure 10: Results by Month
Mon
Average of New Predicted Available (Hours) 7.65
Average of Fraction Free 0.70
Tue
Average of New Predicted Available (Hours) 6.50 Average of Fraction Free 0.51
Wed
Average of New Predicted Available (Hours) 0.56
Average of Fraction Free 0.07
Thu
Average of New Predicted Available (Hours) 4.08 Average of Fraction Free 0.41 Fri
Average of New Predicted Available (Hours) 2.88 Average of Fraction Free 0.25
Figure 11: Overall Results by Day
Jun Average of New Predicted Available (Hours) 2.55
Average of Fraction Free 0.27
Jul Average of New Predicted Available (Hours) 3.35
Average of Fraction Free 0.32
Aug Average of New Predicted Available (Hours) 6.91
Average of Fraction Free 0.46
Sep Average of New Predicted Available (Hours) 4.05
Average of Fraction Free 0.44
Oct Average of New Predicted Available (Hours) 4.85
Average of Fraction Free 0.38
Nov Average of New Predicted Available (Hours) 3.48
The overall average predicted free time available was 4.23 hours with an average fraction free of 0.38. The overall error rate for this period is approximately 9% while the average predicted free time as a measure of capacity is approximately 12%.
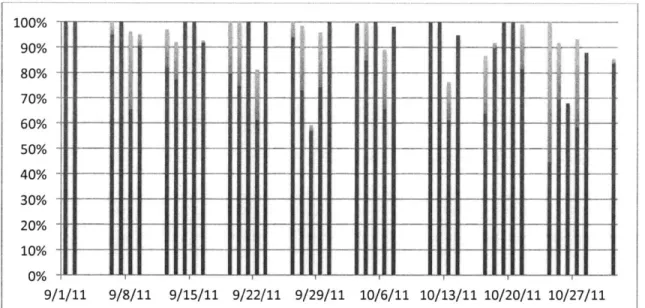
Recalling the earlier figure that showed the variability in demand over a 2-month period, the following figure shows the same sample but with the additional predicted free time identified by the model added to the existing scheduled demand. This free time can be seen in the lighter shaded area above the original bars and visually shows how the models can add additional effective capacity to the current available OR space.
Figure 12: Predictive Model Value Added
As mentioned, one limitation of the available data is that it is a challenge to determine the actual breakdown in durations of identified free space. However, from the model results we can take a sample to get an idea of how useful the space is. Out of 15 selected days (over 3 weeks), 10 out of 15 had additional free time that the model identified. By reconstructing the scheduled cases
100% 90% 80% 70% 60% 50% 40% 30% 20% 10% 0% 9/ 9/8/11 9/15/11 9/22/11 9/29/11 10/6/11 10/13/11 10/20/11 10/27/11 ... ... ... .... ... .... ... ... ... ... ... .. ...-... ....
...-1/11
onto the OR schedules, the breakdown in number of identified free spaces by duration was as follows: 0-2 hours: 15, 2-4 hours: 3, and 4+ hours: 13.
* 0-2 hours
I 2-4 hours 34+ hours
Figure 13: Free Time Duration Breakdown
It is important to note that this analysis was based on the partly optimized post-booking data for the applicable cases. Because the database information represents the actual room and time the procedure was performed in, that final schedule reflects scheduling decisions to move cases and consolidate rooms for flexibility. In other words, we would not expect free spaces of these durations to occur solely from the original arrival of cases onto the schedule. Despite the limited sample and this caveat, the results still suggest that the identified free time will likely be
sufficiently long in duration to be useful for scheduling purposes. Finding an automated way to more accurately determine these free length breakdowns merits further examination.
Finally, we must note that these sample results show how the model identified available OR space in advance only for a selected group of blocks over a historical period. Due to differences in case and service characteristics, the results cannot be simply extrapolated to the larger overall group of Medical Center surgical cases. However, the value lies in being able to apply this same data-driven approach in the future to larger and more varied pools of blocks, accounting for
larger parts of the overall OR schedule. While individual gains will likely vary across the different groups, the cumulative effect should be able to achieve the broader stakeholder goals.
4.5 Recommendations
In reviewing the case study, there are some important takeaways. First of all, the data collection and analysis should be automated to a greater extent by the systems already in use by BIDMC Perioperative Services, as opposed to needing a high degree of manual extraction and
spreadsheet analysis. Being able to perform the data gathering and analysis directly in Access or using SQL queries will be significantly more efficient and accurate, especially in examining multiple large groups. This along with a user-friendly interface would also allow for output of the results into a customizable report in the same way that utilization and other scheduling information can be received now.
In parallel with automating the processes and interface, another suggestion is to continue to refine the quantitative assumptions and structure of the model, particularly the linear regression. Using a more powerful statistical program for analysis would be beneficial for implementing advanced forecasting techniques. For example, adding additional variables could potentially improve a linear regression's accuracy while having a more sophisticated determination of the safety factor could make the results more useful.
Also, there is a need for a method of translating the quantitative model output into a more tangible result that would be useful in day-to-day operations. Specifically, the identified number of available hours for the selected pool of blocks is not useful to decision makers on its own. The free time allocation sample shown above is a first step towards giving an idea of when and how the identified free time can be reallocated. Having an accurate indication that a certain amount of time can safely be made available in advance of the regular release time will be
beneficial. However, the information systems in place will need to incorporate additional ways of tracking room assignments and free time gaps in order to make this data more accurate.
5 Decision Support
So far we have examined how predictive analytics can be applied to perioperative services, specifically OR scheduling. In order to maximize this approach's effectiveness, a quantitative model needs further expansion into the area of decision support systems. In a general sense, decision support involves the use of computer-based information systems to provide input for decision-making. This is a differentiation from computer-based decision-making, which would be the use of models and algorithms to select an option or answer.
Healthcare organizations have already taken a page from other industries and introduced decision support into clinical applications. In addition, decision support is used for such functional areas as tracking financial measures and metrics like throughput. At BIDMC, for example, there is extensive use of healthcare information systems and the Medical Center has been recognized in the past as a most wired hospital.9 Also, a dedicated group provides decision support functions to different areas of the Medical Center, under the overview of the finance department.
Within perioperative services, however, we see an opportunity for a decision support system specifically tailored to the operating room scheduling process. An in-house perioperative information management system (PIMS) already exists and is used for a variety of functions. Therefore, an immediate concern is how to link predictive analytics to the existing interface and put the right processes in place. In an article on Perioperative Information Systems, Foster (2009, August) outlines a two-step process for block prioritization and also includes the
recommendations to track releases and use real-time automated dashboards. Over the course of the LGO project, similar ideas have been suggested as initiatives, which could aid the scheduling process.