HAL Id: hal-00295594
https://hal.archives-ouvertes.fr/hal-00295594
Submitted on 27 Jan 2005
HAL is a multi-disciplinary open access
archive for the deposit and dissemination of
sci-entific research documents, whether they are
pub-lished or not. The documents may come from
teaching and research institutions in France or
abroad, or from public or private research centers.
L’archive ouverte pluridisciplinaire HAL, est
destinée au dépôt et à la diffusion de documents
scientifiques de niveau recherche, publiés ou non,
émanant des établissements d’enseignement et de
recherche français ou étrangers, des laboratoires
publics ou privés.
D. J. Lary
To cite this version:
D. J. Lary. Halogens and the chemistry of the free troposphere. Atmospheric Chemistry and Physics,
European Geosciences Union, 2005, 5 (1), pp.227-237. �hal-00295594�
www.atmos-chem-phys.org/acp/5/227/ SRef-ID: 1680-7324/acp/2005-5-227 European Geosciences Union
Chemistry
and Physics
Halogens and the chemistry of the free troposphere
D. J. Lary1,2
1Global Modelling and Assimilation Office, NASA Goddard Space Flight Center, Greenbelt, MD, USA
2GEST at the University of Maryland Baltimore County, Baltimore, MD, USA
Received: 20 August 2004 – Published in Atmos. Chem. Phys. Discuss.: 16 September 2004 Revised: 12 November 2004 – Accepted: 26 January 2005 – Published: 27 January 2005
Abstract. The role of halogens in both the marine boundary
layer and the stratosphere has long been recognized, while their role in the free troposphere is often not considered in global chemical models. However, a careful examination of free-tropospheric chemistry constrained by observations us-ing a full chemical data assimilation system shows that halo-gens do play a significant role in the free troposphere. In particular, the chlorine initiation of methane oxidation in the free troposphere can contribute more than 10%, and in some regions up to 50%, of the total rate of initiation. The ini-tiation of methane oxidation by chlorine is particularly im-portant below the polar vortex and in northern mid-latitudes.
Likewise, the hydrolysis of BrONO2 alone can contribute
more than 35% of the HNO3 production rate in the
free-troposphere.
1 Introduction
Halogens play a variety of roles in atmospheric chemistry. Most notable is their involvement in catalytic ozone loss and the formation of the stratospheric ozone hole (Johnston and Podolske, 1978; Cicerone et al., 1983; Farman et al., 1985). Like OH, they are also involved in the initiation and catal-ysis of hydrocarbon oxidation and consequently also play
a role in the partitioning of OH and HO2. Similarly they
are involved with the partitioning of NO and NO2. Some
of the same reactions involved in ozone hole chemistry also lead to the production of nitric acid, namely the hydrolysis
of BrONO2and ClONO2on sulphate aerosols. These roles
are well known and accepted when stratospheric chemistry is being discussed (DeMore et al., 2000). The role of halo-gens is also important in the marine boundary layer (Vogt et al., 1996; Sander and Crutzen, 1996; Richter et al., 1998;
Correspondence to: D. J. Lary
Dickerson et al., 1999; Sander et al., 2003; von Glasow and Crutzen, 2004; von Glasow et al., 2004). Hendricks et al. (1999) presented box model calculations on the impact of heterogeneous reactions of nitrogen, chlorine, and bromine compounds on the chemistry of the mid-latitude tropopause region. von Glasow et al. (2004) recently used observations and a GCM to look at the role of BrO in the troposphere. However, when the chemistry of the free troposphere is con-sidered the role of chlorine is not normally concon-sidered im-portant.
A chemical data assimilation analysis using a full Kalman filter (Fisher and Lary, 1995; Lary et al., 2003; Lary, 2003; Lary et al., 1995b; Lary, 1996) (http://gest.umbc.edu/ AutoChem/) starting in October 1991 and continuing till De-cember 1998 reveals that halogens are also playing a signif-icant role in the chemistry of the free troposphere. Compre-hensive results from the analysis are also available online at http://gest.umbc.edu/CDACentral/. Section 2 describes the analysis system. Section 3 describes the observations used and how they are handled. Section 4 describes our uncer-tainty analysis. Section 5 describes the chemical Kalman fil-ter. Section 6 describes the results relevant to methane oxi-dation. Section 7 describes the role of halogen compounds in the production of nitric acid. Section 8 describes the role
of halogen compounds in the partitioning of OH and HO2.
Section 8 describes the role of halogen compounds in the
partitioning of NO and NO2. Section 10 resents the
conclu-sions.
2 Analysis System
This section describes the basic elements of the analy-sis system infrastructure. A hyperlinked schematic of the chemical assimilation system and automatic code generator and documentor is available online at http://gest.umbc.edu/ AutoChem/Schematic.html.
2.1 Automatic Code Generation
This study used AutoChem, an automatic code generator and documenter for atmospheric chemistry. Given a set of reac-tion databases and a user supplied list of required species it will automatically select the reactions involving those con-stituents. It then constructs the ordinary differential equation (ODE) time derivatives, symbolically differentiates the time derivatives to give the Jacobian, and symbolically differenti-ates the Jacobian to give the Hessian. It also documents the whole process in a set of LaTeX and PDF files.
The subset of reactions involving the user specified con-stituents is extracted by the first AutoChem preprocessor pro-gram called Pick. This subset of reactions is then used by the second AutoChem preprocessor program RoC (rate of change) to generate the time derivatives, Jacobian, and Hes-sian. Once the two preprocessor programs have been run all the Fortran90 code has been generated that is necessary for modelling and assimilating the kinetic processes. An on-line manual of AutoChem is available at http://gest.umbc. edu/AutoChem/.
2.2 Radiative Transfer Calculation of Photolysis Rates
A key part of the chemical model is the calculation of photol-ysis rates. In this study they are calculated using full spheri-cal geometry and multiple scattering (Anderson, 1983; Lary and Pyle, 1991a,b; Meier et al., 1982; Nicolet et al., 1982)
corrected after Becker et al. (2000). The photolysis rate
used for each time step is obtained by ten point Gaussian-Legendre integration of the photolysis rate over the time step (Press et al., 1992). The photolysis rates are looked up in a photolysis rate tabulation which is updated every day for each latitude band to ensure that the current ozone and tem-perature profiles are used to calculate the photolysis rates. A total of 203 wavelength intervals are used from 116.7 to 850 nm (WMO, 1986). Daily solar irradiances are used for each of the 203 wavelength intervals. The surface albedo used for each latitude band is the median albedo observed by TOMS for that month.
2.3 Flow-Tracking Coordinates
Because a major component of the variability of trace gases is due to the atmospheric motions it makes sense to use a co-ordinate system that ‘moves’ with the large scale flow pat-tern to perform our analyses. In this study Lagrangian flow-tracking coordinates are used.
Under adiabatic conditions air parcels move along isen-tropic surfaces (surfaces of constant potential temperature, θ). So when considering tracer fields θ is a suitable vertical coordinate, since it acknowledges the likely vertical motion of air parcels. McIntyre and Palmer (1983, 1984); Hoskins et al. (1985), and Hoskins (1991) have shown the value of isentropic maps of Ertel’s potential vorticity (PV) in
visu-alising large scale dynamical processes. PV is an approx-imate material tracer for motion along isentropic surfaces only (Haynes and McIntyre, 1990). PV plays a central role in large scale dynamics where it behaves as an approximate material tracer (Hoskins et al., 1985).
As a result, PV can be used as the horizontal spatial coor-dinate instead of latitude and longitude (Norton, 1994; Lary et al., 1995a). PV is sufficiently monotonic in latitude on an isentropic surface to act as a useful replacement coordinate for both latitude and longitude, reducing the tracer field from three dimensions to two. These ideas have already led to interesting studies correlating PV and chemical tracers such as N2O and O3(Schoeberl et al., 1989; Schoeberl and Lait,
1992; Proffitt et al., 1989, 1993; Lait et al., 1990; Douglass et al., 1990; Proffitt et al., 1989, 1993; Atkinson, 1993). A key result of these studies is that PV and ozone mixing ratios are correlated on isentropic surfaces in the lower stratosphere (Danielsen, 1968).
Since the absolute values of PV depend strongly upon height and the meteorological condition, it is useful to
nor-malise PV and use PV equivalent latitude (φe) as the
hori-zontal coordinate instead of PV itself. φe is calculated by
considering the area enclosed within a given PV contour on a given θ surface. The φeassigned to every point on this PV
contour is the latitude of a latitude circle which encloses the same area as that PV contour. Therefore, for every level in the atmosphere φehas the same range of values, −90◦to 90◦.
This provides a vortex-tracking, and indeed a flow-tracking, stratospheric coordinate system.
2.4 Analyses Grid
The analyses grid used in this study is cast in equivalent
PV latitude, potential temperature coordinates. With 32
latitudes between 80◦S and 80◦N, and 24 logarithmically
spaced isentropic surfaces between the earth’s surface and 2400 K. The grid resolution was carefully chosen to ensure that there is usually a statistically significant number of ob-servations per analysis grid cell. This allows meaningful rep-resentativeness uncertainty statistics to be calculated based on the observations alone. As the potential temperature at the surface changes with time we use a fixed number of isen-tropic levels between the surface potential temperature for a given day and equivalent latitude band and 500 K, above 500 K the levels remain fixed with time. The isentropic lev-els correspond approximately to the UARS surfaces spaced at 6 per decade in pressure (c.f. the UARS reference atmo-sphere levels http://code916.gsfc.nasa.gov/Public/Analysis/ UARS/urap/home.html).
3 Observations
The key difference between conventional modelling and data assimilation is the use of observations and information on
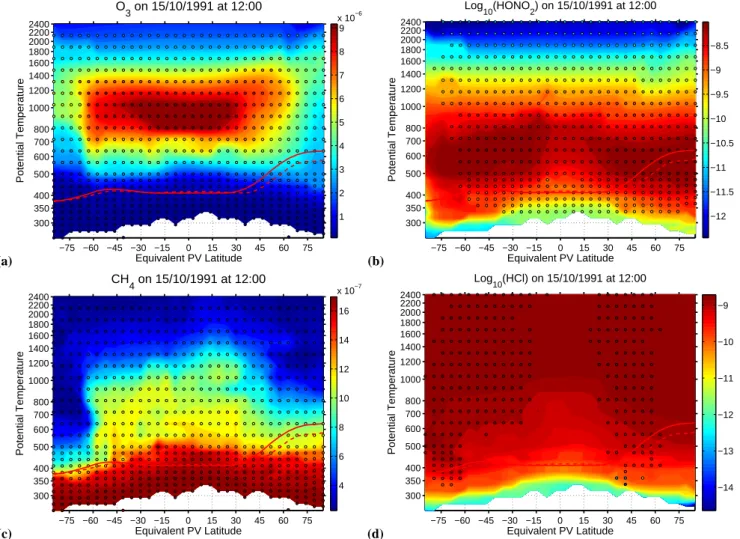
(a) −75 −60 −45 −30 −15 0 15 30 45 60 75 300 350 400 500 600 700 800 1000 1200 1400 1600 1800 2000 2200 2400 Equivalent PV Latitude Potential Temperature O3 on 15/10/1991 at 12:00 1 2 3 4 5 6 7 8 9 x 10⁻⁶ (b) −75 −60 −45 −30 −15 0 15 30 45 60 75 300 350 400 500 600 700 800 1000 1200 1400 1600 1800 2000 2200 2400 Equivalent PV Latitude Potential Temperature Log 10(HONO2) on 15/10/1991 at 12:00 −12 −11.5 −11 −10.5 −10 −9.5 −9 −8.5 (c) −75 −60 −45 −30 −15 0 15 30 45 60 75 300 350 400 500 600 700 800 1000 1200 1400 1600 1800 2000 2200 2400 Equivalent PV Latitude Potential Temperature CH4 on 15/10/1991 at 12:00 4 6 8 10 12 14 16 x 10−7 (d) −75 −60 −45 −30 −15 0 15 30 45 60 75 300 350 400 500 600 700 800 1000 1200 1400 1600 1800 2000 2200 2400 Equivalent PV Latitude Potential Temperature Log 10(HCl) on 15/10/1991 at 12:00 −14 −13 −12 −11 −10 −9
Fig. 1. Panels (a) to (d) show the global ozone, nitric acid, methane and hydrochloric acid analyses from the surface up to the lower
mesosphere produced by chemical data assimilation for October 15, 1991 at local solar noon. The analyses are presented as equivalent PV
latitude - potential temperature cross sections. The background colors show the volume mixing ratio (in the case of HNO3and HCl log10of
the v.m.r.) and the overlaid color filled circles show the observations used. The thick red line overlaid on the plots is the thermal tropopause diagnosed from the UKMO analyses minimum temperature, the dashed red line is the tropopause diagnosed using the WMO lapse rate definition. The white space at the bottom of the plots is because the analysis is terrain following and the surface potential temperature changes with time and location. It can be seen that although the bulk of the observations are in the stratosphere many observations are also available below the tropopause.
observational and other uncertainties (described in the next section). In this study for each analysis grid cell we consider a probability distribution function (PDF) of all the available observations. The ‘observation’ used by the assimilation sys-tem for a given grid cell is the median value of the PDF. The criteria used to determine at what location we use an obser-vation are equivalent PV latitude (φe), and potential
tempera-ture (θ ). An observation is used in φe-θ grid box where it lies.
That means that no interaction between the boxes (merid-ional transport, mixing, diabatic ascent/descent) is consid-ered.
Two criteria were used in choosing which observations to assimilate. First, we chose constituents for which we had observations over the entire period of 1991 to 1998. Sec-ond, where more than one instrument was observing a
con-stituent we chose to use instruments that did not have sig-nificant relative biases. This was determined by looking at observation PDFs. This analysis is also available online at: http://gest.umbc.edu/PDFCentral/.
There appears to be good consistency between the spo-radic observations of missions such as ATMOS and CRISTA with the long-term HALOE and MLS data-sets used. This was not the case for some possible combination of obser-vations. For example, CLAES ozone and MLS ozone had some large differences. After conducting the PDF analyses it seems that the major problems are with CLAES. Another ex-ample is MLS, HALOE and SAGE water, SAGE water was not used after the results of the PDF analyses showed it has bias issues.
The resulting assimilated analyses are presented online, where observations were used these are overlaid on the assimilated analyses (http://gest.umbc.edu/CDACentral/) as filled circles using the same color scale as the color-filled contours used to depict the analyses. This allows ap-propriate comparison with observations to validate the as-similation. In addition, when observations of a constituent were used the web site also provides an assimilation statistics page (at the top of each page just below the java-script cal-endar bar). This page presents the observations, the various observation uncertainties, and the assimilation skill scores.
This study used sulphate aerosol observations from SAGE II (Ackerman et al., 1989; Oberbeck et al., 1989; Rus-sell and McCormick, 1989; Thomason, 1991, 1992; Bau-man et al., 2003) and HALOE (Hervig et al., 1993, 1996; Hervig and Deshler, 1998; Massie et al., 2003), ozone ob-servations from UARS (Reber et al., 1993) MLS v6 (Froide-vaux et al., 1996; Waters, 1998), HALOE v19 (Russell et al., 1993), POAM, ozone sondes and LIDAR, nitric acid obser-vations from UARS MLS v6 (Santee et al., 1997, 1999), CLAES, ATMOS, CRISTA (Offermann and Conway, 1999) and ILAS (Wood et al., 2002), hydrochloric acid observa-tions from UARS HALOE and ATMOS, water observaobserva-tions from UARS HALOE v19, ATMOS and MOZAIC (Marenco et al., 1998), methane observations from UARS HALOE v19, ATMOS and CRISTA were used. Although the bulk of these observations were in the stratosphere a significant number of satellite observations were available for the free troposphere down to 5 km, and from sondes and aircraft data is also available below 5 km (e.g. Fig. 1).
4 Uncertainties
This section describes the treatment of uncertainties of both the observations and the model.
4.1 Observational Uncertainties
A key feature of this study is the quantification of a suite of uncertainties associated with the observations all on the anal-yses grid. The uncertainties provided are: The observational uncertainty as supplied by the instrument teams. The rep-resentativeness uncertainty, i.e. the concentration variability over the analyses grid cell. The Kriging uncertainty, i.e. the uncertainty associated with filling in the data gaps. The total uncertainty due to all of the above. The representativeness uncertainty is calculated by taking the average deviation of the tracer concentrations from the median from the given grid cell.
4.2 Observation Sanity Check
Where possible a zeroth order sanity check on the observa-tions are performed. For example, the observaobserva-tions of HCl should not be greater than the total atmospheric loading of
chlorine, ClOy, and the observations of HNO3should not be
greater than the total atmospheric loading of nitrogen, NOy.
For this sanity check an 81 year run of the Goddard Space Flight Center (GSFC) two-dimensional chemistry and trans-port model run from 1970 to 2050 is used (Fleming et al., 1999). This model run was used for international assess-ments of ozone depletion and is constrained by the recom-mended emission inventories of the various source gases. During the period 1992 to 2000 it is constrained with the observed residual circulation and gives realistic NOy, ClOy,
and BrOydistributions.
4.3 ClOy, BrOy, and NOy
The fields of total ClOy, BrOy, and NOyin our assimilation
were taken from the GSFC 2D model run just mentioned (Fleming et al., 1999). The 2D model transport captures much of the qualitative structure and seasonal variability ob-served in stratospheric long lived tracers, such as isolation of the tropics and the southern hemisphere winter polar vortex, the well-mixed surf-zone region of the winter subtropics and midlatitudes, and the latitudinal and seasonal variations of total ozone. The generally good model-measurement agree-ment of the 2-D tracer simulations demonstrate that a suc-cessful formulation of zonal mean transport processes can be constructed from currently available atmospheric data sets (Fleming et al., 1999).
4.4 Accessing Model Uncertainty
A major new feature of this study is the detail and care with which the observation and modeling uncertainties were de-termined. At each time step the model uncertainty is ac-cessed in detail by performing a set of sensitivity experi-ments. The model is cast in equivalent PV latitude, potential
temperature (φe-θ ) coordinates that are derived from daily
meteorological analyses (UKMO, ECMWF or GEOS). For each analysis grid cell in the flow tracking coordinates we have a probability distribution function (PDF) of tempera-tures, pressures, geographic latitudes (determining the solar illumination) and sulfate aerosol loadings (derived from daily SAGE and HALOE observations). The temperature, pres-sure, geographic latitude and sulfate aerosol loading used for the chemical analysis of each grid cell in the flow tracking coordinates is the median value of the PDF. In order to con-tinuously access the representativeness uncertainty for each grid cell associated with the full PDF of temperatures, pres-sures, geographic latitudes and sulfate aerosol loadings in each grid cell an ensemble of sensitivity experiments is per-formed at each time step. The average deviation from the median is used as a robust estimator of the width of the PDF and the time step is repeated for the median ± average de-viation of the temperature, pressure, geographic latitude and sulfate aerosol loading. This gives a total of eight simulations for each time step that allow a continuous real assessment of
the model representativeness uncertainty associated with the analyses coordinate grid.
5 Chemical Kalman Filter
Khattatov et al. (1999) applied the Kalman filter for synoptic mapping of short-lived species using UARS data. However they ignored possible observational biases and skill scores. Nor did they address the issue of mass non-conservation that can occur. We have demonstrated how use of sophisticated mathematical techniques in atmospheric chemistry can help with data quality control and understanding limitations of modern instruments and models. This aspect is expected to be particularly important in the near future as more and more satellite-based instruments are being deployed and scientific community faces a complicated task of integrating and vali-dating the emerging extensive data sets.
The chemical Kalman filter (Khattatov et al., 1999) al-lows the optimal combination of model simulations and mea-surements taking into account their respective uncertainties. Consider a model of a physical system represented by opera-tor (generally nonlinear) M, and let vecopera-tor x with dimension Nxbe a set of input parameters for the model. So in this case
the model of our non-linear chemical system is represented by M. These input parameters are used to predict the state of the system, vector y with dimension Ny:
y = M(x) (1)
Assume that vector x represents the state of a time-dependent numerical photochemical model, i.e. concentrations of mod-eled species at model grid points in the atmosphere. In the case of a box model that includes N species, the dimension of vector x would be N. We will now limit the discussion to the case when M is used to predict the state of the system at some future time from past state estimates. Formally, in this case
x = xt , y = xt+1t (2)
and xt+1t=M(t, xt) (3)
Let vector yo contain observations of the state (hence
sub-script o). Usually, the dimension of yo is less than Ny, the
dimension of the model space, since not all model species
are usually observed. The connection between yoand y can
be established through the so-called observational operator H:
yo=H(y) (4)
Combining equations (1) and (4), we get
yo=H(M(x)) (5)
We now assume that that the probability density functions associated with x and y can be satisfactorily approximated
by Gaussian functions: P DF (y) ∼ exp −(y − yt) TC−1(y − y t) 2 ! (6)
where yt is the true value of y and C is the corresponding
error covariance matrix. Its diagonal elements are the uncer-tainties (standard deviations) of y, and the off-diagonal ele-ments represent correlation between uncertainties of differ-ent elemdiffer-ents of vector y. The covariance matrix C is defined as
C = h(y − yt)(y − yt)Ti (7)
where angle brackets represent averaging over all available realizations of y.
For most practical applications we need to introduce the linear approximation. In the linear approximation we assume that for small perturbations of the parameter vector 1x the following is approximately true:
M(x + 1x) = M(x) + L1x (8)
Formally, L is a derivative of M with respect to x:
L = dM
dx (9)
For small variations of x one can show that the evolution of error covariance matrix Ct is given by:
Ct +1t =LCtLT +Q (10)
Matrix Q is the error covariance matrix introduced to take into account uncertainties of the model calculations. The Kalman filter equations are
xt+1t=M(t, xt) Ct +1t =LCtLT +Q ˆ xt=xt+CtHT(HCtHT +O)−1(yo−Hxt) (11) ˆ Ct =Ct+CtHT(HCtHT +O)−1HCt (12)
O is the observation error covariance matrix. At the end of each analysis period the model value (xt) and the
correspond-ing observation (yo) are ‘mixed’ (see Eq. 11) with weights
inversely proportional to their respective errors to produce
the analysis, ˆxt. Then the model is integrated forward in
time starting from the obtained analysis. Once an observa-tion has been incorporated in the model, the analysis error covariance should be updated to reflect this (see Eq. 12). In the absence of observations, the model state is updated using Eq. (3), while evolution of the error covariance is obtained from the linearized model equations as in Eq. (10).
If no observations are available, then ˆ
xt=xt (13)
ˆ
Ct=Ct (14)
The following sections examine some of the roles halo-gens play in tropospheric chemistry.
Contributions to CH3production on October 15, 1991 at local solar noon. (a) −75 −60 −45 −30 −15 0 15 30 45 60 75 300 350 400 500 600 700 800 1000 1200 1400 1600 1800 2000 2200 2400 Equivalent PV Latitude Potential Temperature
% of prod for CH3 due to CH4+OH→CH3+H2O Bimolecular
30 40 50 60 70 80 90 (b) −75 −60 −45 −30 −15 0 15 30 45 60 75 300 350 400 500 600 700 800 1000 1200 1400 1600 1800 2000 2200 2400 Equivalent PV Latitude Potential Temperature
% of prod for CH3 due to Cl+CH4→HCl+CH3 Bimolecular
10 20 30 40 50 60 70
Contributions to CH3production on January 15, 1993 at local solar noon.
(c) −75 −60 −45 −30 −15 0 15 30 45 60 75 250 300 350 400 500 600 700 800 1000 1200 1400 1600 1800 2000 2200 2400 Equivalent PV Latitude Potential Temperature
% of prod for CH3 due to CH4+OH→CH3+H2O Bimolecular
30 40 50 60 70 80 90 (d) −75 −60 −45 −30 −15 0 15 30 45 60 75 250 300 350 400 500 600 700 800 1000 1200 1400 1600 1800 2000 2200 2400 Equivalent PV Latitude Potential Temperature
% of prod for CH3 due to Cl+CH4→HCl+CH3 Bimolecular
5 10 15 20 25 30 35 40 45 50 55
Fig. 2. Based on the analyses produced by chemical data assimilation system panel (a) shows the percentage of the initiation of methane
oxidation due to OH for 15 October 1991. At first glance it confirms the conventional position that in the free-troposphere the initiation by OH is all that needs to be considered. However, on closer examination it can be seen that there are extensive regions within the troposphere where the initiation of methane oxidation due to Cl (Panel (b)) contributes more than 10% and some regions where it contributes up to 50%. The regions of significant initiation by Cl are, as would be expected, in the region below the polar vortex, and more surprisingly in northern mid latitudes. The northern mid-latitude feature persists. For example, it can be seen that the mid-latitude role of chlorine initiation is greater in January 1993 (panel (d)). Panels (c) and (d) are the analogues to panels (a) and (b) for 15 January 1993. It can be seen that the northern mid-latitude role of chlorine initiation is slightly greater than for 1991.
6 Initiation of Hydrocarbon Oxidation
Methane and hydrocarbon oxidation are some of the most significant atmospheric chemical processes. The hydroxyl radical (OH) is an important cleansing agent of the lower atmosphere, in particular, it provides the dominant sink for
CH4and HFCs as well as the pollutants NOx, CO and VOCs.
Once formed, tropospheric OH reacts with CH4or CO within
seconds. It is generally accepted that the local abundance
of OH is controlled by the local abundances of NOx, CO,
VOCs, CH4, O3, and H2O as well as the intensity of solar
UV; and thus it varies greatly with time of day, season, and geographic location (Houghton and Ding, 2001).
Methane oxidation is usually initiated by hydrogen ab-straction reactions such as
OH + CH4−→CH3+H2O (15)
O(1D) + CH4−→CH3+OH (16)
Cl + CH4−→CH3+HCl (17)
Br + CH4−→CH3+HBr (18)
The rate at which hydrogen is abstracted from CH4
October 15, 1991 at local solar noon. (a) −75 −60 −45 −30 −15 0 15 30 45 60 75 300 350 400 500 600 700 800 1000 1200 1400 1600 1800 2000 2200 2400 Equivalent PV Latitude Potential Temperature
% of prod for HONO2 due to OH+NO2→HONO2+m Trimolecular
10 20 30 40 50 60 70 80 90 (b) −75 −60 −45 −30 −15 0 15 30 45 60 75 300 350 400 500 600 700 800 1000 1200 1400 1600 1800 2000 2200 2400 Equivalent PV Latitude Potential Temperature
% of prod for HONO2 due to H2O+N2O5→HONO2+HONO2 (Heterogeneous SA)
10 20 30 40 50 60 (c) −75 −60 −45 −30 −15 0 15 30 45 60 75 300 350 400 500 600 700 800 1000 1200 1400 1600 1800 2000 2200 2400 Equivalent PV Latitude Potential Temperature
% of prod for HONO
2 due to H2O+ClONO2→HOCl+HONO2 (Heterogeneous SA)
0.5 1 1.5 2 2.5 3 (d) −75 −60 −45 −30 −15 0 15 30 45 60 75 300 350 400 500 600 700 800 1000 1200 1400 1600 1800 2000 2200 2400 Equivalent PV Latitude Potential Temperature
% of prod for HONO
2 due to H2O+BrONO2→HOBr+HONO2 (Heterogeneous SA)
5 10 15 20 25 30 35
Fig. 3. The contribution of four of the main HNO3production channels. It is well known that two of the key nitric acid production channels
in the troposphere are the bimolecular reaction of OH with NO2(panel (a)) and the heterogeneous hydrolysis of N2O5on sulphate aerosols
(panel (b)). In the stratosphere the heterogeneous hydrolysis of ClONO2(panel (c)) and BrONO2(panel (d)) is also routinely considered. It
can be seen that they are also significant sources of HNO3in the free troposphere.
altitude, and the total reactive chlorine loading
(ClOy=2Cl2+Cl+ClO+2Cl2O2+HCl+HOCl+ClONO2).
It should be noted that Reaction (4) is very slow and just included for the sake of completeness.
Initiation of methane oxidation by Cl is a strong function of ClOy. Burnett and Burnett (1995) have inferred from their
OH column measurements that chlorine is likely to be in-volved in the initiation and oxidation of methane. In agree-ment with this, Fig. 2 shows that significant initiation of methane oxidation is due to Cl.
However, the halogen initiation and catalysis of hydrocar-bons is not usually considered in global chemistry models. This is not due to a lack of kinetic knowledge but rather an assumption that halogens play a minor role outside of the boundary layer and stratosphere (Johnston and Podolske, 1978; Cicerone et al., 1983; Farman et al., 1985). Figure 2 shows that in the lower stratosphere and even in the free
tro-posphere, halogen-catalyzed, and halogen-initiated, methane oxidation can be important. Halogen-catalyzed methane ox-idation can play a significant role in the production of HOx
(=H+OH+HO2) radicals (Lary and Toumi, 1997) in just the
region where it is usually accepted that nitrogen-catalyzed methane oxidation is one of the main sources of ozone
(Houghton and Ding, 2001). Aspects of methane
oxida-tion by halogens has been previously menoxida-tioned by Crutzen et al. (1992); Burnett and Burnett (1995) and the mechanism specifically described by Lary and Toumi (1997).
Figure 1 panels (a) to (d) show the global ozone, nitric acid, methane and hydrochloric acid analyses from the sur-face up to the lower mesosphere produced by chemical data assimilation for mid-October 1991. Based on the analyses produced by chemical data assimilation system Fig. 1 panel (e) shows the percentage of the initiation of methane oxida-tion due to OH. At first glance it confirms the convenoxida-tional
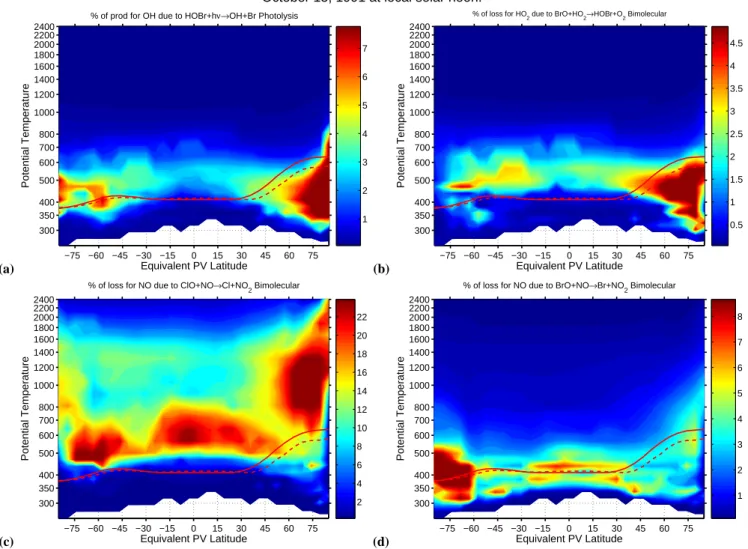
October 15, 1991 at local solar noon. (a) −75 −60 −45 −30 −15 0 15 30 45 60 75 300 350 400 500 600 700 800 1000 1200 1400 1600 1800 2000 2200 2400 Equivalent PV Latitude Potential Temperature
% of prod for OH due to HOBr+hν→OH+Br Photolysis
1 2 3 4 5 6 7 (b) −75 −60 −45 −30 −15 0 15 30 45 60 75 300 350 400 500 600 700 800 1000 1200 1400 1600 1800 2000 2200 2400 Equivalent PV Latitude Potential Temperature
% of loss for HO2 due to BrO+HO2→HOBr+O2 Bimolecular
0.5 1 1.5 2 2.5 3 3.5 4 4.5 (c) −75 −60 −45 −30 −15 0 15 30 45 60 75 300 350 400 500 600 700 800 1000 1200 1400 1600 1800 2000 2200 2400 Equivalent PV Latitude Potential Temperature
% of loss for NO due to ClO+NO→Cl+NO
2 Bimolecular 2 4 6 8 10 12 14 16 18 20 22 (d) −75 −60 −45 −30 −15 0 15 30 45 60 75 300 350 400 500 600 700 800 1000 1200 1400 1600 1800 2000 2200 2400 Equivalent PV Latitude Potential Temperature
% of loss for NO due to BrO+NO→Br+NO
2 Bimolecular 1 2 3 4 5 6 7 8
Fig. 4. HOBr is readily photolyzed in the visible and yields OH. Panel (a) shows that HOBr photolysis can contribute close to 10% of the
total OH production rate at high latitudes in the free-troposphere. Likewise panel (b) shows that the production of HOBr by the bimolecular
reaction of BrO with HO2contributes more than 5% to the total HO2loss rate at high latitudes in the free-troposphere. The tropospheric
partitioning of NO and NO2 is affected by halogen interactions. Panel (c) shows that there are large regions in northern mid-latitudes
and below the polar vortex where more than 10% of the loss of NO is due to reaction with ClO. Panel (d) shows that for much of the free-troposphere the reaction of NO with BrO contributes more than 5% to the loss of NO.
position that in the free-troposphere the initiation by OH is all that needs to be considered. However, on closer examina-tion it can be seen that there are extensive regions within the troposphere where the initiation of methane oxidation due to Cl (Fig. 1 panel (f)) contributes more than 10% and some regions where it contributes up to 50%. The regions of sig-nificant initiation by Cl are, as would be expected, in the re-gion below the polar vortex, and more surprisingly in north-ern mid latitudes. The northnorth-ern mid-latitude feature persists. For example, it can be seen that the mid-latitude role of chlo-rine initiation is greater in January 1993 (Fig. 2 panel (d)).
7 Production of Nitric Acid
It is well known (Brasseur and Solomon, 1987; Wayne, 1991; DeMore et al., 2000) that two of the key nitric acid pro-duction channels are the bimolecular reaction of OH with
NO2and the heterogeneous hydrolysis of N2O5on sulphate
aerosols (please see Fig. 3a and b). In the stratosphere the
heterogeneous hydrolysis of ClONO2and BrONO2are also
routinely considered (DeMore et al., 2000). However, as halogens are often normally not considered in models of the free troposphere these channels are not normally consid-ered in the troposphere. Figure 3c shows that the
hydroly-sis of BrONO2 alone can contribute more than 35% to the
HNO3 production rate (this percentage depends on the
halogen chemistry from global chemical models can lead to a significant error in these regions, yet another reason for con-sidering halogen chemistry in the free troposphere.
8 Partitioning of OH and HO2
HOBr is readily photolyzed in the visible and yields OH (Rattigan et al., 1996). Figure 4a shows that HOBr photol-ysis can contribute close to 10% of the total OH production rate at high latitudes in the free-troposphere. Likewise Fig-ure 4b shows that the production of HOBr by the bimolecular
reaction of BrO with HO2 contributes more than 5% to the
total HO2loss rate at high latitudes in the free-troposphere.
9 Partitioning of NO and NO2
The tropospheric partitioning of NO and NO2is affected by
halogen interactions. Figure 4 panel (c) shows that there are large regions in northern mid-latitudes and below the south-ern polar vortex where more than 10% of the loss of NO is due to reaction with ClO. Figure 4 panel (d) shows that for much of the free-troposphere the reaction of NO with BrO contributes more than 5% to the loss of NO.
10 Conclusions
A careful constraint of a photochemical modelling system us-ing chemical data assimilation and a variety of atmospheric observations has been conducted. A detailed analysis of the results shows that halogens are playing a role in the chem-istry of the free troposphere. In particular, methane oxidation is initiated by Cl as well as OH in the troposphere. The Cl ini-tiation of methane oxidation can contribute more than 10% to the total rate of initiation below the polar vortex and in
mid-latitudes. In addition, the hydrolysis of BrONO2alone
can contribute more than 35% of the HNO3production rate
in the free troposphere. The partitioning of NO and NO2in
the free troposphere is also significantly affected by halogen reactions.
Acknowledgements. It is a pleasure to acknowledge: NASA for a distinguished Goddard Fellowship in Earth Science and for research support; The Royal Society for a Royal Society University Research Fellowship; The government of Israel for an Alon Fellowship; The NERC, EU, and ESA for research support. Edited by: R. Sander
References
Ackerman, M., Brogniez, C., Diallo, B., et al.: European validation of SAGE II aerosol profiles, J. Geophys. Res., 94, 8399–8411, 1989.
Anderson, D.: The troposphere-stratosphere radiation-field at twi-light – A spherical model, Planet. Space Sci., 31, 1517–1523, 1983.
Atkinson, R.: An observational study of the Austral spring strato-sphere: Dynamics, Ozone transport and the ‘Ozone dilution ef-fect, Ph.D. Thesis, Massachusetts Institute of Technology, 1993. Bauman, J. J., Russell, P. B., Geller, M. A., and Hamill, P.: A strato-spheric aerosol climatology from SAGE II and CLAES measure-ments: 1. methodology, J. Geophys. Res. (Atmos.), 108, AAC 6–1 AAC 6–3, 2003.
Becker, G., Grooss, J., McKenna, D., and Muller, R.: Stratospheric photolysis frequencies: Impact of an improved numerical solu-tion of the radiative transfer equasolu-tion, J. Atmos. Chem., 37, 217– 229, 2000.
Brasseur, G. and Solomon, S.: Aeronomy of the Middle Atmo-sphere : Chemistry and Physics of the StratoAtmo-sphere and Meso-sphere, Atmospheric Science Library, D Reidel Pub Co, second edn., 1987.
Burnett, E. and Burnett, C.: Enhanced production of stratospheric OH from methane oxidation at elevated reactive chlorine levels in Northern midlatitudes, J. Atmos. Chem., 21, 13–41, 1995. Cicerone, R. J., Walters, S., and Liu, S. C.: Non-linear response
of stratospheric ozone column to chlorine injections, J. Geophys. Res. (Atmos.), 88, 3647–3661, 1983.
Crutzen, P. J., M¨uller, R. Br¨uhl, C., and Peter, T.: On the potential
importance of the gas-phase reaction CH3OO + ClO−→ ClOO
+ CH3O and the heterogeneous reaction HOCl + HCl −→ H2O
+ Cl2in ozone hole chemistry, Geophys. Res. Lett., 19, 1113–
1116, 1992.
Danielsen, E.: Stratospheric-tropospheric exchange based on ra-dioactivity ozone and potential vorticity, J. Atmos. Sci., 25, 502–, 1968.
DeMore, W. B., Howard, C. J., Sander, S. P., Ravishankara, A. R., Golden, D. M., Kolb, C. E., Hampson, R. F. Molina, M. J., and Kurylo, M. J.: Chemical kinetics and photochemical data for use in stratospheric modeling, supplement to evaluation 12: Update of key reactions, JPL Publ. 00-3, NASA JPL, 2000.
Dickerson, R. R., Rhoads, K. P., Carsey, T. P., Oltmans, S. J., Bur-rows, J. P., and Crutzen, P. J.: Ozone in the remote marine bound-ary layer: A possible role for halogens, J. Geophys. Res. (At-mos.), 104, 21 385–21 395, 1999.
Douglass, A., Rood, R., Stolarski, R., Schoeberl, M., Proffitt, M., Margitan, J., Loewenstein, M., Podolske, J., and Strahan, S.: Global 3-dimensional constituent fields derived from profile data, Geophys. Res. Lett., 17, 525–528, 1990.
Farman, J. C., Gardiner, B. G., and Shanklin, J. D.: Large losses of
total ozone in antarctica reveal seasonal ClOx/NOxinteraction,
Nature, 315, 207–210, 1985.
Fisher, M. and Lary, D.: Lagrangian 4-dimensional variational data assimilation of chemical-species, Q. J. R. Meteorol. Soc., 121, 1681–1704, 1995.
Fleming, E. L., Jackman, C. H., Stolarski, R. S., and Considine, D. B.: Simulation of stratospheric tracers using an improved em-pirically based two-dimensional model transport formulation, J. Geophys. Res. (Atmos.), 104, 23 911–23 934, 1999.
Froidevaux, L., Read, W. G., Lungu, T. A., Cofield, R. E., Fishbein, E. F., Flower, D. A., Jarnot, R. F., Ridenoure, B. P., Shippony, Z., Waters, J. W., Margitan, J. J., McDermid, I. S., Stachnik, R. A., Peckham, G. E., Braathen, G., Deshler, T., Fishman, J., Hof-mann, D. J., and Oltmans, S. J.: Validation of UARS microwave limb sounder ozone measurement, J. Geophys. Res. (Atmos.), 101, 10 017–10 060, 1996.
Haynes, P. H. and McIntyre, M. E.: On the conservation and im-permeability theorems for potential vorticity, J. Atmos. Sci., 47, 2021–2031, 1990.
Hendricks, J., Lippert, E., Petry, H., and Ebel, A.: Heterogeneous reactions on and in sulfate aerosols: Implications for the chem-istry of the midlatitude tropopause region, J. Geophys. Res. (At-mos.), 104, 5531–5550, 1999.
Hervig, M., Russell, J., Gordley, L., Drayson, S., Stone, K., Thomp-son, R., Gelman, M., McDermid, I., Hauchecorne, A., Keckhut, P., McGee, T., Singh, U., and Gross, M.: Validation of temper-ature measurements from the halogen occultation experiment, J. Geophys. Res., 101, 10 277–10 285, 1996.
Hervig, M. E. and Deshler, T.: Stratospheric aerosol surface area and volume inferred from HALOE, CLAES, and ILAS measure-ments, J. Geophys. Res. (Atmos.), 103, 25 345–25 352, 1998. Hervig, M. E., Russell, J. M., Gordley, L. L., Park, J. H., and
Drayson, S. R.: Observations of aerosol by the HALOE experi-ment onboard UARS – a preliminary validation, Geophys. Res. Lett., 20, 1291–1294, 1993.
Hoskins, B.: Towards a PV-Theta view of the general-circulation, Tellus, Ser. A., 43, 27–35, 1991.
Hoskins, B., McIntyre, M., and Robertson, A.: On the use and sig-nificance of isentropic potential vorticity maps, Q. J. R. Meteo-rol. Soc., 111, 877–946, 1985.
Houghton, J. and Ding, Y. (Eds): Climate Change 2001: The Sci-entific Basis, IPCC, UNEP, 2001.
Johnston, H. S. and Podolske, J.: Interpretation of stratospheric photochemistry, Rev. Geophys., 16, 491, 1978.
Khattatov, B., Gille, J., Lyjak, L., Brasseur, G., Dvortsov, V., Roche, A., and Waters, J.: Assimilation of photochemically ac-tive species and a case analysis of UARS data, J. Geophys. Res. (Atmos.), 104, 18 715–18 737, 1999.
Lait, L., Schoeberl, M., Newman, P., Proffitt, M., Loewenstein, M., Podolske, J., Strahan, S., Chan, K., Gary, B., Margitan, J.,
Brow-ell, E., Mccormick, M., and Torres, A.: Reconstruction of O3
and N2O fields fromER-2,DC-8, and balloon observations,
Geo-phys. Res. Lett., 17, 521–524, 1990.
Lary, D.: Gas phase atmospheric bromine photochemistry, J. Geo-phys. Res., 101, 1505–1516, 1996.
Lary, D.: Representativeness uncertainty in chemical data assimi-lation highlight mixing barriers, Atmospheric Science Letters, 5, 35–41, 2003.
Lary, D. and Pyle, J.: Diffuse-radiation, twilight, and photochem-istry: 1., J. Atmos. Chem., 13, 373–392, 1991a.
Lary, D. and Pyle, J.: Diffuse-radiation, twilight, and photochem-istry: 2., J. Atmos. Chem., 13, 393–406, 1991b.
Lary, D. and Toumi, R.: Halogen-catalyzed methane oxidation, J. Geophys. Res., 102, 23 421–23 428, 1997.
Lary, D., Chipperfield, M., Pyle, J., Norton, W., and Riishojgaard, L.: 3-dimensional tracer initialization and general diagnostics us-ing equivalent PV latitude-potential-temperature coordinates, Q. J. R. Meteorol. Soc., 121, 187–210, 1995a.
Lary, D., Chipperfield, M., and Toumi, R.: The potential impact of
the reaction OH+ClO−→HCl+ O2on polar ozone
photochem-istry, J. Atmos. Chem., 21, 61–79, 1995b.
Lary, D. J., Khattatov, B., and Mussa, H. Y.: Chemical data assim-ilation: A case study of solar occultation data from the atlas 1 mission of the atmospheric trace molecule spectroscopy experi-ment (atmos), J. Geophys. Res. (Atmos.), 108, 2003.
Marenco, A., Thouret, V., Nedelec, P., Smit, H., Helten, M., Kley, D., Karcher, F., Simon, P., Law, K., Pyle, J., Poschmann, G., Von Wrede, R., Hume, C., and Cook, T.: Measurement of ozone and water vapor by airbus in-service aircraft: The MOZAIC air-borne program, an overview, J. Geophys. Res. (Atmos.), 103, 25 631–25 642, 1998.
Massie, S., Randel, W., Wu, F., Baumgardner, D., and Hervig, M.: Halogen occultation experiment and stratospheric aerosol and gas experiment ii observations of tropopause cirrus and aerosol during the 1990s, J. Geophys. Res. (Atmos.), 108, 2003. McIntyre, M. and Palmer, T.: Breaking planetary-waves in the
stratosphere, Nature, 305, 593–600, 1983.
McIntyre, M. and Palmer, T.: The surf zone in the stratosphere, J. Atmos. Terr. Phys., 46, 825–849, 1984.
Meier, R., Anderson, D., and Nicolet, M.: Radiation-field in the troposphere and stratosphere from 240–1000 nm. 1., General-analysis, Planet. Space Sci., 30, 923–933, 1982.
Nicolet, M., Meier, R., and Anderson, D.: Radiation-field in the tro-posphere and stratosphere .2. Numerical-analysis, Planet. Space Sci., 30, 935–983, 1982.
Norton, W.: Breaking rossby waves in a model stratosphere di-agnosed by a vortex-following technique for advecting material contours, J. Atmos. Sci., 51, 654–673, 1994.
Oberbeck, V. R., Livingston, J. M., Russell, P. B., Pueschel, R. F., Rosen, J. N., Osborn, M. T., Kritz, M. A., Snetsinger, K. G., and Ferry, G. V.: SAGE-II aerosol validation - selected altitude mea-surements, including particle micromeamea-surements, J. Geophys. Res. (Atmos.), 94, 8367–8380, 1989.
Offermann, D. and Conway, R. R.: Crista/mahrsi – preface, J. Geo-phys. Res. (Atmos.), 104, 16 309–16 310, 1999.
Press, W., Teukolsky, S., Vetterling, W., and Flannery, B.: Numeri-cal Recipes in Fortran - The Art of Scientific Computing, Cam-bridge Univ. Press, New York, 2nd edn., 1992.
Proffitt, M., Steinkamp, M., Powell, J., Mclaughlin, R., Mills, O., Schmeltekopf, A., Thompson, T., Tuck, A., Tyler, T., Winkler, R., and Chan, K.: Insitu ozone measurements within the 1987
antarctic ozone hole from a high-altitudeER-2 aircraft, J.
Geo-phys. Res. (Atmos.), 94, 16 547–16 555, 1989.
Proffitt, M., Aikin, K., Margitan, J., Loewenstein, M., Podolske, J., Weaver, A., Chan, K., Fast, H., and Elkins, J.: Ozone loss inside the northern polar vortex during the 1991–1992 winter, Science, 261, 1150–1154, 1993.
Rattigan, O., Lary, D., Jones, R., and Cox, R.: Uv-visible absorption cross sections of gaseous Br2O and HOBr, J. Geophys. Res., 101, 23 021–23 033, 1996.
Reber, C. A., Trevathan, C. E., Mcneal, R. J., and Luther, M. R.: The upper-atmosphere research satellite (UARS) mission, J. Geophys. Res. (Atmos.), 98, 10 643–10 647, 1993.
Richter, A., Wittrock, F., Eisinger, M., and Burrows, J. P.: Gome observations of tropospheric bro in northern hemispheric spring and summer 1997, Geophys. Res. Lett., 25, 2683–2686, 1998. Russell, J. M., Gordley, L. L., Park, J. H., Drayson, S. R., Hesketh,
W. D., Cicerone, R. J., Tuck, A. F., Frederick, J. E., Harries, J. E., and Crutzen, P. J.: The halogen occultation experiment, J. Geophys. Res. (Atmos.), 98, 10 777–10 797, 1993.
Russell, P. B. and McCormick, M. P.: SAGE-II aerosol data valida-tion and initial data use - an introducvalida-tion and overview, J. Geo-phys. Res. (Atmos.), 94, 8335–8338, 1989.
Sander, R. and Crutzen, P. J.: Model study indicating halogen ac-tivation and ozone destruction in polluted air masses transported to the sea, J. Geophys. Res. (Atmos.), 101, 9121–9138, 1996. Sander, R., Keene, W. C., Pszenny, A. A. P., Arimoto, R., Ayers,
G. P., Baboukas, E., Cainey, J. M., Crutzen, P. J., Duce, R. A., H¨onninger, G., Huebert, B. J., Maenhaut, W., Mihalopoulos, N., Turekian, V. C., and Van Dingenen, R.: Inorganic bromine in the marine boundary layer: a critical review, Atmos. Chem. Phys., 3, 1301–1336, 2003,
SRef-ID: 1680-7324/acp/2003-3-1301.
Santee, M. L., Manney, G. L., Froidevaux, L., Zurek, R. W., and
Waters, J. W.: MLS observations of ClO and HNO3in the 1996–
97 arctic polar vortex, Geophys. Res. Lett., 24, 2713–2716, 1997. Santee, M. L., Manney, G. L., Froidevaux, L., Read, W. G., and
Water, J. W.: Six years of UARS microwave limb sounder HNO3
observations: Seasonal, interhemispheric, and interannual varia-tions in the lower stratosphere, J. Geophys. Res. (Atmos.), 104, 8225–8246, 1999.
Schoeberl, M. and Lait, L.: Conservative-coordinate transforma-tions for atmospheric measurements, in Use of EOS for Studies of Atmospheric Physics, Vol. 115th course of the international school of physics Enrico Fermi, pp. 419–431, 1992.
Schoeberl, M. R., Lait, L. R., Newman, P. A., Martin, R. L., Proffitt, M. H., Hartmann, D. L., Loewenstein, M., Podolske, J., Strahan, S. E., Anderson, J., Chan, K. R., and Gary, B.: Reconstruction of the constituent distribution and trends in the antarctic polar vortex from er-2 flight observations, J. Geophys. Res. (Atmos.), 94, 16 815–16 845, 1989.
Thomason, L. W.: A diagnostic stratospheric aerosol size distri-bution inferred from SAGE-II measurements, J. Geophys. Res. (Atmos.), 96, 22 501–22 508, 1991.
Thomason, L. W.: Observations of a new SAGE-II aerosol extinc-tion mode following the erupextinc-tion of Mt. pinatubo, Geophys. Res. Lett., 19, 2179–2182, 1992.
Vogt, R., Crutzen, P. J., and Sander, R.: A mechanism for halo-gen release from sea-salt aerosol in the remote marine boundary layer, Nature, 383, 327–330, 1996.
von Glasow, R. and Crutzen, P. J.: Model study of multiphase DMS oxidation with a focus on halogens, Atmos. Chem. Phys., 4, 589– 608, 2004,
SRef-ID: 1680-7324/acp/2004-4-589.
von Glasow, R., von Kuhlmann, R., Lawrence, M. G., Platt, U., and Crutzen, P. J.: Impact of reactive bromine chemistry in the troposphere, Atmos. Chem. Phys., 4, 2481–2497, 2004,
SRef-ID: 1680-7324/acp/2004-4-2481.
Waters, J. W.: Atmospheric measurements by the MLS experi-ments: Results from UARS and plans for the future, in CIRA Part III Reference Atmospheres Trace Constituent Models -Comparison with Latest Data, vol. 21 of Advances in Space Re-search, pp. 1363–1372, Elsevier, 1998.
Wayne, R. P.: Chemistry of Atmospheres, Oxford University Press, second edn., 1991.
WMO, Scientific assessment of stratospheric ozone: 1985, Tech. Rep. 16, Global Ozone Res. and Monitor. Proj., Geneva, Switzer-land, 1986.
Wood, S. W., Bodeker, G. E., Boyd, I. S., Jones, N. B., Connor, B. J., Johnston, P. V., Matthews, W. A., Nichol, S. E., Murcray, F. J., Nakajima, H., and Sasano, Y.: Validation of version 5.20
ILAS HNO3, CH4, N2O, O3, and NO2using ground-based
mea-surements at Arrival Heights and Kiruna, J. Geophys. Res. (At-mos.), 107, 2002.