HAL Id: insu-02381520
https://hal-insu.archives-ouvertes.fr/insu-02381520
Submitted on 26 Nov 2019
HAL is a multi-disciplinary open access
archive for the deposit and dissemination of
sci-entific research documents, whether they are
pub-lished or not. The documents may come from
teaching and research institutions in France or
abroad, or from public or private research centers.
L’archive ouverte pluridisciplinaire HAL, est
destinée au dépôt et à la diffusion de documents
scientifiques de niveau recherche, publiés ou non,
émanant des établissements d’enseignement et de
recherche français ou étrangers, des laboratoires
publics ou privés.
long-term solute fluxes from active volcanic systems
Takahiro Hosono, Jens Hartmann, Pascale Louvat, Thorben Amann, Kirstin
Washington, A West, Koki Okamura, Michael Böttcher, Jérôme Gaillardet
To cite this version:
Takahiro Hosono, Jens Hartmann, Pascale Louvat, Thorben Amann, Kirstin Washington, et al..
Earthquake-induced structural deformations enhance long-term solute fluxes from active volcanic
sys-tems. Scientific Reports, Nature Publishing Group, 2018, 8, �10.1038/s41598-018-32735-1�.
�insu-02381520�
Earthquake-induced structural
deformations enhance long-term
solute fluxes from active volcanic
systems
Takahiro Hosono
1,2,3, Jens Hartmann
1,4, Pascale Louvat
3, Thorben Amann
4,
Kirstin E. Washington
5, A. Joshua West
5, Koki Okamura
2, Michael E. Böttcher
6&
Jérôme Gaillardet
3Evidence for relationships between seismotectonic activity and dissolved weathering fluxes remains limited. Motivated by the occurrence of new springs emerging after the 2016 Kumamoto earthquake and supported by historical groundwater data, this study focuses on the long-term effect of near-surface structural deformation on the contribution of deep, highly saline fluids to the solute fluxes from the Aso caldera, Kyushu, Japan. Available hydrologic and structural data suggest that concentrated, over-pressured groundwaters migrate to the surface when new hydraulic pathways open during seismic deformation. These new springs have a hydrochemical fingerprint (including δDH2O, δ18OH2O, δ7Li, δ11B,
δ18O
SO4, and δ34SSO4) indistinguishable from long-established confined groundwater that likely reflects
a mixture of infiltrated meteoric water with high-sulfate hydrothermal fluids. A comparison of historical hydrochemistry data and patterns of past seismicity suggests that discharge of deep fluids is associated with similar deformation structures to those observed during the Kumamoto earthquake, and that seismic activity plays an important role over historic timescales in delivering the majority of the solutes to the caldera outlet, sustaining fluxes that are amongst the world’s highest. This upwelling mechanism might be relevant for other systems too, and could contribute to the over-proportional share of active volcanic areas in global weathering fluxes.
Active volcanic areas contribute a disproportionately large component to the global flux of dissolved elements delivered from the land to the oceans, both in comparison to other lithologies1,2 and to inactive volcanic
sys-tems3. Several processes may cause enhanced solute fluxes from active volcanic areas, including the reaction of
ecosystem-recycled CO2 with relatively young fresh mineral material4–6, volcanic acid mediated rock alteration
in geothermal fields7–12, and deep, solute-rich crustal fluids released to the surface through crustal pathways13–16.
These processes have distinct implications for weathering budgets and particularly for the long-term global carbon cycle. However, the distribution, source, and discharge mechanism of deep fluids, and their impact on watershed hydrochemistry and long-term lateral weathering fluxes, are not well understood in the global context because of limited study opportunities. Earthquakes can trigger an increase in dissolved geochemical fluxes13–20
partly by opening new pathways for deep fluid discharge to the surface13–16. Even though active volcanism is
sometimes accompanied by seismotectonic processes that may systematically facilitate the release of solute-rich deep fluids21,22, the role of seismotectonic processes in sustaining the high apparent weathering fluxes from
vol-canic systems is not known.
1Priority Organization for Innovation and Excellence, Kumamoto University, 2-39-1 Kurokami, Kumamoto, 860-8555, Japan. 2Department of Earth and Environmental Science, Kumamoto University, 2-39-1 Kurokami, Kumamoto, 860-8555, Japan. 3Institut de Physique du Globe de Paris, Sorbonne Paris Cité, Univ Paris Diderot, UMR, 7154 CNRS, Paris, France. 4Institute for Geology, Universität Hamburg, Center for Earth System Research and Sustainability (CEN), Bundesstrasse 55, 20146, Hamburg, Germany. 5Department of Earth Sciences, University of Southern California, 3651 Trousdale Parkway, Los Angeles, CA, 90089, USA. 6Geochemistry & Isotope Biogeochemistry Group, Leibniz Institute for Baltic Sea Research (IOW), Seestrasse 15, D-18119, Warnemünde, Germany. Correspondence and requests for materials should be addressed to T.H. (email: [email protected])
Received: 11 April 2018 Accepted: 10 September 2018 Published: xx xx xxxx
Most of the surface land of the Kyushu Islands (36,750 km2), in the southern part of the Japanese volcanic arc,
is located within a highly active area with high weathering potential1,2. The Aso caldera watershed (Fig. 1) is a
hot-spot of weathering in this region6,23,24 and is also crossed by a major tectonic line in its northwestern plain (see
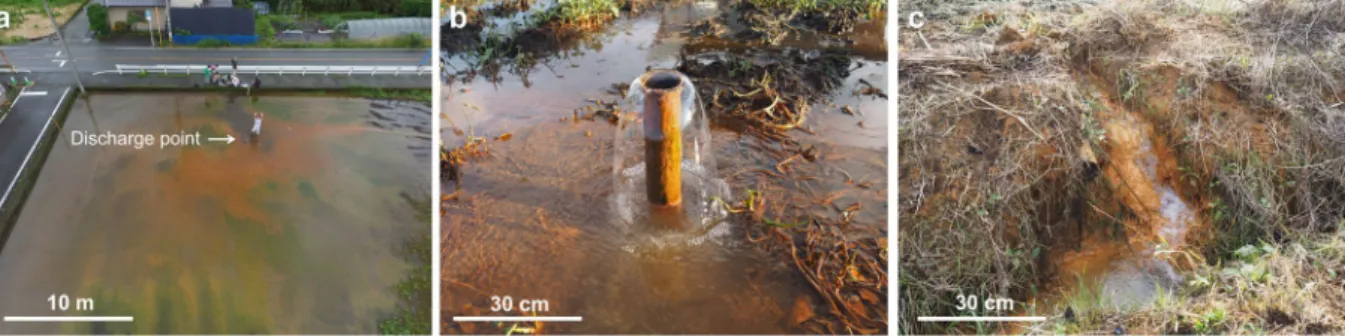
Methods). One of the curious hydrological phenomena after the 2016 Kumamoto earthquake (see Methods) was the appearance of new highly saline fluid discharging in this northwestern plain (Figs 1a and 2a,b, and Table 1), where the earthquake caused major surface ruptures (Fig. 1a,b). The release of solute rich water along these struc-tures raises the hypothesis that the combination of major tectonic and volcanic activities leads to locally elevated hydrochemical fluxes in the northwestern plain of the caldera. This study considers how such structures may sustain the high solute fluxes observed in this region, and thus contribute to the high apparent weathering fluxes from active volcanic systems.
Discharge mechanism and origin of the new spring
Compressional crustal strain and pressurized fluids affected by a heat source can drive co- to post-seismic upwelling of deep fluid through crustal ruptures14,25,26. In contrast, the new fluid source observed in the Aso
cal-dera (a high-salinity fluid after the earthquake, Figs 1a, 2a,b, and Table 1) appeared around an open graben-like structure in the surface sedimentary deposits of the northwestern plain27–29, and both cold and hot artesian Figure 1. Seismotectonic and hydrochemistry maps of Aso caldera watershed. Spatial distribution of (a)
sampling stations and dominant extensional fissures (black dots with arrows), and associated horizontal land sliding (black dotted line area) observed after the 2016 Kumamoto earthquake27–29, (b) earthquake epicenters
before (1923~: black circle) and after the 2016 main shock (red circle), and water hydrochemistry for (c) spring water and groundwater and (d) rivers based on data from 1968–1995 (Supplementary Table 1). Samples for volcano-hydrothermal fluids (labeled a–e in yellow circles of Fig. 1a; see Table 1 for details) and river waters (diamond, N1 to N5, S1 to S4 and M) in Fig. 1a correspond to the samples in Table 1 and Fig. 4, respectively. Locations of reported low resistivity zone31 for hypothesized melt finger in the deep crust (9.0–10.0 km in
depth) and magma chambers beneath central volcanoes (2.0–2.5 km in depth) are shown as yellow dotted line and red dotted line, respectively. Schematic cross section A-A’ is shown in Fig. 3. Major active faults of Futagawa-Hinagu fault systems are shown as red lines. The map was illustrated by using ArcGIS Desktop (Esri).
springs are observed in this region, suggesting heat-pressurization is not a key factor. Satellite radar interferome-try images27,28 and direct borehole observations confirm that northward horizontal sliding of the sediment block
(by more than 2 m) occurred during the 2016 Kumamoto earthquake just above a heated fluid reservoir at around 50 m depth29. Open fissures were formed predominantly along the eastern side of the slid block (see Fig. 1a for
their locations) and reached the depth of a local confined aquifer system that had previously developed in the uppermost sediment pile29. We propose that this aquifer is the likely source of discharging fluids, and that release
of these fluids to the surface was facilitated by the high permeability pathways that opened along the new fractures during the earthquake. Other similar new springs were also discovered in the same structural setting after the 2016 earthquake, although we sampled and analyzed only one.
In general, the confined groundwater hydraulic potential in the northwestern plain is higher than the ground surface level, as evidenced by the presence of natural cold springs (e.g., Kayahara, Fig. 2c and Table 1), arte-sian deep groundwater, and hot springs (Uchinomaki, Table 1), all observed for several decades in this region. This structural and hydrogeological context leads us to suggest that the observed new fluids discharging after the Kumamoto earthquake migrated towards the surface from the confined groundwater by pressure release30
through either visible (as opening fissure) or invisible (small structural weak and conduit) pathways (Fig. 3), a mechanism also responsible for pre-existing artesian wells.
Further evidence supporting a deep aquifer origin of the post-earthquake springs comes from the water chemistry. Compared with surface waters from the Aso caldera, the new fluid is characterized by lower sta-ble hydrogen and oxygen isotope ratios (δDH2O = −56.1‰ and δ18OH2O = −8.66‰, Table 1), similar to the
composition of confined groundwater at 50–200 m depth from the surface (−58‰ < δDH2O < −54‰ and
−9.0‰ < δ18O
H2O < −8.5‰)8,30. Moreover, the new spring water and similar highly saline water from springs
that pre-dated the earthquake (Kayahara) (Fig. 2) are characterized by low lithium and boron stable isotope ratios (δ7Li = 2.6‰ and δ11B = 1.4 to 2.6‰). These compositions are typical of volcano-hydrothermal fluids globally,
with low apparent fractionation often attributed to high temperatures of associated water-rock reaction9–11,15.
Together with high sulfate content and slightly elevated water temperature of the new spring (23.1 °C; Table 1
and Supplementary Table 1), these geochemical indicators are consistent with meteorically-derived groundwater admixed with deeper fluids of hydrothermal origin.
Figure 2. Pictures of highly saline fluid discharges in the northwestern plain area. (a) A wide view and
(b) close-up picture of highly saline spring water that appeared after the 2016 Kumamoto earthquake (corresponding to ‘a’, high saline fluid after the quake in Table 1 and Fig. 1a). (c) Picture of highly saline spring water pre-existed before the 2016 Kumamoto earthquake (corresponding to ‘b’, high saline fluid before the quake “Kayahara” in Table 1 and Fig. 1a).
Temp pH
TDS Alkalinity SO42− Cl− Ca2+ Li+ B δDH2O δ18OH2O δ7Li δ11B δ34SSO4 δ18OSO4
°C mmol l−1 mmol l−1 mmol l−1 mmol l−1 mmol l−1 μmol l−1 μmol l−1 ‰ ‰ ‰ ‰ ‰ ‰ a. Highly saline fluid after
the quake 23.1 6.7 30.9 0.52 11.50 3.95 3.89 18.2 58.4 −56.1 −8.66 2.6 2.6 17.5 13.5 b. Highly saline fluid before
the quake “Kayahara” 16.2 6.7 23.7 0.61 4.59 5.81 3.84 9.3 26.1 −54.2 −8.52 NA 1.4 10.5 9.8 c. Hot spring “Uchinomaki” 40.4 7.1 22.9 3.20 3.44 1.69 1.57 23.6 76.7 −53.8 −8.60 9.0 −2.8 17.5 12.8 d. Acidic stream 19.6 4.0 5.40 1.03 1.42 1.14 0.95 0.7 3.7 −44.0 −7.27 4.8 3.2 7.2 9.5 e. Geothermal water 40.0 2.7 7.29 ND 4.99 0.17 0.74 1.5 57.3 −53.6 −7.98 7.64 −2.4 2.6 −2.8 Table 1. A summary of hydrochemistry and isotope ratios of volcano-hydrothermal fluids within Aso caldera
watershed. See Fig. 1a for the location of samples a–e. TDS = [Alkalinity] + [SO42−] + [Cl−] + [NO3−] + [Na+] +
[K+] + [Ca2+] + [Mg2+]. ND: not determined. NA: not analyzed. The samples for three volcano hydrothermal
fluids (a. high saline fluid after the quake, b. high saline fluid before the quake “Kayahara”, and c. hot spring “Uchinomaki”) were collected in July 2016 after the 2016 Kumamoto earthquake (see Methods). Average data are shown for d. acid stream and e. geothermal water and complete dataset is supplied in Supplementary Table 2.
Source of highly concentrated hydrothermal fluids contributing to springs in the northwestern
plain.
Identifying the source of the deep hydrothermal contributions to the solute-rich springs is important for understanding the role of these fluids in the caldera system. The hydrothermal deep fluids are likely to orig-inate from a location near hot magma, with two probable candidates being the central volcanic cones, or melt pockets beneath the observed springs. Under the center of the volcanic cones, magma ascends from about 16 km depth toward the surface31. Contributions from the central magma chamber were suggested for groundwater withdeep flow paths using a δ13C
DIC tracer method8; although this has not been considered for the waters from the
northwestern plain specifically, similar waters could contribute to the springs in the region. Alternatively, a recent electrical resistivity survey31,32 suggests the presence of a localized melt finger deeper than 8 km beneath the area
seeping deep fluids in the northwestern plain (yellow dotted line in Fig. 1a). Extensional crustal structures along the Oita-Kumamoto Tectonic Line crossing the northwestern plain33 could allow hydrothermal fluids
originat-ing from near this melt foriginat-inger to ascend through crustal pathways and mix with upper surface aquifer systems (Fig. 3). A similar mechanism was found in southern Kyushu where fluid continued upwelling over geological time scales34.
Distinguishing between these two scenarios for the origin of the hydrothermal component in spring waters of the northwestern plain requires understanding the wider context of hydrochemistry across the Aso caldera. Historical hydrochemical monitoring in the region (1968–1995, see Methods) provides a picture of how sub-surface and sub-surface waters evolve geochemically along flow paths, and how this chemical evolution relates to magmatic, seismic, and tectonic activities (Fig. 1). In studied watersheds across the caldera, mainly two different water types can be distinguished in terms of major dissolved ion concentrations: Ca-HCO3 type and Ca-SO4 type
(Fig. 1c,d). The watersheds of the caldera rim areas, devoid of volcano-hydrothermal activity, are mainly of the Ca-HCO3 type. Contrastingly, those around the central mountain and lowland areas, including the northwestern
plain, have predominantly Ca-SO4 type waters with much higher total solute concentrations. Supply of acid from
high-temperature, SO2-rich magmatic gases to the subsurface water body can enhance rock alteration and
weath-ering, increasing sulfate concentrations of groundwater and adding substantial amounts of other rock-derived dissolved ions (this type of rock dissolution is described here as ‘magmatic S-mediated weathering’ and is dis-cussed in greater detail below). The elevation in concentrations due to this process is likely to be mediated by the distance from the heat sources (Fig. 1a), the availability of high-permeability flow pathways, and the potential to mix with percolated fresher surface water8.
The morphology and topography of the Aso caldera watersheds are characterized by symmetrical features between the northern and southern catchments, except for a slightly larger catchment area in the north, partly associated with the relatively flat plain (Fig. 1). The geology within the watersheds is approximately symmetric in terms of lithology and general stratigraphical features, although the central mountains consist of several com-plex volcanic cones of different compositions (see Methods). Similar patterns in groundwater flow dynamics and hydrochemistry have also been identified in the north and south30, and these are partly reflected in the
results from our study (Fig. 1c): subsurface waters recharged at the caldera rim and central mountains evolve to a Ca-HCO3 type, while Ca-SO4 type waters discharge into the plain areas, and are characterized by longer and
deeper flow paths especially in the case of the central part of the northern plain.
It has been argued that the moderately elevated concentrations of Ca-SO4 type subsurface waters in the central
to eastern part of the northern plain (Fig. 1c) are caused by the contribution of magmatic components originat-ing from under the central volcanoes via deep groundwater flow paths8,30. This scenario is consistent with their
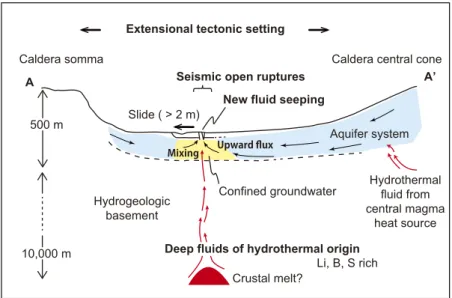
New fluid seeping Seismic open ruptures
Caldera somma Caldera central cone
A A’ Aquifer system Slide ( > 2 m) Confined groundwater Hydrogeologic basement 500 m 10,000 m Crustal melt?
Deep fluids of hydrothermal origin
Upward flux Mixing
Li, B, S rich Extensional tectonic setting
Hydrothermal fluid from central magma
heat source
Figure 3. Deep fluid discharge mechanism. Schematic illustration of confined groundwater (meteoric
water admixed with deep high-sulfate hydrothermal fluids) upwelling along gradients in hydraulic potential via surface ruptures (A-A’ section in Fig. 1a). The surface structural deformation and deeper melt source location are adapted from horizontal sliding model29 and electrical resistivity images31, respectively.
proximity to upwelling magmas under the central mountains (Fig. 1a)31. Similarly, hydrothermal inputs from
the central volcanoes are reflected in hydrochemical anomalies in the form of Ca-SO4 and Na-SO4 type waters
in southern catchments, most prominently south of a large geothermal field (site “e” in Fig. 1a), although these chemical features are more weakly expressed at the foot of the central mountains in the south compared to the north (Fig. 1c).
In comparison to these data from around the caldera, waters in the northwestern plain, where new springs were observed following the 2016 Kumamoto earthquake, stand out as chemically distinct. Historical hydro-chemical datasets in the vicinity of the new water sources (location “a” in Fig. 1a compared with Fig. 1c) suggest groundwaters with a stronger geochemical fingerprint of deep hydrothermal sources. These groundwaters are comparable in composition to the newly appeared spring that we have analyzed, with higher concentrations than reported anywhere else in the Aso caldera. Stable isotope analysis has revealed that groundwater flow pat-terns in this area are comparable to those in the central and eastern part of northern plain30, suggesting that
flow-path differences (e.g., preferential advection of fluids from the central cone due to stratigraphic or permea-bility controls) are unlikely to explain the distinct hydrochemistry on their own. In addition, the anomalous area in the northwestern plain is on average farther from the central volcano heat sources than the location of other groundwaters that have a hydrothermal imprint, yet the waters in the northwestern plain have higher solute con-centrations despite their greater distance (Fig. 1a). Together, this evidence suggests that additional heat sources outside of the central volcanic area are likely responsible for the hydrothermal contributions in the northwestern plain. As hypothesized based on an electrical resistivity survey31, a deep melt finger beneath this area (Fig. 1a,
yellow dashed line) might be the additional source for hydrothermal influences that could explain the observed geochemical anomaly in the spring and groundwaters32 (Fig. 3). The slightly elevated temperature of the new
observed spring (Fig. 1a, location “a”) and a hot water reservoir (40.4 °C; Uchinomaki, Table 1) at the level of the confined aquifer system (~50 m deep)29 support this scenario.
Spatiotemporal relationship between hydrochemistry and seismotectonic activity
The hydrochemical anomaly in the northwestern plain, attributed here to contribution from deep fluids, coincides with the locus of intense seismic deformation29, and the new springs that emerged after the Kumamoto
earth-quake suggest that seismicity facilitated the release of these fluids. The Aso-Kumamoto area, which is crossed by a major tectonic line including the Futagawa-Hinagu fault systems35,36, has repeatedly been hit by historically large
crustal earthquakes (>Mw 6.0), and this area has been exposed to continued extensional stress over geological
time33. The surface ruptures after the 2016 Kumamoto earthquake in the northwestern plain of the caldera27–29 are
located in the prolongation of these fault systems (Fig. 1b). In these structural regimes, similar crustal ruptures, including minor crustal deformations, occur with each seismic event (Fig. 1b). Indeed, evidence from rupturing marks in sedimentary deposits with known stratigraphical age in this part of the caldera28 suggests that co-seismic
deformation similar to that during the Kumamoto earthquake occurred repeatedly in this region, at least over the past 2,000 years. Therefore, water pathways similar to those observed after the 2016 event might have been formed during previous large earthquakes.
Spring water similar in composition to that emerging after the Kumamoto earthquake is also found at Kayahara (Figs 1a, 2c, and Table 1) and in several other tiny streams of high salinity water that were seeping even before the 2016 event. This observation implies that the structures facilitating discharge of the highly saline groundwaters may have been seismically initiated but are capable of maintaining long-term pathways for fluid escape. Based on our field observations, both the new spring and the previously recognized Kayahara spring have remained flowing since April 2016 and do not show any sign of weakening almost two years after the earthquake. This might continue in the future, unless clogs form within open rupture spaces and block the water pathways.
The surface ruptures observed in the northwestern plain after the Kumamoto earthquake reflect shallow deformation in the sedimentary pile28, extending deep enough to facilitate post-seismic escape of confined
groundwater29. Although there is no evidence that this region of the caldera experienced motion on a fault
sys-tem at greater depth in the crust28, the presence of the observed surface ruptures within an extensional tectonic
setting is expected to favor pathways for hydrothermal fluids to ascend from the deep crust towards the surface, where they mix with infiltrating meteoric waters to form the highly concentrated confined groundwater (Fig. 3). The occurrence of deep hydrothermal fluid emergence, including the new artesian springs triggered by the 2016 Kumamoto earthquake, in the same location as intense seismic activity suggests a long-term connection between active deformation and surface water chemistry (compare locations of reported structural deformation and past earthquakes in Fig. 1a and b with sulfate rich waters labeled in red in Fig. 1c and d). This leads to the hypothesis that seismically-induced release of deep fluids in an extensional tectonic setting affects the regional surface water system and thus weathering fluxes over the timescales of repeated earthquake events.
Deep fluid discharge fluxes
The importance of the seismically-induced solute fluxes from the northwestern plain, and the related influence of long-term release of deep fluids on lateral fluxes from the caldera, is documented by the hydrochemical contrasts between springs in this area, versus rivers upstream and downstream. Changes in sulfate concentrations along the northern main river are particularly pronounced (historical data from 1968–1995 in Figs 1 and 3a): from ca. 0.1 to 0.3 mmol l−1 in the upstream part of the catchment (monitoring stations N1 to N3), sulfate concentration
sharply increases to ca. 1.0 mmol l−1 around the monitoring stations N4 and N5 (near to the spring inputs), and
then decrease (ca. 0.5 mmol l−1) towards the outlet of the caldera. Multi-isotope data from 2014–2015 sampling
campaigns allow for additional fingerprinting of the seeping deep fluids (Fig. 4). Elevated δ18O
SO4 traces deep fluid
contribution in the surface river water system (Fig. 4a) more efficiently than δ34S
SO4, which is sensitive to redox
processes such as pyrite oxidation37,38. δ18O
consistent with a deep groundwater source of the sulfate. Moreover, it is clear from the δ18O
SO4 that the solute flux
from the deep fluid seeping area leaves an imprint on the caldera outlet (station M, Ca-SO4 type signature), where
a high value of 9.3‰ was recorded.
Isotope ratios of dissolved Li and B in the hydrothermal springs in the central part, and especially in the highly saline springs of the northwestern plain, were among the lowest of all studied waters in the caldera (2.6‰ for δ7Li
and 1.4 to 2.6‰ for δ11B, respectively, Table 1). These values are consistent with the global pattern of δ7Li and
δ11B in volcanic hydrothermal waters9–11,15. A strong impact of deep fluid seeping in the northwestern area of the
caldera is also evidenced by increasing lithium and boron concentrations in tandem with decreasing δ7Li and δ11B
along the northern Aso river flow-path (Fig. 4b,c). River waters flowing through the northwestern plain area mix with these deep fluid spring waters and transfer their isotopic signature downstream, to the outlet of the caldera. A similar effect of hydrothermal water inputs, influenced by the central magma sources and by the southwest-ern geothermal field (Fig. 1a location “e”), is corroborated by boron concentration changes around monitoring stations S3 and S4 (Fig. 4c), although this relationship is much weaker for lithium concentrations, δ7Li, and δ11B.
Despite mixing with waters from sources throughout the caldera, river waters at the outlet of the system preserve the isotopic signature of deep fluids as reflected in the low δ7Li and δ11B.
SO 4 2- (mmol l -1) δ18 O SO 4 (‰) M N1 N2 N3 N4 N5 S4 S3 S2 S1 0 4 5 6 7 8 0 2 4 6 8 10 B (μmol l -1) δ11 B (‰) 0 0.8 1.0 1.2 1.4 1.6 1.8 9 10 11 12 Li (μmol l -1) δ7 Li (‰) South North Outlet Flow Flow 13 14
b
c
a
0 0.2 0.4 0.6 0.8 1.2 5 6 9 10 8 7 Deep fluid seeping 0.2 0.4 0.6 1 2 3 1.0Figure 4. Impact of deep fluid seeping on Aso caldera’s hydrochemistry. (a) δ18O
SO4 and [SO42−], (b) δ7Li and
[Li], and (c) δ11B and [B] evolution along the flow-path of the northern (N1 to N5) and southern (S1 to S4)
Aso rivers and at the outlet of the caldera (M). See Fig. 1a for the sampling locations. The yellow band between sample locations N4 and N5 represents the northeastern area of the caldera where seeping of deep fluids occurs.
To estimate the quantitative contribution of the deep fluids to the river fluxes from the caldera, a binary hydro-chemical mixing model was applied using river data from upstream and downstream of the area of enhanced deep fluid discharge (see Methods and Supplementary Table 3). Applying the relatively conservative sulfate concentra-tions as a discrimination variable, about 3.2 to 4.1% of the water flux at the caldera outlet derives from the deep fluid seeping area. The mixing proportion varies according to the element concentration or isotopic ratio used (Supplementary Table 3), but regardless of which tracer is used, it is estimated that likely not more than 6% of the river water derives from deeper sources. Although the contribution to the water flux is small, the high solute concentrations in the deep fluids mean that these supply a substantial proportion of the total dissolved element fluxes at the caldera outlet (Supplementary Table 4): SO42− (56%) > Mg2+ (42%), Cl− (41%), Na+ (40%) > K+
(26%), and Ca2+ (24%). Except for SiO
2, HCO3−, and NO3−, the deep saline waters discharging in the
northwest-ern plain deliver the majority of major dissolved ions to the river outlet (station M) even though their share of the water flux is <6% (Supplementary Table 3). The substantial contribution of the deeply-sourced spring waters to solute fluxes at the caldera outlet provides evidence for the impact of hydrothermal deep fluids on the regional hydrochemistry of an active volcanic system. We lack information about discharge rates of individual springs to confirm whether the total amount of deep fluid contribution increased after the earthquake, or hydrochemical data from the caldera outlet after the Kumamoto earthquake to assess whether there was an increase in total solute flux out of the system following this event. However, the deep fluids that are the dominant solute sources in the caldera emerge in an area of continuous seismic-induced deformation (Fig. 1, as discussed above), suggesting a seismotectonic influence on their release and thus on the overall solute budget of this system.
Extent and implications of volcanic sulfur mediated weathering
A notable feature of the fluid chemistry of the deeply-sourced springs in the Aso caldera is the dominance of sulfate in the anion budget, accounting for 84% of the anion charge in northwestern plain springs (Table 1) and 53% in river water at the outlet of the caldera (n = 20, 1977–1995; Supplementary Table 1d). The annual average dissolved sulfur flux from the caldera watershed is estimated to be 1.7 × 10⁴ t S y−1 based on runoff weighted fluxes during 1981–1995
(http://www1.river.go.jp/). This dissolved flux is 4 to 36% of the annual average SO2 flux emitted out of the Aso
vol-cano between 2007 and 2017 (4.6 × 10⁴ to 3.9 × 10⁵ t S y−1; http://www.data.jma.go.jp/svd/vois/data/fukuoka/rovdm/ Asosan_rovdm/gas/gas.html), showing the relevance of hydrothermal sulfur fluxes at the scale of this volcanic system. Stable isotopes in dissolved sulfate help to shed additional light on sulfur sources and transformations39–41.
The S isotope composition of the sulfate from stream and spring samples (acidic stream and geothermal water in Table 1) located at the southeastern and northeastern side of the central caldera volcano exhibit δ34S
SO4 of 7.2‰
and 2.6‰ (Fig. 1a and Table 1), respectively, within the typical ranges of volcanic rocks in Aso42, sulfate minerals
and geothermal waters in some volcanic fields12,41,43, and volcano-hydrothermal fluids globally44. In contrast, the
highly saline springs in the northwestern plain, including the Kayahara spring that pre-dated the 2016 earthquake and the spring we sampled that appeared after, are characterized by clearly higher δ34S
SO4 (10.5‰ and 17.5‰)
and δ18O
SO4 (9.8‰ and 13.5‰), respectively (Fig. 1a and Table 1), with low dissolved oxygen (<2.0 mg l−1) and
negative oxidation potential values. The high δ34S
SO4 and δ18OSO4 values indicate the possibilities of either
incor-poration of water from a reducing environment where sulfate reduction and/or disproportionation can occur in a deep aquifer41,45,46, or sourcing of sulfate from disproportionation of magma derived SO
2 in hydrothermal fluids47.
Other acids of magmatic origin, such as hydrochloric and carbonic acids, could also be important solute sources in the caldera7,8. The co-variation of SO
42− and Cl− concentrations in hydrothermal fluids (Supplementary
Table 1a) is a first order indication of the importance of hydrochloric acid, but Cl− has an average charge
equiv-alent ratio relative to sulfate of only 1/5 in the Aso spring waters. The magmatic CO2 contribution previously
identified for the Aso caldera watershed8 seems proportionally negligible in the northwestern plain area, based
on the low δ13C
DIC compositions of −11.3‰ to −10.9‰ at the river water sampling stations N4 and N5 relative to
typical magmatic value of ca. −5‰ within Aso caldera watershed8 (though degassing may induce isotopic
frac-tionation of river water DIC), and on the very low alkalinity contribution to the ion charge balance among major dissolved anions for spring- and ground-waters (Supplementary Table 2 and Fig. 1c). Thus, while magmatic CO2
may be important elsewhere in the Aso system, it appears to have a minor impact on geochemical fluxes from the northwestern plain, when compared to the sulfur contributions. NO3− concentrations, part of which are of
anthropogenic origin45,48, were under detection limit (<0.001 mmol l−1) for the highly saline spring water and
were also very low for river systems in the Aso watershed (Supplementary Table 2).
The anion sources have important implications for the overall output of dissolved elements that leave the cal-dera catchment, and for inferences concerning the carbon cycle. According to the anion-cation charge balance, and because dissolved sulfate is predominantly of magmatic origin, more than half of the total cation equivalents delivered at the outlet of the caldera might be attributed to magmatic S-mediated weathering. Thus, we conclude that the primary driver of weathering and solute generation in this region is associated with magmatically-derived sulfur rather than CO2. Weathering driven by CO2 that is derived from the atmosphere and cycled through the
ecosystem, for example in soils or shallow groundwaters, produces net alkalinity that effectively draws down atmospheric CO249,50. Similarly, rock alteration with magmatic CO2 sources neutralizes this CO2, inhibiting its
release to the atmosphere. In contrast, the volcanic S-mediated weathering that dominates in the Aso caldera sys-tem is not directly associated with CO2 sequestration. Thus, the apparent high weathering rates inferred for this
system from solute fluxes may not directly represent the extent of CO2 consumption.
Conclusions and implications for global weathering fluxes
Based on historical data from the Aso caldera river water at the outlet, the discharge weighted average total dissolved solid load (TDS) is 235 mg l−1 resulting in a total solute yield of 458 t km−2 y−1 (Supplementary Table 1d). Similarly,
the yield of dissolved Na+ + K+ + Ca2+ + Mg2+ + SiO
2 from the caldera is estimated to be 205 t km−2 y−1.
the world’s highest weathering fluxes53–56. We have shown that a majority of the solute flux from the Aso caldera
derives from deep fluids that discharge from groundwater aquifers in the northwestern plain, despite its small area (approximately 25 km2) that comprises less than 7% of the total catchment area of 380 km2. The release of
these fluids, and the resulting long-lived hydrochemical anomaly in this region, is associated with the surface rupture system crossing this part of the caldera. The springs that emerged after the Kumamoto earthquake reveal how seismic activity along the tectonic line can open up pathways for fluid escape from the deep subsurface, illus-trating how the seismotectonics of this region contribute to the high total solute flux out of the caldera system.
Long-lived hydrochemical anomalies have been documented around the world in active volcanic areas (e.g., Kawah Ijen, Indonesia; Poás volcano, Costa Rica; and Copahue volcano, Argentina), with riverine fluxes of sol-utes in these locations predominantly derived from point sources in calderas even without seismically facilitated mobilization of deeply derived fluid57–60. Nonetheless, we propose that seismotectonically-enhanced local
anoma-lies might exist in some settings comparable to Aso, and might, as shown here, significantly increase the dissolved load fluxes delivered from the land surface to the oceans. If such settings could be mapped globally, and their relative contribution to elevated fluxes described by scaling laws, the global relevance of seismically-mobilized deep fluid sources of dissolved elements to the ocean could be estimated. The present study demonstrates that earthquakes can open preferential flow-paths capable of releasing deep hydrothermal fluids in active volcanic areas, and we suggest that this effect might explain in part the widely recognized disproportionate contribution of active volcanic areas to weathering fluxes at the global scale1–5. The extent to which these deep fluids are
asso-ciated with S-mediated versus CO2-mediated weathering reactions will have important implications for the role
of these volcanic areas in the global carbon cycle.
Methods
Methods, including statements of data availability and any associated accession codes and references, are available as supplementary material.
Outline of the study area.
The Aso caldera is situated within the Oita-Kumamoto Tectonic Line35,61,62, oneof the major tectonic lines in Japan with NE-SW orientation, consisting of the three active strike-slip fault systems Hinagu, Futagawa, and Imahata. The Aso caldera watershed is on the eastern extension of the Hinagu-Futagawa fault systems (Fig. 1). Tectonically, this area has been subject to an extensional stress field63–65. The average
hori-zontal slip rate for the fault system has been estimated to be 0.88 mm y−1 over the late Quaternary period36.
In 2016 the destructive inland Kumamoto earthquake started by a large foreshock of Mw 6.2 on April
14th, followed by the main shock of M
w 7.0 on April 16th (http://www.jma.go.jp/jma/en/2016_Kumamoto_ Earthquake/2016_Kumamoto_Earthquake.html). It was the largest earthquake in Kyushu induced by the Hinagu-Futagawa faults activities since 1885, when observation records started33. The active Hinagu-Futagawa
faults system is located in the southwest of the Aso caldera and extends eastwards directly through the northwest-ern part of Aso caldera, in the northnorthwest-ern river “Kurokawa” catchment (Fig. 1). The surface ruptures and land slips happened in the northwestern plain area, along this tectonic line29,66–71. No reverse faults have been observed, and
all fault ruptures confirmed in the field are strike-slip or normal faults33.
The surface geology of the study area consists of Quaternary volcanic rocks72–79 of various compositions,
from basalts to rhyolites72,75,79–84, and sedimentary deposits. A total of 27 volcanic cones are recognized in the
caldera central mountains, of which Naka-dake is the only active crater where volcanic gas monitoring station is installed (http://www.jma.go.jp/jma/indexe.html, http://www.data.jma.go.jp/svd/vois/data/fukuoka/rovdm/ Asosan_rovdm/gas/gas.html).
The Aso caldera watershed (380 km2) is developed within a large caldera topology (25 km × 18 km). The
ring-shape caldera somma ridge (highest peak: 1,154 m) forms the watershed divide. The central volcanic moun-tains (highest peak: 1,592 m) are situated in the central part of the caldera (Fig. 1) and active volcanic fumaroles (Naka-dake) are present in the central crater. Both caldera somma and central mountains are the main water recharge areas of the watershed. The watershed can be divided into two sub-watershed systems: the Kurokawa (means “black river” in Japanese) catchment in the north and the Shirakawa (means “white river”) catchment in the south. These two rivers flow westward along a topographical gradient, meeting each other at the western end-point, and flow out of the caldera immediately after the confluence (Fig. 1). River discharge rates have been mon-itored at two gauging stations, one on the downstream reaches of the Shirakawa river (southern river) and the other at the caldera outlet just after Shirakawa and Kurokawa (northern river) confluence (river sampling station M, http://www1.river.go.jp/), with average annual (1996–2016) water fluxes of 0.34 and 0.74 km3 y−1, respectively.
The climate of the study area is categorized as warm and humid, influenced by the Asian monsoon and shows four distinct seasons (http://www.data.jma.go.jp/gmd/cpd/longfcst/en/tourist.html). The annual average precipi-tation in the Aso area is 2,832 mm y−1 with an average temperature of 12.9 °C (1981–2010; https://weather.time-j. net/Climate/Chart/asootohime). The rainy season (June – July) accounts for ~40% of the total annual precipitation.
Historical hydrochemistry data sources.
For the basic hydrochemistry within the watershed (Fig. 1c,d) we used major ion (Na+, K+, Ca2+, Mg2+, Cl−, HCO3−, SO42−, and NO3−) concentration data published in a
Japanese article85 and reports of the Bunsei University86,87, which are the most comprehensive archives,
geograph-ically and temporally, for this area (Supplementary Table 1 and Supplementary Fig. 1 for its location). Average concentrations were used to illustrate the general hydrochemistry in a Stiff diagram style in Fig. 1c and Fig. 1d
maps88. For spring- and ground-waters (Fig. 1c) we combined two datasets: one is a single sampling survey during
1968–1969 (ref.85; Supplementary Table 1a) and the other is from multiple sample monitoring between 1977 and
1995, with up to 20 measurements at the same location in different seasons (Supplementary Table 1b,c)86. For the
river water data, we used a database of multiple samples collected between 1977 and 1995 (ref.87; Supplementary
elemental ratios are relatively invariant with time in the datasets, but concentrations change with discharge, due to rainwater dilution effects, especially for the river water samples87.
New data sources.
Concentrations and isotope data for river (in Fig. 4) and hydrothermal waters (in Table 1) are from samples collected during five sampling campaigns in different seasons: Mar-April 2014, September-October 2014, May 2015, June-July 2015, and July 2016. At some sites, samples were not collected during all of the field campaigns. Some seasonal changes in hydrochemistry and isotope ratios are expected due to rainwater dilution, but the source characteristics and the type of hydrochemistry along the river flow path remained the same regardless of the sampling season, as confirmed from the longer time series datasets (see above). Therefore, for acid streams and geothermal water, average values are given in Table 1 and plotted in Fig. 4, and all measured values are provided in Supplementary Table 2. Detailed spatiotemporal changes in isotope compositions will be discussed in separate papers. The samples from three volcanic-hydrothermal fluids (Table 1) were each collected once after the main shock of the 2016 Kumamoto earthquake (16 April 2016), on 3 July 2016 (highly saline fluid that emerged after the quake and hot spring “Uchinomaki”) and on 28 July 2016 (highly saline fluid that also existed before the quake, “Kayahara”). For these samples, the values provided in Table 1 are those measured at these single sampling times.Binary mixing calculations.
Using equations (1) and (2) below, we calculated the mass fraction of deep fluid (f) in the river draining the northwestern plain area, based on the concentrations and isotope ratios of selected dissolved species (E) in the two mixing components, deep fluid and upstream river water from stations N2 and N3:= ⋅ + ⋅ −
EX ED f EUS (1 f) (1)
and
δEX=δED⋅( / )E ED X ⋅ +f δEUS⋅(E EUS X/ ) (1 )⋅ –f (2) where EX, ED, EUS, δEX, δED, and δEUS are the concentrations and isotope ratios for mixed river water (X), deep
fluid (D), and upstream river water (US), respectively. f is a variable parameter, identified from the best fit between calculated EX and δEX and observed concentrations and isotope ratios for downstream river water from stations
N4 and N5 (Supplementary Table 3).
Analytical procedures.
Water samples were filtered in the field through cellulose acetate filters at 0.2 or 0.45 μm pore diameter, stored in polypropylene bottles, and preserved in dark and cooled containers at a temperature around 5 °C. Samples were acidified to pH 2 with ultra-pure nitric acid, except for the vials dedicated to anion analyses. The alkalinity was measured by automated Metrohm titration system. The Na+, K+, Ca2+, Mg2+, Cl−,SO42−, and NO3− concentrations were analyzed by ion chromatography at Hamburg University and Kumamoto
University (Compact IC 761, Metrohm, Switzerland). The Li+ and B concentrations were analyzed by ICP-MS in
Kumamoto University (NexION 300, Perkin-Elmer Co., Ltd, USA) and Institut de Physique du Globe de Paris (IPGP) (Agilent7900, Agilent Technologies, USA). Hydrogen and oxygen isotope ratios of water were determined by Laser-CRDS using a Picarro L2140i at the Leibniz IOW89 or continuous-flow gas-ratio mass spectrometer at
the Kumamoto University (Delta V Advantage, Thermo Fisher Scientific, USA). The analytical precision of the water isotope measurements was better than < ±0.05‰ and < ±0.5‰, respectively. The carbon isotope ratios of dissolved inorganic carbon were analyzed at the Leibniz IOW using a Thermo Gasbench II coupled to a Thermo Finnigan MAT 253 gas mass spectrometer via a Thermo Conflo IV split interface as reported previously90, with
a precision better than ± 0.1‰. The stable sulfur isotope ratio of sulfate was determined by continuous-flow gas isotope-ratio mass spectrometry (Delta V Advantage, Thermo Fisher Scientific, USA) coupled with an elemental analyzer (Flash 2000, Thermo Fisher Scientific, USA) at the Kumamoto University, following the methods pre-viously developed46,91. The analytical precision was better than ± 0.2‰ during the analytical session. The
oxy-gen stable isotope ratio of sulfate was determined by the same mass spectrometer (Delta V Advantage, Thermo Fisher Scientific, USA) coupled with a high temperature conversion elemental analyzer (TC/EA, Thermo Fisher Scientific, USA) at the Kumamoto University. The precision was estimated to be better than ± 0.3‰ based on repeated measurement of working standards. Lithium isotopic analysis was performed by MC-ICP-MS (Neptune, Thermo Scientific, USA) at Caltech, with analytical precision ± 0.80‰ (ref.92). Boron isotope ratios were
deter-mined by MC-ICP-MS (Neptune, Thermo Scientific, USA) at IPGP with analytical precision of < ±0.25‰ (refs93,94). All isotope ratios were expressed in delta-notation (δ) in per mill unit (‰) with respect to international
standards: Vienna Standard Mean Ocean Water for δD and δ18O, L-SVEC for δ7Li, NIST SRM 951 for δ11B, Vienna
Peedee Belemnite for δ13C, and Vienna Canyon Diablo Troilite for δ34S, respectively.
References
1. Dürr, H. H., Meybeck, M., Hartmann, J., Laruelle, G. G. & Roubeix, V. Global spatial distribution of natural riverine silica inputs to the coastal zone. Biogeosci. 8, 597–620 (2011).
2. Hartmann, J., Moosdorf, N., Lauerwald, R., Hinderer, M. & West, A. J. Global chemical weathering and associated P-release - the role of lithology, temperature and soil properties. Chem. Geol. 363, 145–163 (2014).
3. Li, G. et al. Temperature dependence of basalt weathering. Earth Planet. Sci. Lett. 443, 59–69 (2016).
4. Gaillardet, J., Dupré, B., Louvat, P. & Allègre, C. J. Global silicate weathering and CO2 consumption rates deduced from the
chemistry of large rivers. Chem. Geol. 159, 3–30 (1999).
5. Dessert, C., Dupré, B., Gaillardet, J., François, L. M. & Allègre, C. J. Basalt weathering laws and the impact of basalt weathering on the global carbon cycle. Chem. Geol. 202, 257–273 (2003).
6. Hartmann, J. et al. Predicting riverine dissolved silica fluxes to coastal zones from a hyperactive region and analysis of their first-order controls. Int. J. Earth Sci. 99, 207–230 (2010).
7. Dessert, C., Gaillardet, J., Dupre, B., Schott, J. & Pokrovsky, O. S. Fluxes of high- versus low-temperature water–rock interactions in aerial volcanic areas: Example from the Kamchatka Peninsula, Russia. Geochim. Cosmochimi. Acta 73, 148–169 (2009).
8. Yamada, M. et al. Mixing of magmatic CO2 into volcano groundwater flow at Aso volcanic assessed combining carbon and water
stable isotopes. Geochem. Explor. 108, 81–87 (2011).
9. Millot, R., Hegan, A. & Négrel, P. Geothermal waters from the Taupo Volcanic Zone, New Zealand: Li, B and Sr isotopes characterization. Appl. Geochem. 27, 677–688 (2012).
10. Henchiri, S. et al. The influence of hydrothermal activity on the Li isotopic signature of rivers draining volcanic areas. Procedia Earth Planet. Sci. 10, 223–230 (2014).
11. Louvat, P., Gayer, E. & Gaillardet, J. Boron behavior in the rivers of Réunion Island, inferred from boron isotope ratios and concentrations of major and trace elements. Procedia Earth Planet. Sci. 10, 231–237 (2014).
12. Woitischek, J. et al. Evolution of hydrothermal waters at São Miguel (Azores) inferred by chemical and isotopic composition. J. Volc. Geoth. Res. 346, 104–117 (2017).
13. Tsunogai, U. & Wakita, H. Precursory chemical changes in ground water: Kobe earthquake, Japan. Science 269, 61–63 (1995). 14. Wang, C. Y., Dreger, D., Manga, M. & Wong, A. Streamflow increase due to rupturing of hydrothermal reservoirs: evidence from the
2003 San Simeon, California, earthquake. Geophys. Res. Lett. 31, L10502 (2004).
15. Nishio, Y., Okamura, K., Tanimizu, M., Ishikawa, T. & Sano, Y. Lithium and strontium isotopic systematics of waters around Ontake volcano, Japan: Implications for deep-seated fluids and earthquake swarms. Earth Planet. Sci. Lett. 297, 567–576 (2010).
16. Okuyama, Y., Funatsu, T., Fujii, T., Takamoto, N. & Tosha, T. Mid-crustal fluid related to the Matsushiro earthquake swarm (1965–1967) in northern Central Japan: Geochemical reproduction. Tectonophysics 679, 61–72 (2016).
17. Claesson, L. et al. Hydrogeochemical changes before and after a major earthquake. Geology 32, 641–644 (2004).
18. Skelton, A. et al. Changes in groundwater chemistry before two consecutive earthquakes in Iceland. Nat. Geosci. 7, 752–756 (2014). 19. Barberio, M. D., Barbieri, M., Billi, A., Doglioni, C. & Petitta, M. Hydrogeochemical changes before and during the 2016
AmatriceNorcia seismic sequence (central Italy). Sci. Rep. 7, 11735, https://doi.org/10.1038/s41598-017-11990-8 (2017). 20. Jin, Z. et al. Seismically enhanced solute fluxes in the Yangtze River headwaters following the A.D. 2008 Wenchuan earthquake.
Geology 44, 47–50 (2016).
21. Biagi, P. F. et al. Co-postseismic hydrogeochemical anomalies in a volcanic environment. Nat. Hazard Earth Sys. 3, 263–267 (2003). 22. Hartmann, J. Long-term seismotectonic influence on the hydrochemical composition of a spring located at Koryaksky-Volcano,
Kamchatka: deduced from aggregated earthquake information. Int. J. Earth Sci. 95, 649–664 (2006).
23. Hartmann, J. Bicarbonate-fluxes and CO2-consumption by chemical weathering on the Japanese Archipelago - Application of a
multi-lithological model framework. Chem. Geol. 265, 237–271 (2009).
24. Hartmann, J. & Moosdorf, N. Chemical weathering rates of silicate-dominated lithological classes and associated liberation rates of phosphorus on the Japanese Archipelago-Implications for global scale analysis. Chem. Geol. 287, 125–157 (2011).
25. Muir-Wood, R. & King, G. C. P. Hydrological signatures of earthquake strain. J. Geophys. Res. 98, 22035–22068 (1993).
26. Sibson, R. H. & Rowland, J. V. Stress, fluid pressure and structural permeability in seismogenic crust, North Island, New Zealand. Geophys. J. Int. 154, 584–594 (2003).
27. Fujiwara, S. et al. Small-displacement linear surface ruptures of the 2016 Kumamoto earthquake sequence detected by ALOS-2 SAR interferometry. Earth Planets Space 68, 160, https://doi.org/10.1186/s40623-016-0534-x (2016).
28. Fujiwara, S., Morishita, Y., Nakano, T., Kobayashi, T. & Yarai, H. Non-tectonic liquefaction-induced large surface displacements in the Aso Valley, Japan, caused by the 2016 Kumamoto earthquake, revealed by ALOS-2 SAR. Earth Planet. Sci. Lett. 474, 457–465 (2017).
29. Tsuji, T., Ishibashi, J., Ishitsuka, K. & Kamata, R. Horizontal sliding of kilometer-scale hot spring area during the 2016 Kumamoto earthquake. Sci. Rep. 7, 42947, https://doi.org/10.1038/srep42947 (2017).
30. Kagabu, M., Shimada, J., Shimano, Y., Higuchi, S. & Noda S. Groundwater flow system in Aso caldera. J. Japanese Assoc. Hydrol. Sci. 41, 1–17 (in Japanese) (2011).
31. Hata, M., Takakura, S., Matsushima, N., Hashimoto, T. & Utsugi, M. Crustal magma pathway beneath Aso caldera inferred from three-dimensional electrical resistivity structure. Geophys. Res. Lett. 43, 10720–10727 (2016).
32. Hata, M. et al. Three-dimensional electrical resistivity modeling to elucidate the crustal magma supply system beneath Aso caldera, Japan. J. Geophys. Res. Solid Earth., https://doi.org/10.1029/2018JB015951 (2018).
33. Yoshida, M. Re-evaluation of the regional tectonic stress fields and faulting regimes in central Kyushu, Japan, behind the 2016 Mw 7.0 Kumamoto Earthquake. Tectonophysics 712–713, 95–100 (2017).
34. Hosono, T. & Nakano, T. Pb-Sr isotopic evidence for contribution of deep crustal fluid of the Hishikari epithermal gold deposit, southwestern Japan. Earth Planet. Sci. Lett. 222, 61–69 (2004).
35. Kamata, H. & Kodama, K. Tectonics of an arc-arc junction: an example from Kyushu Island at the junction of the Southwest Japan Arc and the Ryukyu Arc. Tectonophysics 233, 69–81 (1994).
36. Tsutsumi, H. & Okada, A. Segmentation and Holocene surface faulting on the Median Tectonic Line, southwest Japan. J. Geophys. Res. 101, 5855–5871 (1996).
37. Taylor, B. E., Wheeler, M. C. & Nordstrom, D. K. Stable isotope geochemistry of acid mine drainage: experimental oxidation of pyrite. Geochim. Cosmochim. Acta 48, 2669–2678 (1984).
38. van Everdingen, R. O. & Krouse, H. R. Isotope composition of sulphates generated by bacterial and abiological oxidation. Nature 315, 395–396.
39. Tuttle, M. L. W., Breit, G. N. & Cozzarelli, I. M. Processes affecting δ34S and δ18O values of dissolved sulfate in alluvium along the
Canadian River, central Oklahoma, USA. Chem. Geol. 265, 455467 (2009).
40. Otero, N., Soler, A. & Canals, À. Controls of δ34S and δ18O in dissolved sulphate: learning from a detailed survey in the Llobregat
River (Spain). Appl. Geochem. 23, 1166–1185 (2008).
41. Hosono, T., Delinom, R., Nakano, T., Kagabu, M. & Shimada, J. Evolution model of δ34S and δ18O in dissolved sulfate in volcanic fan
aquifers from recharge to coastal zone and through the Jakarta urban area, Indonesia. Sci. Total Env. 409, 2541–2554 (2011). 42. Ueda, A. & Sakai, H. Sulfur isotope study of Quaternary volcanic rocks from the Japanese Islands Arc. Geochim. Cosmochim. Acta
48, 1837–1848 (1984).
43. John, D. A., Sisson, T. W., Breit, G. N., Rye, R. O. & Vallance, J. W. Characteristics, extent and origin of hydrothermal alteration at Mount Rainier Volcano, Cascades Arc, USA: Implications for debris-flow hazards and mineral deposits. J. Volcanol. Geoth. Res. 175, (289–314 (2008).
44. Marini, L., Moretti, R. & Accornero, M. Sulfur Isotopes in Magmatic-Hydrothermal Systems, Melts, and Magmas. Rev. Mineral.
Geochem. 73, 423–492, https://doi.org/10.2138/rmg.2011.73.14 (2011).
45. Hosono, T., Tokunaga, T., Tsushima, A. & Shimada, J. Combined use of δ13C, δ15N, and δ34S tracers to study anaerobic bacterial
processes in groundwater flow systems. Water Res. 54, 284–296 (2014).
46. Hosono, T. et al. Different isotopic evolutionary trends of δ34S and δ18O compositions of dissolved sulfate in an anaerobic deltaic
aquifer system. Appl. Geochem. 46, 30–42 (2014).
47. Kusakabe, M., Komoda, Y., Takano, B. & Abiko, T. Sulfur isotopic effects in the disproportionation reaction of sulfur dioxide in hydrothermal fluids: implications for the delta34S variations of dissolved bisulfate and elemental sulfur from active crater lakes. J.
48. Hosono, T. et al. The use of δ15N and δ18O tracers with an understanding of groundwater flow dynamics for evaluating the origins
and attenuation mechanisms of nitrate pollution. Water Res. 47, 2661–2675 (2013).
49. Ebelman, J. J. Sur les produits de la decomposition des especes minérales de la famille des silicates. Ann. des Mines 7, 3–66 (1845). 50. Urey, H. C. The Planets: Their Origin and Development. Yale Univ. Press, pp. 247 (1952).
51. Goldsmith, S. T. et al. Stream geochemistry, chemical weathering and CO2 consumption potential of andesitic terrains, Dominica,
Lesser Antilles. Geochim. Cosmochim. Acta 74, 85–103 (2010).
52. Jones, M. T. et al. The weathering and element fluxes from active volcanoes to the oceans: a Montserrat case study. Bull. Volcanol. 73, 207–222 (2011).
53. Rad, S. D., Allègre, C. J. & Louvat, P. Hidden erosion on volcanic islands. Earth Planet. Sci. Lett. 262, 109–124 (2007).
54. Goldsmith, S. T., Carey, A. E., Lyons, W. B. & Hicks, D. M. Geochemical fluxes and weathering of volcanic terrains on high standing islands: Taranaki and Manawatu-Wanganui regions of New Zealand. Geochim. Cosmochim. Acta 72, 2248–2267 (2008).
55. Schopka, H. H., Derry, L. A. & Arcilla, C. A. Chemical weathering, river geochemistry and atmospheric carbon fluxes from volcanic and ultramafic regions on Luzon Island, the Philippines. Geochim. Cosmochim. Acta 75, 978–1002 (2011).
56. Gaillardet, J. et al. Orography-driven chemical denudation in the Lesser Antilles: Evidence for a new feed-back mechanism stabilizing atmospheric CO2. Am. J. Science 311, 851–894 (2011).
57. Delmelle, P. & Bernard, A. Downstream composition changes of acidic volcanic waters discharged into the Banyupahit stream, Ijen caldera, Indonesia. J. Volcanol. Geotherm. Res. 97, 55–75 (2000).
58. van Hinsberg, V. et al. In Element flux to the environment of the passively degassing crater lake-hosting Kawah Ijen volcano, Indonesia, and implications for estimates of the global volcanic flux: Geochemistry and Geophysics of Active Volcanic Lakes (eds Ohba, T., Capaccioni, B. & Caudron, C.) 437, https://doi.org/10.1144/SP437.2 (Geological Society, London, Special Publications). 59. Rowe, G. L., Brantley, S. L., Fernandez, M. F., Barquero, J. & Borgia, A. Fluid-volcano interactions in an active stratovolcano: the
crater lake system at Poás volcano. J. Volcanol. Geotherm. Res. 49, 23–51 (1992).
60. Varekamp, J. C. The volcanic acidification of glacial Lake Caviahue, Province of Neuquen, Argentina. J. Volcanol. Geotherm. Res. 178, 184–196 (2008).
61. Miyazaki, K., Ozaki, M., Saito, M. & Toshimatsu, S. In The Kyushu-Ryukyu Arc: The Geology of Japan (eds Moreno, T., Wallis, S., Kojima, T. & Gibbons, W.) 139–174 (Geological Society, London, 2016).
62. Savage, M. K. et al. Stress, strain rate and anisotropy in Kyushu, Japan. Earth Planet. Sci. Lett. 439, 129–142, https://doi.org/10.1016/j. epsl.2016.01.005 (2016).
63. Heidbach, O. et al. The World Stress Map Database Release 2008. https://doi.org/10.1594/GFZ.WSM.Rel2008 (2008).
64. Heidbach, O., Mojtaba, R., Karsten, R., Moritz, Z. & WSM Team. World Stress Map Database Release 2016. GFZ Data Services,
https://doi.org/10.5880/WSM.2016.001 (2016).
65. Matsumoto, S. et al. Spatial heterogeneities in tectonic stress in Kyushu, Japan and their relation to a major shear zone. Earth Planets
Space 67, 172, https://doi.org/10.1186/s40623-015-0342-8 (2015).
66. Asano, K. & Iwata, T. Source rupture processes of the foreshock and mainshock in the 2016 Kumamoto earthquake sequence estimated from the kinematic waveform inversion of strong motion data. Earth Planets Space 68, 147, https://doi.org/10.1186/ s40623-016-0519-9 (2016).
67. Himematsu, Y. & Furuya, M. Fault source model for the 2016 Kumamoto earthquake sequence based on ALOS-2/PALSAR-2 pixel-offset data: evidence for dynamic slip partitioning. Earth Planets Space 68, 169, https://doi.org/10.1186/s40623-016-0545-7 (2016). 68. Ozawa, T., Fujita, E. & Ueda, H. Crustal deformation associated with the 2016 Kumamoto Earthquake and its effect on the magma
system of Aso volcano. Earth Planets Space 68, 186, https://doi.org/10.1186/s40623-016-0563-5 (2016).
69. Uchide, T. et al. The 2016 Kumamoto–Oita earthquake sequence: aftershock seismicity gap and dynamic triggering in volcanic areas.
Earth Planets Space 68, 180, https://doi.org/10.1186/s40623-016-0556-4 (2016).
70. Yagi, Y. et al. Rupture process of the 2016 Kumamoto earthquake in relation to the thermal structure around Aso volcano. Earth
Planets Space 68, 118, https://doi.org/10.1186/s40623-016-0492-3 (2016).
71. Yoshida, K., Miyakoshi, K., Somei, K. & Irikura, K. Source process of the 2016 Kumamoto earthquake (Mj7.3) inferred from kinematic inversion of strong-motion records. Earth Planets Space 69, 64, https://doi.org/10.1186/s40623-017-0649-8 (2017). 72. Ono, K. Geology of the eastern part of Aso caldera, central Kyushu, Japan. J. Geol. Soc. Japan 71, 541–553 (1965).
73. Kaneoka, I. & Ozima, M. On the radiometric ages of volcanic rocks from Japan. Bull. Volcanol. Soc. Japan 15, 10–21 (1970). 74. Ono, K. & Watanabe, K. Aso caldera. The Earth Monthly 5, 73–82 (1983).
75. Ono, K. & Watanabe, K. Geological map of Aso volcano (1:50,000). Geological Map of Volcanoes 4, Geological Survey of Japan (1985).
76. Kamata, H. Stratigraphy and eruption age of the volcanic rocks in the west of Miyanoharu area, Kumamoto prefecture—age and distribution of the volcanic activity of central-north Kyushu, Japan. J. Geol. Soc. Japan 91, 289–303 (1985).
77. Watanabe, K., Itaya, T., Ono, K. & Takada, H. K–Ar ages of dike rocks in the southwestern region of Aso caldera, Kyushu, Japan. Bull. Volcanol. Soc. Japan 34, 189–195 (1989).
78. Matsumoto, A., Uto, K., Ono, K. & Watanabe, K. K–Ar age determinations for Aso volcanic rocks-concordance with volcanostratigraphy and application to pyroclastic flows. Program. Abs. Volcanol. Soc. Japan 1991, 73 (1991).
79. Miyoshi et al. K–Ar ages determined for post-caldera volcanic products from Aso volcano, central Kyushu, Japan. J. Volcanol. Geotherm. Res. 229–230, 64–73 (2012).
80. Miyoshi et al. Lateral magma intrusion from a caldera-forming magma chamber: Constraints from geochronology and geochemistry of volcanic products from lateral cones around the Aso caldera, SW Japan. Chem. Geol. 352, 202–210 (2013). 81. Masuda, N., Watanabe, K. & Miyabuchi, Y. Rhyolite to dacite lava flows newly discovered on the western slope of Aso central cones,
southwestern Japan. Bull. Volcanol. Soc. Japan 49, 119–128 (2004).
82. Miyabuchi, Y., Masuda, N. & Watanabe, K. Geologic history of the western part of post-caldera central cones of Aso volcano, southwestern Japan, based on stratigraphic relationships between lava flows and air fall tephra layers. Bull. Volcanol. Soc. Japan 49, 267–282 (2004).
83. Miyoshi, M., Hasenaka, T. & Sano, T. Genetic relationship of the compositionally diverse magmas from Aso post-caldera volcanism. Bull. Volcanol. Soc. Japan 50, 269–283 (2005).
84. Miyoshi, M., Furukawa, K., Shinmura, T., Shimono, M. & Hasenaka, T. Petrography and whole-rock geochemistry of pre-Aso lavas from the caldera wall of Aso volcano, central Kyushu. J. Geol. Soc. Japan 115, 672–687 (2009).
85. Nagai, S., Taguchi, Y., Shimano, Y. & Tanaka, N. Hydrochemistry of the groundwater and river water within the Aso caldera watershed. J. Indust. Water 337, 10–21 (1986).
86. Shimano, Y. Hydrochemistry of the spring water within the Aso caldera watershed. Ann. Rep. Bunsei Univ. 8, 43–67 (1997). 87. Shimano, Y. Hydrochemistry of the river water within the Aso caldera watershed. Ann. Rep. Bunsei Univ. 10, 3–30 (1999). 88. Stiff, H. A. The interpretation of chemical water analysis by means of patterns. J. Petrol. Tech. 3, 15–16 (1951).
89. Böttcher, M. E. et al. Multi-isotope composition of freshwater sources for the southern North and Baltic Sea. Proc. 23rd SWIM conference, Husum, 46–49, ISBN 978-3-00-046061-6 (2014).
90. Winde, V. et al. Tidal and spatial variations of DI13C and aquatic chemistry in a temperate tidal basin during winter time. J. Mar Sys.
129, 396–404 (2014).
91. Hosono, T., Alvarez, K., Lin, I.-T. & Shimada, J. Nitrogen, carbon, and sulfur isotopic change during heterotrophic (Pseudomonas aerofaciens) and autotrophic (Thiobacillus denitrificans) denitrification reactions. J. Contam. Hydrol. 183, 72–81 (2015).
92. Dellinger, M. et al. The Li isotope composition of marine biogenic carbonates: Patterns and mechanisms. Geochim. Cosmochim. Acta 236, 315–335.
93. Louvat, P., Bouchez, J. & Paris, G. MC-ICP-MS isotope measurements with direct injection nebulization (d-DIHEN): optimization and application to boron in seawater and carbonate samples. Geostand. Geoanal. Res. 35, 75–88 (2010).
94. Louvat, P. et al. A fully automated direct injection nebulizer (d-DIHEN) for MC-ICP-MS isotope analysis: application to boron isotope ratio measurements. J. Anal. At. Spectrom. 29, 1698–1707 (2014).
Acknowledgements
T.H. thanks the JSPS Grant-in-Aid for Scientific Research B (17H01861) and SUNTORY Kumamoto groundwater research project for financial support. J.H. and T.A. were supported by the German Science Foundation DFG (Cluster of Excellence ‘CliSAP’, EXC177, Universität Hamburg) and thank Tom Jäppinen and Peggy Bartsch for technical assistance. Parts of this work were supported by IPGP multidisciplinary program PARI, and by Paris– IdF region SESAME Grant no. 12015908. Li isotope analyses were supported by ACS Petroleum Research Fund award 53418-DNI2, with thanks to the Adkins lab at Caltech for access to their instrumentation and assistance with analyses. This is IPGP contribution number 3947. M.E.B. was supported by Leibniz IOW and wishes to thank technical assistance by I. Schmiedinger.
Author Contributions
T.H. conceived the idea and wrote the manuscript; J.H. designed sampling and strategy of the study; T.H., J.H., and T.A. conducted the field work; P.L. and J.G. analyzed boron isotope ratios; K.W. and J.W. analyzed lithium isotope ratios; K.O. analyzed sulfur isotope ratios; M.E.B. analyzed hydrogen, carbon, and oxygen isotope ratios. All authors read and contributed to the manuscript.
Additional Information
Supplementary information accompanies this paper at https://doi.org/10.1038/s41598-018-32735-1.
Competing Interests: The authors declare no competing interests.
Publisher's note: Springer Nature remains neutral with regard to jurisdictional claims in published maps and
institutional affiliations.
Open Access This article is licensed under a Creative Commons Attribution 4.0 International
License, which permits use, sharing, adaptation, distribution and reproduction in any medium or format, as long as you give appropriate credit to the original author(s) and the source, provide a link to the Cre-ative Commons license, and indicate if changes were made. The images or other third party material in this article are included in the article’s Creative Commons license, unless indicated otherwise in a credit line to the material. If material is not included in the article’s Creative Commons license and your intended use is not per-mitted by statutory regulation or exceeds the perper-mitted use, you will need to obtain permission directly from the copyright holder. To view a copy of this license, visit http://creativecommons.org/licenses/by/4.0/.
![Figure 4. Impact of deep fluid seeping on Aso caldera’s hydrochemistry. (a) δ 18 O SO4 and [SO 4 2− ], (b) δ 7 Li and [Li], and (c) δ 11 B and [B] evolution along the flow-path of the northern (N1 to N5) and southern (S1 to S4) Aso rivers and at the o](https://thumb-eu.123doks.com/thumbv2/123doknet/14738183.575370/7.892.234.541.67.761/figure-impact-seeping-caldera-hydrochemistry-evolution-northern-southern.webp)
