HAL Id: inserm-00401390
https://www.hal.inserm.fr/inserm-00401390
Submitted on 25 Jan 2010
HAL is a multi-disciplinary open access
archive for the deposit and dissemination of
sci-entific research documents, whether they are
pub-lished or not. The documents may come from
teaching and research institutions in France or
abroad, or from public or private research centers.
L’archive ouverte pluridisciplinaire HAL, est
destinée au dépôt et à la diffusion de documents
scientifiques de niveau recherche, publiés ou non,
émanant des établissements d’enseignement et de
recherche français ou étrangers, des laboratoires
publics ou privés.
plasma cells.
Dirk Hose, Jérôme Moreaux, Tobias Meissner, Anja Seckinger, Hartmut
Goldschmidt, Axel Benner, Karene Mahtouk, Jens Hillengass, Thierry Rème,
John de Vos, et al.
To cite this version:
Dirk Hose, Jérôme Moreaux, Tobias Meissner, Anja Seckinger, Hartmut Goldschmidt, et al.. Induction
of angiogenesis by normal and malignant plasma cells.. Blood, American Society of Hematology, 2009,
114, pp.128-143. �10.1182/blood-2008-10-184226�. �inserm-00401390�
Induction of angiogenesis by normal and malignant plasma cells
Dirk Hose,1,2Je´roˆme Moreaux,3,4Tobias Meissner,1Anja Seckinger,1Hartmut Goldschmidt,1,2Axel Benner,5
Kare`ne Mahtouk,3,4Jens Hillengass,1,6Thierry Re`me,3,4John De Vos,3,4Michael Hundemer,1Maud Condomines,3,4
Uta Bertsch,1Jean-Franc¸ois Rossi,3,4Anna Jauch,7Bernard Klein,3,4and Thomas Mo¨hler1,2
1Medizinische Klinik V, Universita¨tsklinikum Heidelberg, Heidelberg, Germany;2Nationales Centrum fu¨r Tumorerkrankungen, Heidelberg, Germany;3Centre
Hospitalier Universitaire Montpellier, Institute for Research in Biotherapy, Hoˆpital Saint-Eloi, Montpellier, France;4Inserm U847, Montpellier, France;5Abteilung
fu¨r Biostatistik and6Abteilung fu¨r Radiologie, Deutsches Krebsforschungszentrum Heidelberg, Heidelberg, Germany; and7Institut fu¨r Humangenetik,
Universita¨tsklinikum Heidelberg, Heidelberg, Germany
Abundant bone marrow angiogenesis is present in almost all myeloma pa-tients requiring therapy and correlated to treatment response and survival. We
assessed the expression of 402
angiogenesis-associated genes by Af-fymetrix DNA microarrays in 466 samples, including CD138-purified myeloma cells (MMCs) from 300 previously untreated pa-tients, in vivo microcirculation by dynamic contrast-enhanced magnetic resonance imaging, and in vitro angiogenesis (AngioKit-assay). Normal bone marrow
plasma cells (BMPCs) express a median of 39 proangiogenic (eg, VEGFA, ADM,
IGF-1) and 28 antiangiogenic genes (eg, TIMP1, TIMP2). Supernatants of BMPCs
unlike those of memory B cells induce angiogenesis in vitro. MMCs do not show a significantly higher median number of expressed proangiogenic (45) or antian-giogenic (31) genes, but 97% of MMC samples aberrantly express at least one of the angiogenic factors HGF, IL-15, ANG,
APRIL, CTGF, or TGFA. Supernatants of
MMCs and human myeloma cell lines
induce significantly higher in vitro angiogenesis compared with BMPCs. In conclusion, BMPCs express a surplus of proangiogenic over antiangiogenic genes transmitting to the ability to induce in vitro angiogenesis. Aberrant expression of proan-giogenic and down-regulation of antiangio-genic genes by MMCs further increases the angiogenic stimulus, together leading to bone marrow angiogenesis at various de-grees in all myeloma patients. (Blood. 2009; 114:128-143)
Introduction
Multiple myeloma (MM) is an incurable malignant disease of clonal plasma cells that accumulate in the bone marrow (BM), causing clinical signs and symptoms related to the displacement of normal hematopoiesis, formation of osteolytic bone lesions, and produc-tion of monoclonal protein.1
In the bone marrow microenvironment (BMME) affected by MM, substantial BM neovascularization (“angiogenesis”) is present: com-pared with healthy persons, a higher microvessel density (MVD),2
endothelial activation,3capillary permeability,4and increased perfusion4
can be detected. BM angiogenesis parallels disease activity, is returned to the normal state after successful treatment,5,6 and correlates with
event-free survival (EFS) and overall survival (OS).7-10Several
proangio-genic cytokines (eg, VEGFA, FGF2, and HGF) are present in higher concentrations in myelomatous BM and peripheral blood sera6,11-16
while decreasing after successful treatment.6,13,14
In analogy to the “angiogenic switch” model for solid tumors by Folkman et al,17the induction of angiogenesis in MM is considered
to be related to malignant plasma cells progressively inducing a change in the balance between proangiogenic and antiangiogenic cytokines within the BMME. This change is attributed to malignant plasma cells obtaining the capability of aberrantly producing proangiogenic and concomitantly down-regulating antiangiogenic factors, either directly or by influencing the BMME. Here, it is a matter of debate whether these expression changes in malignant plasma cells take place at the stage of monoclonal gammopathy of
unknown significance (MGUS) or MM. BM angiogenesis has been described to either correlate with the accumulation of MM cells (MMCs; tumor load), or their proliferation. MMCs are thought to benefit in turn from BM angiogenesis by improved oxygen and nutrient supply and likewise antiapoptotic and tumor-promoting effects mediated by endothelial-derived cytokines and myeloma-endothelial adhesion events.18
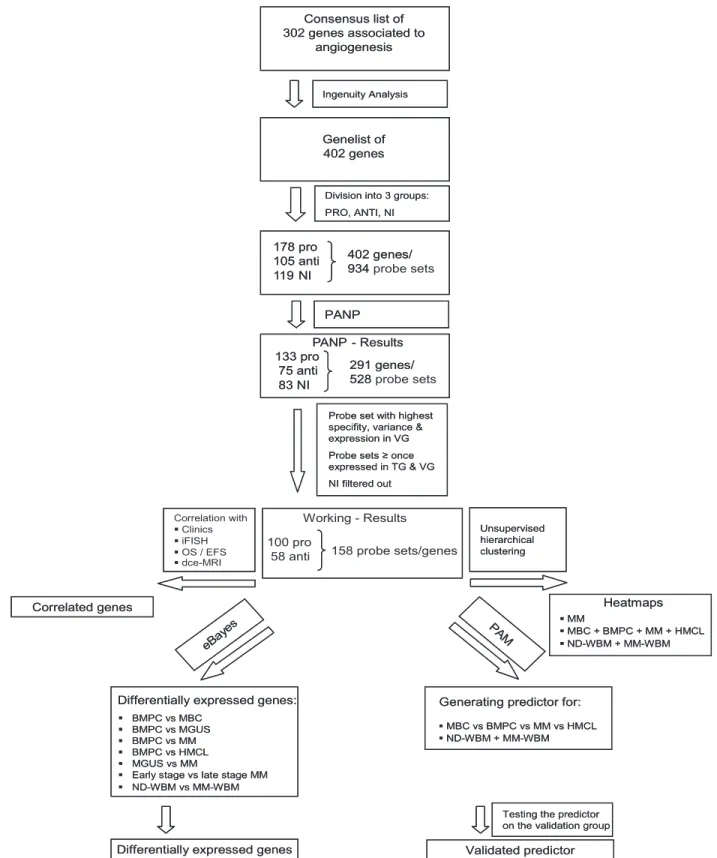
To assess a comprehensive set of “angiogenesis-associated” genes, we combined literature review and association of further related genes by Ingenuity Pathway Analysis (Figure 1). We subsequently assess presence and differential expression of these 402 genes in 466 gene expression profiles, including normal bone marrow plasma cells (BMPCs), primary MMCs, and human myeloma cell lines (HMCLs), BMME from normal healthy donors (NDs) and myeloma patients as well as the association with clinical parameters, genetic abnormalities, and survival.
We report here, for the first time, that already normal BMPCs express several proangiogenic genes, including VEGFA, IGF-1, and ADM and their culture supernatants (n⫽ 11) significantly induce in vitro angiogenesis. Interestingly, this angiogenesis induc-tion cannot be seen as a general property of cells of B-cellular lineage, as memory B-cell (MBC) supernatants do not induce angiogenesis in vitro (n⫽ 6). Expectedly, malignant plasma cells show a various pattern of aberrant expression of several proangio-genic factors, and culture supernatants of primary MMCs (n⫽ 20)
Submitted October 16, 2008; accepted March 9, 2009. Prepublished online as
Blood First Edition paper, March 18, 2009; DOI
10.1182/blood-2008-10-184226.
The online version of this article contains a data supplement.
The publication costs of this article were defrayed in part by page charge payment. Therefore, and solely to indicate this fact, this article is hereby marked ‘‘advertisement’’ in accordance with 18 USC section 1734.
© 2009 by The American Society of Hematology
and HMCLs (n⫽ 10) induce in vitro angiogenesis (tubule forma-tion). None of these factors, however, is expressed in all of the myeloma patient samples, and no significant correlation with in vivo surrogates of perfusion and MVD as determined by dynamic contrast-enhanced magnetic resonance imaging (dce-MRI, n⫽ 64) could be found. Nevertheless, if the 6 most frequently aberrantly expressed factors are considered (HGF, IL-15, APRIL (TNFSF13), ANG, TGFA, CTGF), in 2 cohorts of patients 89% (n⫽ 65) and 97% (n⫽ 235) of MMC samples show an aberrant expression of at least one of these factors.
These results shed a different light on our understanding of the mechanism of angiogenesis induction in MM and might change the current paradigm of myeloma pathophysiology in a way that several of the “malignant” properties of MMCs might be attributed to primary plasma cell functions.
Methods
Patients and healthy donors
Patients presenting with previously untreated MM (n⫽ 300) or MGUS (n⫽ 23) at the University Hospitals of Heidelberg and Montpellier and 14 healthy ND have been included after written informed consent was obtained in accordance with the Declaration of Helsinki in the study approved by the institutional review boards of the Medical Faculty of the Ruprecht-Karls-University Heidelberg (Heidelberg, Germany), and the Centre Hospitalier Universitaire Montpellier (Montpellier, France), for the respective patients. Patients were diagnosed and staged and their response to treatment was assessed according to standard criteria.19-22 A total of 207 patients underwent frontline high-dose chemotherapy (HDT) with 200 mg/m2 melphalan and autologous stem cell transplantation (ASCT) according or in analogy to the GMMG-HD3 trial.23 Data were validated by an independent cohort of 345 patients treated within the total therapy 2 protocol.24 For clinical parameters, see supplemental Table 1 (available on the Blood website; see the Supplemental Materials link at the top of the online article).
Samples
For an overview, see Table S2. Bone marrow plasma cells were purified using CD138 microbeads (Miltenyi Biotec), and purity was assessed by flow cytometry (FACSCalibur; BD Biosciences). Aliquots of unpurified (whole) bone marrow (WBM) of patients (n⫽ 57) and healthy donors (n⫽ 7) were obtained after NH4lysis as published.25BMPCs for superna-tant generation were subsequently FACSAria (BD Biosciences) sorted to purity more than 90% and peripheral CD27⫹MBCs generated as published.26 The HMCLs XG-1, XG-2, XG-3, XG-4, XG-5, XG-6, XG-7, XG-10, XG-11, XG-12, XG-13, XG-14, XG-16, XG-19, and XG-20 were generated at Institut National de la Sante´ et de la Recherche Me´dicale U847 as published.27-29 U266, RPMI-8226, LP-1, OPM-2, SKMM-2, AMO-1, JJN-3, NCI-929, KMS-12-BM, KMS-11, KMS-12-PE, KMS-18, MM1S, JIM3, KARPAS 620, L363, and ANBL6 (German Collection of Microorgan-isms and Cell Cultures, Braunschweig, Germany, and ATCC) were cultured as recommended.
iFISH
Interphase fluorescence in situ hybridization (iFISH) analysis was per-formed on CD138-purified plasma cells as described30,31using probes for chromosomes 1q21, 4p16, 6q21, 8p21, 9q34, 11q13, 11q23, 13q14.3, 15q22, 17p13, 19q13, 22q11, and translocations t(4;14)(p16.3;q32.3), t(11;14)(q13;q32.3) (Poseidon Probes, Kreatech Diagnostics). Ploidy status and clonal/subclonal aberrations (ie, present inⱖ 60% vs 20%-59% of assessed
MMCs) were defined as published.30A modified copy number score30 (excluding gains of 1q21) was used to assess ploidy state.
Gene expression analysis
Gene expression profiling (GEP) was performed as previously published.31 In brief, after RNA extraction, labeled cRNA was generated using the small sample labeling protocol vII (Affymetrix, Santa Clara, CA) and hybridized to U133 A⫹ B GeneChip microarray (Affymetrix) for the training group (TG) and U133 2.0 plus arrays for the validation group (VG), according to the manufacturer’s instructions. When different probe sets were available for the same gene, we chose the most specific probe set showing the maximal variance and the highest signal. Expression data for MMC samples are deposited in ArrayExpress under the accession numbers E-MTAB-81 and E-GEOD-2658.
To validate the Affymetrix gene expression data, expression of VEGFA (Hs00173626_m1), TGFA (Hs00608187_m1), CTGF (Hs00170014_m1), and ADM (Hs00181605_m1; all Applied Biosystems) was assessed by quantitative real-time polymerase chain reaction (RT-PCR) using the ABI Prism 7700 Sequence Detection System and the⌬⌬Ct method.32
Intracellular staining for VEGF
Intracellular vascular endothelial growth factor (VEGF) expression (clone 23410; R&D Systems) of 10 HMCLs, primary samples of 3 MM and one MGUS patient was measured by flow cytometry using a fixation and permeabilization kit (eBioscience). Overlays were established using the Infinicyt Software (Cytognos).
Protein detection by ELISA
Levels of VEGF, HGF, interleukin-15 (IL-15), TGFA, and IGF-1 were measured in culture supernatants of HMCLs (n⫽ 10), primary MMCs (n⫽ 2), and BM sera of myeloma patients (n ⫽ 10) and NDs (n ⫽ 3) according to the manufacturer’s instructions (RayBio for VEGF, HGF and IL-15; R&D Systems for TGFA and IGF-1). Culture supernatants were obtained by growing 106cells per mL for 24 hours in serum-free RPMI 1640 without addition of IL-6 (R&D Systems).
In vivo assessment of angiogenesis by dynamic contrast-enhanced magnetic resonance imaging
The entire spine of MM (n⫽ 57) and MGUS patients (n ⫽ 7) was examined on a 1.5-Tesla-Tomograph (Symphony; Siemens) from the 1st cervical vertebra to the sacrum with a sagittal STIR and a sagittal T1-weighted SE as published.33Two model variables are used to describe the tissue-specific information of the signal intensity-time curves: ampli-tude A (arbitrary units) is proportional to the relative signal enhancement as a surrogate for MVD and perfusion, the exchange rate constant kep (minutes) reflects the contrast agent transit between the extravascular and intravascular compartment.
In vitro assessment of angiogenesis
The angiogenic potential of 20 primary MMCs, 11 BMPCs, 6 MBC samples, and 10 HMCLs was investigated in the AngioKit assay (TCS Cellworks) according to the manufacturer’s instructions. Culture superna-tants were obtained as described for the enzyme-linked immunosorbent assays (ELISAs). Equal volumes of cell culture supernatants were added to the supplied growth medium. RPMI 1640, VEGF (2 ng/mL), and suramin (20M) served as medium, positive, and negative controls, respectively. All experiments were performed in triplicate, except for BMPCs and MBCs, because of limitations in achievable sample size (“Results”). After 11 days, cells were analyzed using a combined CD31 ELISA/CD31 tubule staining kit (TCS Cellworks). Tubular density was monitored using an Olympus IX-70 microscope (Olympus) at 40⫻ magnification.
Consensus list of proangiogenic and antiangiogenic genes
A consensus list of 302 genes associated with angiogenesis has been obtained by review of Medline and the Cytokines & Cells Online Pathfinder Encyclopaedia (www.copewithcytokines.de). Subsequently, genes were analyzed using Ingenuity Pathway Analysis (Ingenuity Systems) and
100 genes added. These 402 genes were divided into 3 groups: proangio-genic, antiangioproangio-genic, and “no information,” although some limitations apply to a gene expression–based analysis, as especially angio-inhibitory molecules are generated in vivo by cleavage of proteins by various proteases. 178 pro 105 anti 119 NI 402 genes/ 934 probe sets PANP 133 pro 75 anti 83 NI 291 genes/ 528 probe sets PANP - Results 100 pro
58 anti 158 probe sets/genes
Working - Results Unsupervised hierarchical clustering Correlation with Clinics iFISH OS / EFS dce-MRI Correlated genes PA M
Generating predictor for: MBC vs BMPC vs MM vs HMCL ND-WBM + MM-WBM
Testing the predictor on the validation group Validated predictor
eBay es
Differentially expressed genes: BMPC vs MBC
BMPC vs MGUS BMPC vs MM BMPC vs HMCL MGUS vs MM
Early stage vs late stage MM ND-WBM vs MM-WBM
Differentially expressed genes
Probe set with highest specifity, variance & expression in VG Probe sets ≥ once expressed in TG & VG NI filtered out Heatmaps MM MBC + BMPC + MM + HMCL ND-WBM + MM-WBM Genelist of 402 genes
Division into 3 groups: PRO, ANTI, NI Consensus list of 302 genes associated to angiogenesis Ingenuity Analysis 178 pro 105 anti 119 NI 402 genes/ 934 PANP 133 pro 75 anti 83 NI 291 genes/ 528 PANP - Results Unsupervised hierarchical clustering Correlated genes PA M
Generating predictor for: MBC vs BMPC vs MM vs HMCL ND-WBM + MM-WBM
Testing the predictor on the validation group Validated predictor
eBay es
Differentially expressed genes: BMPC vs MBC
BMPC vs MGUS BMPC vs MM BMPC vs HMCL MGUS vs MM
Early stage vs late stage MM ND-WBM vs MM-WBM
Differentially expressed genes
Probe set with highest specifity, variance & expression in VG Probe sets ≥ once expressed in TG & VG NI filtered out Heatmaps MM MBC + BMPC + MM + HMCL ND-WBM + MM-WBM Genelist of 402 genes
Division into 3 groups: PRO, ANTI, NI Consensus list of 302 genes associated to
angiogenesis
Ingenuity Analysis
Figure 1. Genes and probe sets included in the respective parts of the analysis. Shown is our strategy for selecting angiogenesis-related genes. On the initial set of 402 genes after review of Medline and the Cytokines & Cells Online Pathfinder Encyclopaedia as well as Ingenuity Pathway Analysis, PANP-derived judgment of expression (“presence” vs “absence”) was assessed, leading to 291 genes being present at least once. Of these, 83 genes with no exploratively attributable information (NI) on proangiogenic or antiangiogenic activity were excluded. For further analyses, the 100 proangiogenic and 58 antiangiogenic genes present at least once in the training (TG) and validation group (VG) were retained.
Statistical analysis
Gene expression data were normalized to GC-robust multi-array average (GC-RMA).34To assess presence or absence of gene expression indepen-dently of Affymetrix-mismatch probe sets, the “Presence-Absence calls with Negative Probe sets (PANP)” algorithm35 was used. “Aberrant expression” of a gene within the MMC samples compared with BMPCs is defined as “presence” within the MMC samples, but not at least once in BMPCs within TG and VG. Differential gene expression was assessed using empirical Bayes statistics in linear models for microarray data.36P values were adjusted for multiple testing controlling the false discovery rate as defined by Benjamini and Hochberg at a level of 5%.37 Expression profiles of 466 samples (13 MBCs, 14 BMPCs, 23 MGUS, 300 MM, 52 HMCLs [the same 20 HMCLs on different microarrays in TG and VG as well as AMO-1, JJN-3, NCI-929, KMS-12-BM, KMS-11, KMS-12-PE, KMS-18, MM1S, JIM3, KARPAS 620, L363 and ANBL6 in VG only], and 64 WBM) divided in TG (n⫽ 113, MM n ⫽ 65) and VG (n ⫽ 353, MM n⫽ 235) were analyzed. To assess the association of expressed angiogenic genes (signature) with EFS23and OS23for patients undergoing HDT and ASCT (Heidelberg/Montpellier group: 48 TG, 159 VG; Arkansas group: 345), Goeman global test38was applied. Findings were validated using an independent set of 345 patients from the Arkansas group. Association of chromosomal aberrations and clinical parameters with gene expression was calculated using the 2-sample t-statistic. Differences in clinical parameters between defined groups were investigated by analysis of variance. Correla-tion was measured using the Spearman correlaCorrela-tion coefficient (rs). Correla-tion with categorical variables was measured using the Kendall tau coefficient (). For assessing the relationship between categorical variables, Fisher exact test was used. The gene expression-based proliferation index is calculated as previously published.31
In all statistical tests, an effect was considered statistically significant if the P value of its corresponding statistical test was not greater than 5%. All statistical computations were performed using R,39version 2.8.1; Biocon-ductor,40version 2.3; and the Affymetrix Annotation Release 27. Results of the TG are shown in the supplemental data.
Results
Expression of angiogenesis-related genes
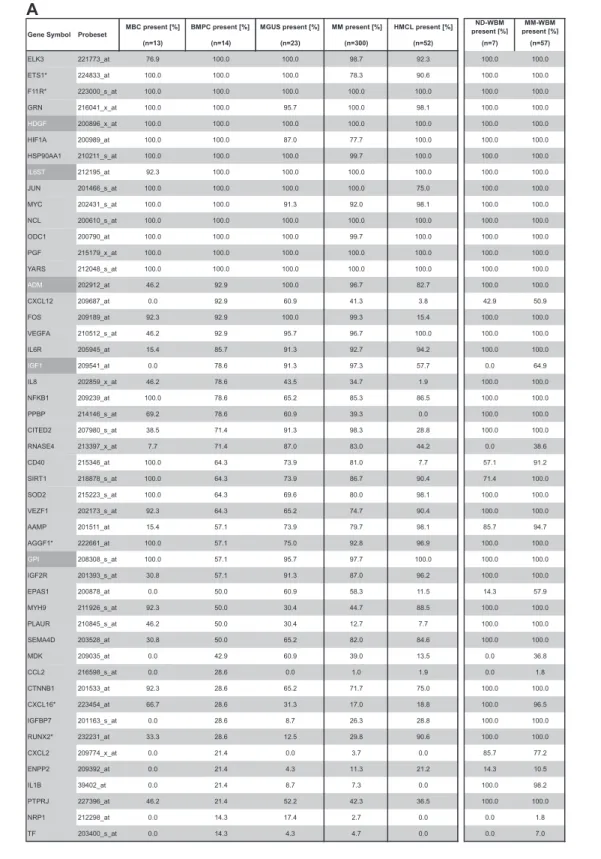
Gene expression of angiogenesis-related genes was evaluated using U133 A⫹ B and U133 2.0 plus Affymetrix microarrays. Of the 402 genes initially included (Figure 1, selection strategy), 283 genes could be exploratively attributed using Medline review to be either proangiogenic (178 genes) or antiangiogenic (105 genes). Of these, 158 genes were expressed at least once in TG and VG, that is, 100 proangiogenic and 58 antiangiogenic genes, shown in Table 1. Genes not fulfilling these criteria are depicted in supplemental Table 3.
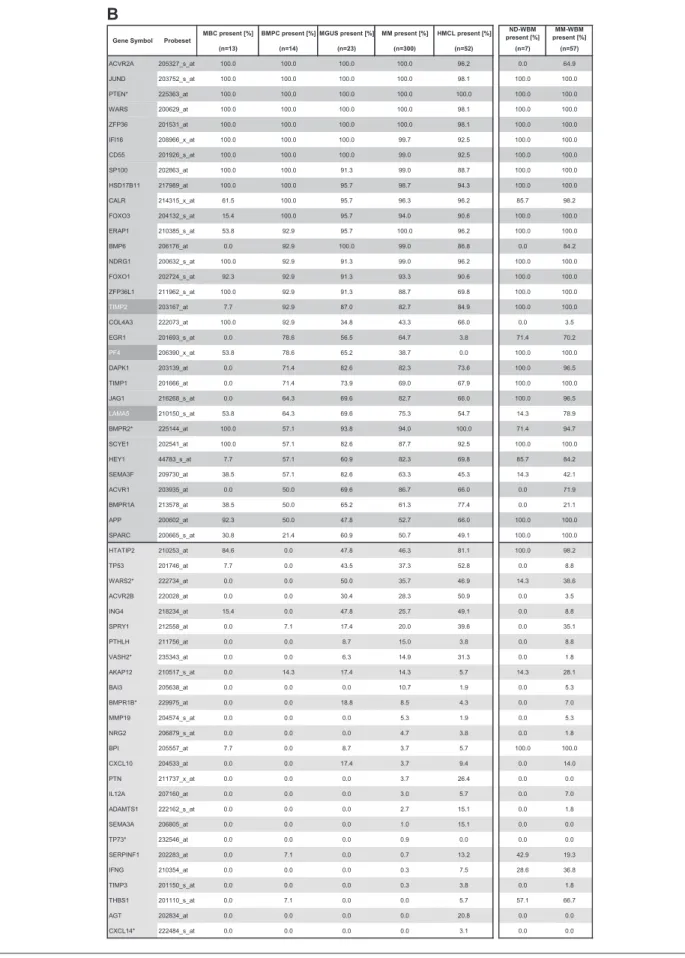
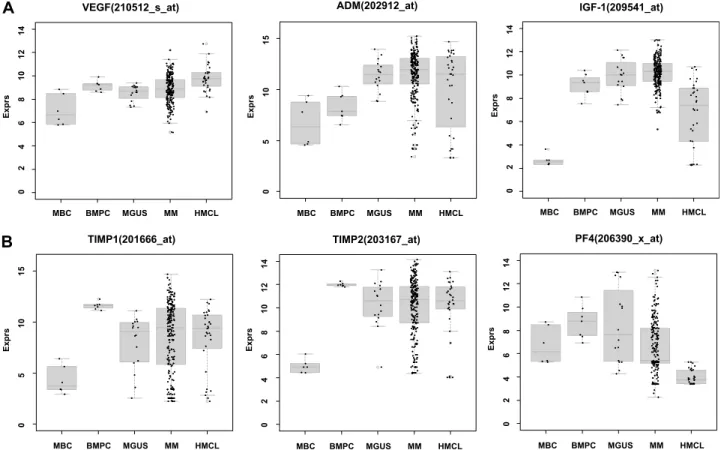
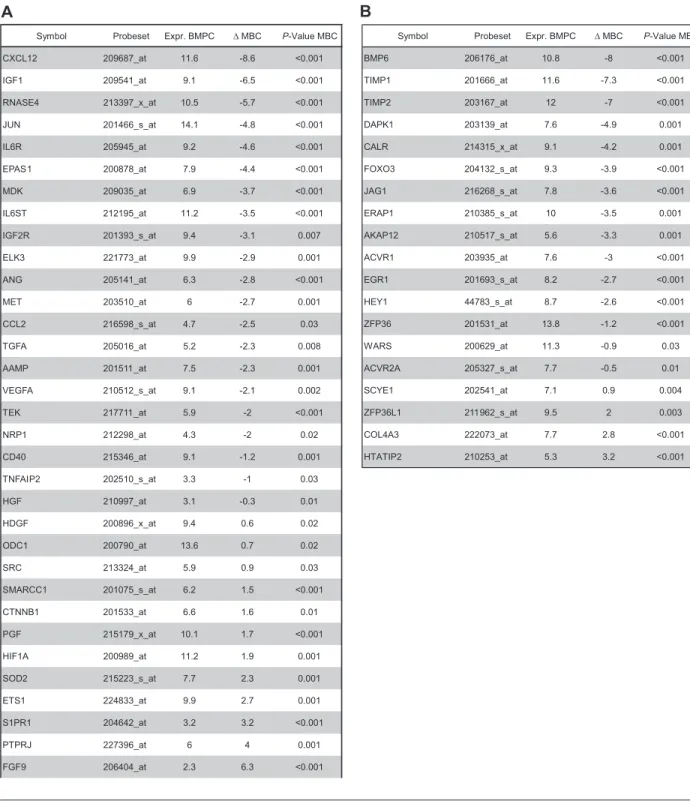
Using PANP-derived judgment of expression (“presence” vs “absence”), we found BMPCs to express 49 proangiogenic and 32 antiangiogenic genes with a median of 39 proangiogenic and 28 antiangiogenic genes in the VG, respectively (Table 1). MBCs express 47 proangiogenic and 30 antiangiogenic genes with a median of 32 proangiogenic and 19 antiangiogenic genes in the VG, respectively (Table 1). Of the proangiogenic BMPC genes, 21 genes are expressed significantly lower in MBCs, including major angiogenic factors, such as VEGFA, IGF-1, and ANG. Twelve genes show a significantly higher expression in MBCs, eg, HDGF and PGF; 4 antiangiogenic genes are up-regulated, 15 genes are significantly down-regulated in MBCs versus BMPCs (eg, BMP6, TIMP1, TIMP2; Figure 2; Table 2).
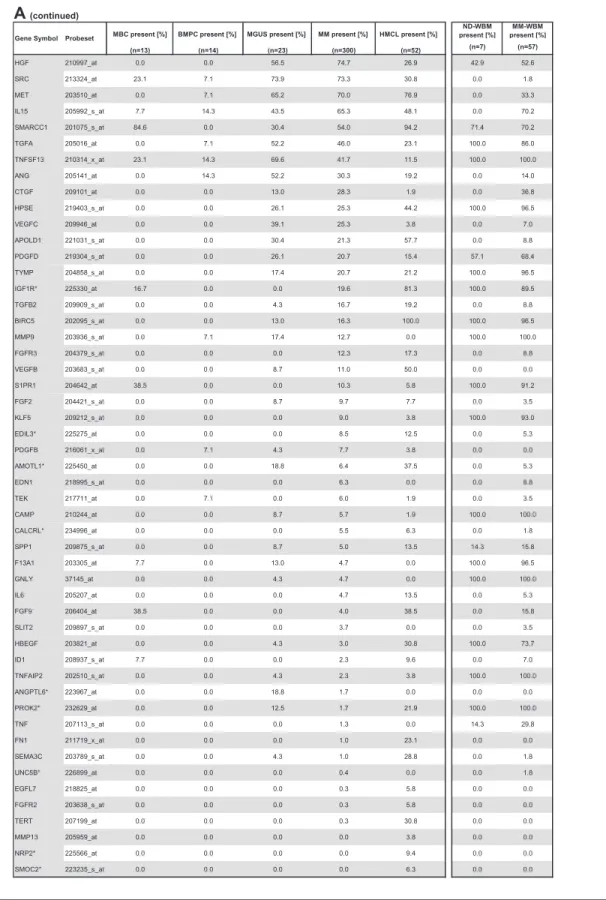
Compared with normal BMPCs, MMCs maintain expression of proangiogenic BMPC genes but show an aberrant expression of 51 proangiogenic and 26 antiangiogenic genes (Table 1; Figure 2A,B). The most frequently aberrantly expressed genes comprise
HGF in 74.7%, HGF-receptor MET in 70%, IL-15 in 65.3%, TGFA in 46%, ANG in 30.3%, and CTGF in 28.3% of MMC samples (Figure 2C; Table 1). Of the proangiogenic BMPC genes, 7 show a significantly higher expression in MMCs, eg, HGF and ADM; 13 proangiogenic genes, however, are expressed significantly lower in MMCs (Figure 2; Table 3). Five antiangiogenic genes are signifi-cantly down-regulated in MMCs versus BMPCs (PF4, AKAP12, TIMP2, LAMA5, and SERPINF1), and 3 are up-regulated (Table 3). Comparing MMCs of patients with early (MGUS and MMI) versus advanced-stage plasma cell dyscrasia (MMII and MMIII), we found 4 proangiogenic genes (including IL-6) to be significantly up-regulated and 8 down-regulated in the advanced stage. For the antiangiogenic genes, 2 genes (IFI16 and ERAP1) were signifi-cantly up-regulated and 3 (including PF4) down-regulated (Table 3). Comparing samples obtained from MGUS patients with MM samples, 9 genes are differentially expressed (Table 3); if this analysis is restricted to MGUS patients showing any clonal aberrations by iFISH (n⫽ 5), no gene remains significant.
HMCLs maintain expression of aberrantly expressed MMC genes (Figure 2; Table 1) and show an additional aberrant expression of 3 proangiogenic and 3 antiangiogenic genes. No proangiogenic gene is aberrantly expressed or any antiangiogenic gene is lost in all HMCLs.
The unsupervised hierarchical clustering based on the proangio-genic and antiangioproangio-genic genes shows BMPCs clustering together in a sub-branch within the MMCs of the VG. The 20 HMCLs cluster together with the MBCs, both appearing in a separate sub-branch (Figure 2D). A comparable picture was obtained with MMCs of the TG (supplemental Figure 1D).
A PAM-based predictor for MBCs, BMPCs, MMCs, and HMCLs of 133 genes calculated on the proangiogenic and antian-giogenic genes in the consensus list predicts group attribution with an estimated error rate of 3% (TG) and 3% (VG), respectively (supplemental Table 5A).
In the BMME of normal donors (ND-WBM) and myeloma patients (MM-WBM), 63 and 90 (of 100) proangiogenic as well as 34 and 53 (of 58) antiangiogenic genes are expressed. Twelve genes are differentially expressed between ND-WBM and MM-WBM (Table 4). In the unsupervised hierarchical clustering of the WBM samples, MM-WBM and ND-WBM separate (supplemental Figure 2).
A PAM-based predictor for ND-WBM and MM-WBM calcu-lated on the 158 expressed proangiogenic and antiangiogenic genes and comprising 49 genes allows predicting the group attribution with an estimated error rate of 9% (supplemental Table 5B). Validation of gene expression data
To validate gene expression data, quantitative real-time PCR, flow cytometry, and ELISAs were performed. Gene expression mea-sured by quantitative RT-PCR verifies expression of VEGFA (rs⫽ ⫺0.45, P ⫽ .2), ADM (rs⫽ ⫺0.84, P ⫽ .004), CTGF
(rs⫽ ⫺0.9, P ⫽ ⬍ .001), and TGFA (rs⫽ ⫺0.42, P ⫽ .2) in 10
HMCLs as detected by Affymetrix gene-chip (Figure 3A, supple-mental Figure 3). An additional validation is given by the flow cytometric measurement of intracellular VEGF. VEGF expression can be detected in 10 of 10 HMCLs, 3 of 3 primary MMCs, and 1 of 1 MGUS cell samples. An exemplary primary MMC and MGUS sample as well as 2 HMCL samples are shown in Figure 3B.
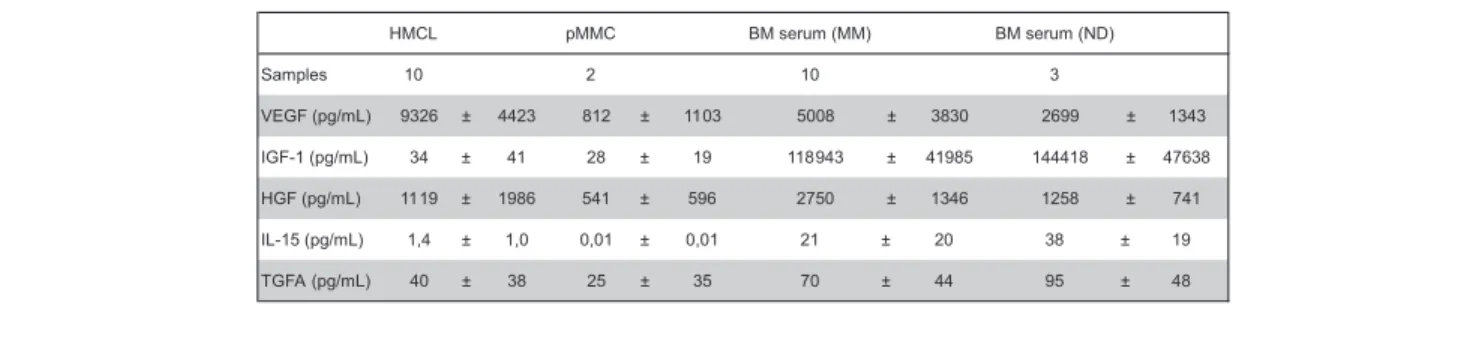
Secretion of VEGF, IGF-1, HGF, IL-15, and TGFA was measured by ELISA (Table 5). Of the proangiogenic factors already expressed by BMPCs, VEGF levels above the detection threshold of 20 pg/mL can be detected in all MMC and HMCL supernatants as well as all BM sera of myeloma patients and NDs.
Table 1. Expression of proangiogenic and antiangiogenic genes as judged by PANP
MBC present [%] BMPC present [%] MGUS present [%] MM present [%] HMCL present [%] ND-WBM present [%] MM-WBM present [%] (n=13) (n=14) (n=23) (n=300) (n=52) (n=7) (n=57) ELK3 221773_at 76.9 100.0 100.0 98.7 92.3 100.0 100.0 ETS1* 224833_at 100.0 100.0 100.0 78.3 90.6 100.0 100.0 F11R* 223000_s_at 100.0 100.0 100.0 100.0 100.0 100.0 100.0 GRN 216041_x_at 100.0 100.0 95.7 100.0 98.1 100.0 100.0 HDGF 200896_x_at 100.0 100.0 100.0 100.0 100.0 100.0 100.0 HIF1A 200989_at 100.0 100.0 87.0 77.7 100.0 100.0 100.0 HSP90AA1 210211_s_at 100.0 100.0 100.0 99.7 100.0 100.0 100.0 IL6ST 212195_at 92.3 100.0 100.0 100.0 100.0 100.0 100.0 JUN 201466_s_at 100.0 100.0 100.0 100.0 75.0 100.0 100.0 MYC 202431_s_at 100.0 100.0 91.3 92.0 98.1 100.0 100.0 NCL 200610_s_at 100.0 100.0 100.0 100.0 100.0 100.0 100.0 ODC1 200790_at 100.0 100.0 100.0 99.7 100.0 100.0 100.0 PGF 215179_x_at 100.0 100.0 100.0 100.0 100.0 100.0 100.0 YARS 212048_s_at 100.0 100.0 100.0 100.0 100.0 100.0 100.0 ADM 202912_at 46.2 92.9 100.0 96.7 82.7 100.0 100.0 CXCL12 209687_at 0.0 92.9 60.9 41.3 3.8 42.9 50.9 FOS 209189_at 92.3 92.9 100.0 99.3 15.4 100.0 100.0 VEGFA 210512_s_at 46.2 92.9 95.7 96.7 100.0 100.0 100.0 IL6R 205945_at 15.4 85.7 91.3 92.7 94.2 100.0 100.0 IGF1 209541_at 0.0 78.6 91.3 97.3 57.7 0.0 64.9 IL8 202859_x_at 46.2 78.6 43.5 34.7 1.9 100.0 100.0 NFKB1 209239_at 100.0 78.6 65.2 85.3 86.5 100.0 100.0 PPBP 214146_s_at 69.2 78.6 60.9 39.3 0.0 100.0 100.0 CITED2 207980_s_at 38.5 71.4 91.3 98.3 28.8 100.0 100.0 RNASE4 213397_x_at 7.7 71.4 87.0 83.0 44.2 0.0 38.6 CD40 215346_at 100.0 64.3 73.9 81.0 7.7 57.1 91.2 SIRT1 218878_s_at 100.0 64.3 73.9 86.7 90.4 71.4 100.0 SOD2 215223_s_at 100.0 64.3 69.6 80.0 98.1 100.0 100.0 VEZF1 202173_s_at 92.3 64.3 65.2 74.7 90.4 100.0 100.0 AAMP 201511_at 15.4 57.1 73.9 79.7 98.1 85.7 94.7 AGGF1* 222661_at 100.0 57.1 75.0 92.8 96.9 100.0 100.0 GPI 208308_s_at 100.0 57.1 95.7 97.7 100.0 100.0 100.0 IGF2R 201393_s_at 30.8 57.1 91.3 87.0 96.2 100.0 100.0 EPAS1 200878_at 0.0 50.0 60.9 58.3 11.5 14.3 57.9 MYH9 211926_s_at 92.3 50.0 30.4 44.7 88.5 100.0 100.0 PLAUR 210845_s_at 46.2 50.0 30.4 12.7 7.7 100.0 100.0 SEMA4D 203528_at 30.8 50.0 65.2 82.0 84.6 100.0 100.0 MDK 209035_at 0.0 42.9 60.9 39.0 13.5 0.0 36.8 CCL2 216598_s_at 0.0 28.6 0.0 1.0 1.9 0.0 1.8 CTNNB1 201533_at 92.3 28.6 65.2 71.7 75.0 100.0 100.0 CXCL16* 223454_at 66.7 28.6 31.3 17.0 18.8 100.0 96.5 IGFBP7 201163_s_at 0.0 28.6 8.7 26.3 28.8 100.0 100.0 RUNX2* 232231_at 33.3 28.6 12.5 29.8 90.6 100.0 100.0 CXCL2 209774_x_at 0.0 21.4 0.0 3.7 0.0 85.7 77.2 ENPP2 209392_at 0.0 21.4 4.3 11.3 21.2 14.3 10.5 IL1B 39402_at 0.0 21.4 8.7 7.3 0.0 100.0 98.2 PTPRJ 227396_at 46.2 21.4 52.2 42.3 36.5 100.0 100.0 NRP1 212298_at 0.0 14.3 17.4 2.7 0.0 0.0 1.8 TF 203400_s_at 0.0 14.3 4.3 4.7 0.0 0.0 7.0 Probeset Gene Symbol
A
Percentage of MBCs, normal BMPCs, and malignant plasma cells (MGUS, MM) as well as HMCLs; ND-WBM and MM-WBM expressing (A) proangiogenic and (B) antiangiogenic genes as judged by PANP. Depicted are only genes found to be expressed at least once in the 113 samples of the training and the 353 samples of the validation group. Proangiogenic genes expressed already at BMPC stage are depicted in gray, aberrantly expressed genes in MMC in light gray, and those significantly overexpressed in MMC with white letters on a dark gray background. Results are listed according to the percentage of BMPC samples, and those aberrantly expressed according to the percentage of MMC samples expressing the respective gene.
Table 1. Expression of proangiogenic and antiangiogenic genes as judged by PANP (continued)
MBC present [%] BMPC present [%] MGUS present [%] MM present [%] HMCL present [%]
ND-WBM present [%] MM-WBM present [%] (n=13) (n=14) (n=23) (n=300) (n=52) (n=7) (n=57) HGF 210997_at 0.0 0.0 56.5 74.7 26.9 42.9 52.6 SRC 213324_at 23.1 7.1 73.9 73.3 30.8 0.0 1.8 MET 203510_at 0.0 7.1 65.2 70.0 76.9 0.0 33.3 IL15 205992_s_at 7.7 14.3 43.5 65.3 48.1 0.0 70.2 SMARCC1 201075_s_at 84.6 0.0 30.4 54.0 94.2 71.4 70.2 TGFA 205016_at 0.0 7.1 52.2 46.0 23.1 100.0 86.0 TNFSF13 210314_x_at 23.1 14.3 69.6 41.7 11.5 100.0 100.0 ANG 205141_at 0.0 14.3 52.2 30.3 19.2 0.0 14.0 CTGF 209101_at 0.0 0.0 13.0 28.3 1.9 0.0 36.8 HPSE 219403_s_at 0.0 0.0 26.1 25.3 44.2 100.0 96.5 VEGFC 209946_at 0.0 0.0 39.1 25.3 3.8 0.0 7.0 APOLD1 221031_s_at 0.0 0.0 30.4 21.3 57.7 0.0 8.8 PDGFD 219304_s_at 0.0 0.0 26.1 20.7 15.4 57.1 68.4 TYMP 204858_s_at 0.0 0.0 17.4 20.7 21.2 100.0 96.5 IGF1R* 225330_at 16.7 0.0 0.0 19.6 81.3 100.0 89.5 TGFB2 209909_s_at 0.0 0.0 4.3 16.7 19.2 0.0 8.8 BIRC5 202095_s_at 0.0 0.0 13.0 16.3 100.0 100.0 96.5 MMP9 203936_s_at 0.0 7.1 17.4 12.7 0.0 100.0 100.0 FGFR3 204379_s_at 0.0 0.0 0.0 12.3 17.3 0.0 8.8 VEGFB 203683_s_at 0.0 0.0 8.7 11.0 50.0 0.0 0.0 S1PR1 204642_at 38.5 0.0 0.0 10.3 5.8 100.0 91.2 FGF2 204421_s_at 0.0 0.0 8.7 9.7 7.7 0.0 3.5 KLF5 209212_s_at 0.0 0.0 0.0 9.0 3.8 100.0 93.0 EDIL3* 225275_at 0.0 0.0 0.0 8.5 12.5 0.0 5.3 PDGFB 216061_x_at 0.0 7.1 4.3 7.7 3.8 0.0 0.0 AMOTL1* 225450_at 0.0 0.0 18.8 6.4 37.5 0.0 5.3 EDN1 218995_s_at 0.0 0.0 0.0 6.3 0.0 0.0 8.8 TEK 217711_at 0.0 7.1 0.0 6.0 1.9 0.0 3.5 CAMP 210244_at 0.0 0.0 8.7 5.7 1.9 100.0 100.0 CALCRL* 234996_at 0.0 0.0 0.0 5.5 6.3 0.0 1.8 SPP1 209875_s_at 0.0 0.0 8.7 5.0 13.5 14.3 15.8 F13A1 203305_at 7.7 0.0 13.0 4.7 0.0 100.0 96.5 GNLY 37145_at 0.0 0.0 4.3 4.7 0.0 100.0 100.0 IL6 205207_at 0.0 0.0 0.0 4.7 13.5 0.0 5.3 FGF9 206404_at 38.5 0.0 0.0 4.0 38.5 0.0 15.8 SLIT2 209897_s_at 0.0 0.0 0.0 3.7 0.0 0.0 3.5 HBEGF 203821_at 0.0 0.0 4.3 3.0 30.8 100.0 73.7 ID1 208937_s_at 7.7 0.0 0.0 2.3 9.6 0.0 7.0 TNFAIP2 202510_s_at 0.0 0.0 4.3 2.3 3.8 100.0 100.0 ANGPTL6* 223967_at 0.0 0.0 18.8 1.7 0.0 0.0 0.0 PROK2* 232629_at 0.0 0.0 12.5 1.7 21.9 100.0 100.0 TNF 207113_s_at 0.0 0.0 0.0 1.3 0.0 14.3 29.8 FN1 211719_x_at 0.0 0.0 0.0 1.0 23.1 0.0 0.0 SEMA3C 203789_s_at 0.0 0.0 4.3 1.0 28.8 0.0 1.8 UNC5B* 226899_at 0.0 0.0 0.0 0.4 0.0 0.0 1.8 EGFL7 218825_at 0.0 0.0 0.0 0.3 5.8 0.0 0.0 FGFR2 203638_s_at 0.0 0.0 0.0 0.3 5.8 0.0 0.0 TERT 207199_at 0.0 0.0 0.0 0.3 30.8 0.0 0.0 MMP13 205959_at 0.0 0.0 0.0 0.0 3.8 0.0 0.0 NRP2* 225566_at 0.0 0.0 0.0 0.0 9.4 0.0 0.0 SMOC2* 223235_s_at 0.0 0.0 0.0 0.0 6.3 0.0 0.0
Gene Symbol Probeset
A
(continued)Percentage of MBCs, normal BMPCs, and malignant plasma cells (MGUS, MM) as well as HMCLs; ND-WBM and MM-WBM expressing (A) proangiogenic and (B) antiangiogenic genes as judged by PANP. Depicted are only genes found to be expressed at least once in the 113 samples of the training and the 353 samples of the validation group. Proangiogenic genes expressed already at BMPC stage are depicted in gray, aberrantly expressed genes in MMC in light gray, and those significantly overexpressed in MMC with white letters on a dark gray background. Results are listed according to the percentage of BMPC samples, and those aberrantly expressed according to the percentage of MMC samples expressing the respective gene.
Table 1. Expression of proangiogenic and antiangiogenic genes as judged by PANP (continued)
MBC present [%] BMPC present [%] MGUS present [%] MM present [%] HMCL present [%] ND-WBM present [%] MM-WBM present [%] (n=13) (n=14) (n=23) (n=300) (n=52) (n=7) (n=57) ACVR2A 205327_s_at 100.0 100.0 100.0 100.0 96.2 0.0 64.9 JUND 203752_s_at 100.0 100.0 100.0 100.0 98.1 100.0 100.0 PTEN* 225363_at 100.0 100.0 100.0 100.0 100.0 100.0 100.0 WARS 200629_at 100.0 100.0 100.0 100.0 98.1 100.0 100.0 ZFP36 201531_at 100.0 100.0 100.0 100.0 98.1 100.0 100.0 IFI16 208966_x_at 100.0 100.0 100.0 99.7 92.5 100.0 100.0 CD55 201926_s_at 100.0 100.0 100.0 99.0 92.5 100.0 100.0 SP100 202863_at 100.0 100.0 91.3 99.0 88.7 100.0 100.0 HSD17B11 217989_at 100.0 100.0 95.7 98.7 94.3 100.0 100.0 CALR 214315_x_at 61.5 100.0 95.7 96.3 96.2 85.7 98.2 FOXO3 204132_s_at 15.4 100.0 95.7 94.0 90.6 100.0 100.0 ERAP1 210385_s_at 53.8 92.9 95.7 100.0 96.2 100.0 100.0 BMP6 206176_at 0.0 92.9 100.0 99.0 86.8 0.0 84.2 NDRG1 200632_s_at 100.0 92.9 91.3 99.0 96.2 100.0 100.0 FOXO1 202724_s_at 92.3 92.9 91.3 93.3 90.6 100.0 100.0 ZFP36L1 211962_s_at 100.0 92.9 91.3 88.7 69.8 100.0 100.0 TIMP2 203167_at 7.7 92.9 87.0 82.7 84.9 100.0 100.0 COL4A3 222073_at 100.0 92.9 34.8 43.3 66.0 0.0 3.5 EGR1 201693_s_at 0.0 78.6 56.5 64.7 3.8 71.4 70.2 PF4 206390_x_at 53.8 78.6 65.2 38.7 0.0 100.0 100.0 DAPK1 203139_at 0.0 71.4 82.6 82.3 73.6 100.0 96.5 TIMP1 201666_at 0.0 71.4 73.9 69.0 67.9 100.0 100.0 JAG1 216268_s_at 0.0 64.3 69.6 82.7 66.0 100.0 96.5 LAMA5 210150_s_at 53.8 64.3 69.6 75.3 54.7 14.3 78.9 BMPR2* 225144_at 100.0 57.1 93.8 94.0 100.0 71.4 94.7 SCYE1 202541_at 100.0 57.1 82.6 87.7 92.5 100.0 100.0 HEY1 44783_s_at 7.7 57.1 60.9 82.3 69.8 85.7 84.2 SEMA3F 209730_at 38.5 57.1 82.6 63.3 45.3 14.3 42.1 ACVR1 203935_at 0.0 50.0 69.6 86.7 66.0 0.0 71.9 BMPR1A 213578_at 38.5 50.0 65.2 61.3 77.4 0.0 21.1 APP 200602_at 92.3 50.0 47.8 52.7 66.0 100.0 100.0 SPARC 200665_s_at 30.8 21.4 60.9 50.7 49.1 100.0 100.0 HTATIP2 210253_at 84.6 0.0 47.8 46.3 81.1 100.0 98.2 TP53 201746_at 7.7 0.0 43.5 37.3 52.8 0.0 8.8 WARS2* 222734_at 0.0 0.0 50.0 35.7 46.9 14.3 38.6 ACVR2B 220028_at 0.0 0.0 30.4 28.3 50.9 0.0 3.5 ING4 218234_at 15.4 0.0 47.8 25.7 49.1 0.0 8.8 SPRY1 212558_at 0.0 7.1 17.4 20.0 39.6 0.0 35.1 PTHLH 211756_at 0.0 0.0 8.7 15.0 3.8 0.0 8.8 VASH2* 235343_at 0.0 0.0 6.3 14.9 31.3 0.0 1.8 AKAP12 210517_s_at 0.0 14.3 17.4 14.3 5.7 14.3 28.1 BAI3 205638_at 0.0 0.0 0.0 10.7 1.9 0.0 5.3 BMPR1B* 229975_at 0.0 0.0 18.8 8.5 4.3 0.0 7.0 MMP19 204574_s_at 0.0 0.0 0.0 5.3 1.9 0.0 5.3 NRG2 206879_s_at 0.0 0.0 0.0 4.7 3.8 0.0 1.8 BPI 205557_at 7.7 0.0 8.7 3.7 5.7 100.0 100.0 CXCL10 204533_at 0.0 0.0 17.4 3.7 9.4 0.0 14.0 PTN 211737_x_at 0.0 0.0 0.0 3.7 26.4 0.0 0.0 IL12A 207160_at 0.0 0.0 0.0 3.0 5.7 0.0 7.0 ADAMTS1 222162_s_at 0.0 0.0 0.0 2.7 15.1 0.0 1.8 SEMA3A 206805_at 0.0 0.0 0.0 1.0 15.1 0.0 0.0 TP73* 232546_at 0.0 0.0 0.0 0.9 0.0 0.0 0.0 SERPINF1 202283_at 0.0 7.1 0.0 0.7 13.2 42.9 19.3 IFNG 210354_at 0.0 0.0 0.0 0.3 7.5 28.6 36.8 TIMP3 201150_s_at 0.0 0.0 0.0 0.3 3.8 0.0 1.8 THBS1 201110_s_at 0.0 7.1 0.0 0.0 5.7 57.1 66.7 AGT 202834_at 0.0 0.0 0.0 0.0 20.8 0.0 0.0 CXCL14* 222484_s_at 0.0 0.0 0.0 0.0 3.1 0.0 0.0
Gene Symbol Probeset
B
Percentage of MBCs, normal BMPCs, and malignant plasma cells (MGUS, MM) as well as HMCLs; ND-WBM and MM-WBM expressing (A) proangiogenic and (B) antiangiogenic genes as judged by PANP. Depicted are only genes found to be expressed at least once in the 113 samples of the training and the 353 samples of the validation group. Proangiogenic genes expressed already at BMPC stage are depicted in gray, aberrantly expressed genes in MMC in light gray, and those significantly overexpressed in MMC with white letters on a dark gray background. Results are listed according to the percentage of BMPC samples, and those aberrantly expressed according to the percentage of MMC samples expressing the respective gene.
Measured values correlate well with VEGFA expression assessed by GEP for HMCLs (rs⫽ 0.74, P ⬍ .01). IGF-1 levels above the
mean detection threshold of 26 pg/mL (range given by the manufacturer, 7-56 pg/mL) can be found in 1 of 2 MMC and 4 of 10 HMCL supernatants as well as all BM sera. The values for BM sera are by several orders of magnitude higher compared with MMC or HMCL supernatants. Measured values correlate with IGF-1 expression assessed by GEP for HMCLs (rs⫽ 0.64, P ⫽ .05).
Of the aberrantly expressed factors, measured HGF levels are by orders of magnitude above the detection threshold within the BM sera of all samples. For HMCL supernatants, HGF secretion above the detection level of 8 pg/mL can be detected in all samples; however, 2 HMCL supernatants show a level around the detection threshold (8.1 and 8.4 pg/mL). Measured values correlate well with HGF expression assessed by GEP for HMCLs (rs⫽ 0.89, P ⬍ .001).
IL-15 levels above the median detection threshold of 3 pg/mL cannot be found in MMC or HMCL supernatants, whereas they are detectable in all BM sera, including normal BM. TGFA secretion above the median detection threshold of 2.27 pg/mL (range given by the manufacturer, 0.55-7 pg/mL) can be detected in 8 of 10 HMCL, 1 of 2 MMC supernatants, and all BM sera.
In vitro tubule formation by supernatants of memory B cells, normal and malignant plasma cells, and myeloma cell lines The angiogenic potential of supernatants of 6 MBC (but for 2 in a single measurement), 11 BMPC (but for 2 in a single measure-ment), 20 primary MMC (in triplicates), and 10 HMCL samples (in triplicates twice) was investigated in the AngioKit model. After 11 days, in vitro tubule formation was quantified using a
CD31 ELISA and tubules were visualized by staining with an anti-CD31 (PECAM-1) antibody. Unlike those of MBCs, super-natants of BMPCs, MMCs, and HMCLs show a significant induction of tubule formation compared with medium control (P⫽ .04, P ⬍ .001, and P ⬍ .001, respectively; Figure 4A). Three exemplary MBC, BMPC, and MMC samples as well as HMCLs, respectively, are shown in Figure 4B.
Correlation of angiogenic gene expression with biologic and clinical parameters
When considering only genes correlated significantly in TG and VG with a coefficient more than 0.4, the only chromosomal aberration correlating with one of the angiogenic genes is t(4;14) with FGFR3 expression (TG ⫽ 0.47, P ⫽ .002; VG ⫽ 0.73, P⬍ .001). Only BIRC5 (survivin), a gene also associated with proliferation, correlates significantly with the plasma cell labeling index (n⫽ 67, rs⫽ 0.54, P ⫽ .001). By correlating expression of
angiogenic genes with our gene expression-based proliferation index, of the genes not part of this index, one gene shows a significant positive correlation coefficient more than 0.4 (GPI, TG rs⫽ 0.46, P ⫽ .001; VG rs⫽ 0.51, P ⬍ .001), 3 a negative
correla-tion (TERT, TG rs⫽ ⫺0.51, P ⬍ .001; VG rs⫽ ⫺0.43, P ⬍ .001;
TEK, TG rs⫽ ⫺0.53, P ⬍ .001; VG rs⫽ ⫺0.56, P ⬍ .001; PDGFB,
TG rs⫽ ⫺0.63, P ⬍ .001; VG rs⫽ ⫺0.47, P ⬍ .001), all being
proangiogenic. Thus, no obvious connection could be found between MMC proliferation and angiogenic gene expression.
The dce-MRI surrogates for perfusion (A) and the exchange rate constant (kep) do not correlate significantly with any of the MBC BMPC MGUS MM HMCL VEGF(210512_s_at) Ex p rs 0 2 4 6 8 10 12 14 TIMP2(203167_at) MBC BMPC MGUS MM HMCL Ex p rs 0 2 4 6 8 10 12 14 PF4(206390_x_at) MBC BMPC MGUS MM HMCL Ex p rs 0 2 4 6 8 10 12 14 ADM(202912_at) MBC BMPC MGUS MM HMCL Ex p rs 0 5 10 15 TIMP1(201666_at) MBC BMPC MGUS MM HMCL Ex p rs 0 5 10 15 IGF-1(209541_at) MBC BMPC MGUS MM HMCL Ex p rs 0 2 4 6 8 10 12 14
A
B
Figure 2. Expression of proangiogenic and antiangiogenic genes. Expression of (A) the proangiogenic genes VEGFA, ADM, and IGF-1, (B) the antiangiogenic genes TIMP1, TIMP2, and PF4, and (C) the aberrantly expressed genes HGF, CTGF, and TGFA as well as MET, IL-15, and ANG within the validation group. Supplemental Figure 1 contains information on the training group. (D) The unsupervised hierarchical clustering shows BMPCs (depicted in blue) clustering together in a sub-branch within the MMCs (depicted in white). All HMCLs (depicted in orange) clustering together with the MBCs (depicted in light blue) in a separate branch each. Supplemental Figure 1D contains information on the training group.
angiogenic genes. No correlation with the expression of (anti)angio-genic genes with those of D-type cyclins (CCND1, CCND2, CCND3) or clinical parameters (serum-2-microglobulin (B2M), International Staging System stage, Salmon/Durie-stage, and se-rum albumin) could be found.
Prognostic value of angiogenic gene expression
Using Goeman global test, a significant association of the angiogenic gene expression (signature) could be found for EFS or OS within the VG and the Arkansas data (supplemental
D
MET(203510_at) MBC BMPC MGUS MM HMCL Ex p rs 0 2 4 6 8 1 0 1 2 1 4 IL-15(205992_s_at) MBC BMPC MGUS MM HMCL Ex p rs 0 2 4 6 8 10 12 14 HGF(210997_at) MBC BMPC MGUS MM HMCL Ex p rs 0 2 4 6 8 10 12 14 CTGF(209101_at) MBC BMPC MGUS MM HMCL Ex p rs 0 2 4 6 8 10 12 14 TGFA(205016_at) MBC BMPC MGUS MM HMCL Ex p rs 0 2 4 6 8 10 12 14 ANG(205141_at) MBC BMPC MGUS MM HMCL Ex p rs 0 2 4 6 8 10 12 14C
Figure 2. ContinuedFigure 4). However, this signature is largely driven by expres-sion of t(4;14) (eg, FGFR3) or proliferation-associated genes (eg, BIRC5). In a model including the presence of t(4;14) and the gene expression-based proliferation index as covariables, no association with survival could be found (on TG and VG only resulting from lack of t(4;14) data for the Arkansas group; supplemental Figure 5).
Discussion
Current hypotheses about induction of angiogenesis in multiple myeloma
Several hypotheses have been formulated to explain the induction of angiogenesis in MM:
Table 2. Differential gene expression between bone marrow plasma cells and memory B cells within the validation group
Symbol Probeset Expr. BMPC ∆ MBC P-Value MBC
CXCL12 209687_at 11.6 -8.6 <0.001 IGF1 209541_at 9.1 -6.5 <0.001 RNASE4 213397_x_at 10.5 -5.7 <0.001 JUN 201466_s_at 14.1 -4.8 <0.001 IL6R 205945_at 9.2 -4.6 <0.001 EPAS1 200878_at 7.9 -4.4 <0.001 MDK 209035_at 6.9 -3.7 <0.001 IL6ST 212195_at 11.2 -3.5 <0.001 IGF2R 201393_s_at 9.4 -3.1 0.007 ELK3 221773_at 9.9 -2.9 0.001 ANG 205141_at 6.3 -2.8 <0.001 MET 203510_at 6 -2.7 0.001 CCL2 216598_s_at 4.7 -2.5 0.03 TGFA 205016_at 5.2 -2.3 0.008 AAMP 201511_at 7.5 -2.3 0.001 VEGFA 210512_s_at 9.1 -2.1 0.002 TEK 217711_at 5.9 -2 <0.001 NRP1 212298_at 4.3 -2 0.02 CD40 215346_at 9.1 -1.2 0.001 TNFAIP2 202510_s_at 3.3 -1 0.03 HGF 210997_at 3.1 -0.3 0.01 HDGF 200896_x_at 9.4 0.6 0.02 ODC1 200790_at 13.6 0.7 0.02 SRC 213324_at 5.9 0.9 0.03 SMARCC1 201075_s_at 6.2 1.5 <0.001 CTNNB1 201533_at 6.6 1.6 0.01 PGF 215179_x_at 10.1 1.7 <0.001 HIF1A 200989_at 11.2 1.9 0.001 SOD2 215223_s_at 7.7 2.3 0.001 ETS1 224833_at 9.9 2.7 0.001 S1PR1 204642_at 3.2 3.2 <0.001 PTPRJ 227396_at 6 4 0.001 FGF9 206404_at 2.3 6.3 <0.001
Symbol Probeset Expr. BMPC ∆ MBC P-Value MBC
BMP6 206176_at 10.8 -8 <0.001 TIMP1 201666_at 11.6 -7.3 <0.001 TIMP2 203167_at 12 -7 <0.001 DAPK1 203139_at 7.6 -4.9 0.001 CALR 214315_x_at 9.1 -4.2 0.001 FOXO3 204132_s_at 9.3 -3.9 <0.001 JAG1 216268_s_at 7.8 -3.6 <0.001 ERAP1 210385_s_at 10 -3.5 0.001 AKAP12 210517_s_at 5.6 -3.3 0.001 ACVR1 203935_at 7.6 -3 <0.001 EGR1 201693_s_at 8.2 -2.7 <0.001 HEY1 44783_s_at 8.7 -2.6 <0.001 ZFP36 201531_at 13.8 -1.2 <0.001 WARS 200629_at 11.3 -0.9 0.03 ACVR2A 205327_s_at 7.7 -0.5 0.01 SCYE1 202541_at 7.1 0.9 0.004 ZFP36L1 211962_s_at 9.5 2 0.003 COL4A3 222073_at 7.7 2.8 <0.001 HTATIP2 210253_at 5.3 3.2 <0.001
A
B
Genes with differential expression between normal BMPCs and MBCs as determined by EB statistics and Benjamini-Hochberg correction for multiple testing of genes expressed at least once in the training and validation group. (A) Proangiogenic and (B) antiangiogenic genes.
1. Angiogenesis in MM is the result of the tumor burden and mediated by proangiogenic factors appearing at the MGUS stage (expression of VEGF, bFGF, and their receptors at a similar level in MGUS, smoldering [SMM], and active MM).41
However, bFGF is neither expressed by BMPCs nor a larger proportion of MMCs (Table 1); it is, however, expressed in all mesenchymal stromal cell samples (n⫽ 19, data not shown); thus, lack of expression cannot be attributed to a defective probe set. VEGFA, in turn, is already expressed in BMPCs.
2. An “angiogenic switch” takes place at the MMC stage resulting from the expression of oncogenes (c-myc, c-fos, c-jun, ets-1) coding for angiogenic factors as a consequence of
immunoglobu-lin-translocations and genetic instability of plasma cells,42
lead-ing to an increased bFGF expression by MMCs. Whereas almost all MMCs show chromosomal aberrations,43c-myc, c-fos, and
c-jun are already expressed at BMPC stage and do not show a significant up-regulation in MMCs (Table 1). Ets-1 is not expressed in any of the BMPC or MMC samples.
3. A loss of antiangiogenic activity mediated by down-regulation of antiangiogenic factors (in MMCs or indirectly the BMME) is necessary for switch MGUS to MM.41Jakob
et al44 had derived the hypothesis from the fact that the
angiogenic potential of BM sera is not completely abrogated by antibodies against bFGF45or VEGF.46Further evidence
Table 3. Differential gene expression between normal and malignant plasma cells as well as between early and late stage myeloma within the validation group
Symbol Probeset Expr. Early ∆ Late P -Value Late PF4 206390_x_at 8.7 -1.2 <0.001 CXCL10 204533_at 2.9 -0.7 <0.001 THBS1 201110 _s_at 2.6 -0.3 0.001 ERAP1 210385_s_at 10 0.5 0.005 IFI16 208966_x_at 10.5 0.5 0.007 Symbol Probeset Expr. BMPC ∆ MM P -Value MM
HGF 210997_at 3.1 5.4 <0.001 ADM 202912_at 8.3 3.1 0.001 MET 203510_at 6 2.1 0.002 HDGF 200896_x_at 9.4 1.6 <0.001 GPI 208308_s_at 10.4 1.2 0.01 IGF1 209541_at 9.1 1.1 0.03 IL6ST 212195_at 11.2 0.8 0.05 TERT 207199_at 4.3 -0.7 0.03 MYH9 211926_s_at 7.4 -1 0.01 TF 203400_s_at 4 -1.4 0.003 TEK 217711_at 5.9 -1.4 0.001 CXCL2 209774_x_at 4 -1.4 0.002 NRP1 212298_at 4.3 -1.6 <0.001 IL1B 39402_at 5.1 -1.7 0.02 CCL2 216598_s_at 4.7 -2.3 <0.001 IL8 202859_x_at 7.6 -2.7 0.01 PLAUR 210845_s_at 7.7 -2.8 <0.001 HIF1A 200989_at 11.2 -2.8 0.006 PPBP 214146_s_at 10.2 -4.3 <0.001 CXCL12 209687_at 11.6 -5.2 <0.001
Symbol Probeset Expr. Early ∆ Late P -Value Late NCL 200610_s_at 12.7 0.6 <0.001 IL6 205207_at 2.3 0.4 0.03 YARS 212048_s_at 11.8 0.3 0.006 PGF 215179_x_at 10.1 0.2 0.02 PLAUR 210845_s_at 7.7 -0.5 0.02 CAMP 210244_at 3.2 -0.6 0.002 F13A1 203305_at 3.4 -0.7 0.002 TNFSF13 210314_x_at 6.2 -0.9 <0.001 NRP1 212298_at 4.3 -0.9 <0.001 CXCL16 223454_at 5.9 -1.1 <0.001 PPBP 214146_s_at 10.2 -1.3 0.005 CXCL12 209687_at 11.6 -2.5 <0.001
Symbol Probeset Expr. BMPC ∆ MM P -Value MM
PF4 206390_x_at 8.7 -2.2 0.01 AKAP12 210517_s_at 5.6 -2 0.02 TIMP2 203167_at 12 -1.9 0.04 LAMA5 210150_s_at 8.7 -1.3 0.001 SERPINF1 202283_at 3.2 -0.8 <0.001 SCYE1 202541_at 7.1 0.9 0.01 ACVR1 203935_at 7.6 1.2 0.003 ACVR2B 220028_at 3.8 1.8 <0.001
Symbol Probeset Expr. MGUS ∆ MM P-Value MM
PF4 206390_x_at 8.4 -1.9 0.002
IFI16 208966_x_at 9.3 1.4 <0.001
Symbol Probeset Expr. MGUS ∆ MM P-Value MM
NCL 200610_s_at 11.4 1.3 <0.001 EGFL7 218825_at 2.9 -0.4 0.05 PLAUR 210845_s_at 5.9 -0.9 0.01 NRP1 212298_at 3.8 -1.1 <0.001 TNFSF13 210314_x_at 8.2 -1.6 <0.001 CXCL12 209687_at 8.5 -2.1 0.01 PPBP 214146_s_at 8.1 -2.2 0.009
A
iA
iiB
iB
iiC
iC
iiGenes with differential expression between normal (BMPC) and malignant plasma cells (MMC) as determined by EB statistics and Benjamini-Hochberg correction for multiple testing of genes expressed at least once in the training and validation group. (Ai) Proangiogenic and (Aii) antiangiogenic genes. (Bi) Proangiogenic and
(Bi) anti-angiogenic genes differentially expressed between early-stage (MGUS⫹ MMI) and late-stage (MMII ⫹ MMIII) myeloma. (Ci) Proangiogenic and (Cii) antiangiogenic
was indicated by a reported similar expression level of bFGF and VEGF by MMCs between MGUS, SMM, active MM,41
and an in vitro inhibitory effect of MGUS samples compared with SMM or active MM.41However, in the latter case, no
comparison was made to BMPC serum, and there has not been shown an inhibitory effect compared with medium. In
general, the expression level of antiangiogenic genes re-mains fairly constant, with a surplus of proangiogenic over antiangiogenic genes (Tables 1, 3).
4. A further discussion is whether the induction of angiogenesis (ie, MVD) correlates with tumor load (plasma cell infiltra-tion [PCI] in the BM) or MMC proliferainfiltra-tion.2,8Vacca et al
Table 4. Differential gene expression between the whole bone marrow from normal donors (ND-WMB) and myeloma patients (MM-WBM) within the validation group
Symbol Probeset Expr. ND-WBM ∆ MM-WBM P-Value MM-WBM cor. with PCI P-Value
IGF1 209541_at 2.1 2.7 0.01 0.35 0.01 IL15 205992_s_at 2.7 1.8 0.02 0.29 0.03 IL6ST 212195_at 7.4 1.7 0.005 0.41 0.002 ELK3 221773_at 6.3 1.3 0.01 0.27 0.04 EGFL7 218825_at 3 -0.5 0.02 0.06 0.7 GRN 216041_x_at 11.6 -0.8 0.05 -0.19 0.2 GPI 208308_s_at 11 -1 0.04 -0.33 0.02 MYH9 211926_s_at 8.7 -1.5 0.04 -0.15 0.3
Symbol Probeset Expr. ND-WBM ∆ MM-WBM P-Value MM-WBM cor. with PCI P-Value
ACVR1 203935_at 3.2 1.1 0.04 0.38 0.005 ACVR2A 205327_s_at 3.1 1.1 0.02 0.56 <0.001 BMPR2 225144_at 3.9 1.4 0.02 0.39 0.004 BMP6 206176_at 2.7 3.2 0.005 0.45 <0.001
A
B
Expression as determined by EB statistics and Benjamini-Hochberg correction for multiple testing of genes expressed at least once in the training and validation group. Depicted as well is the correlation (cor) of these with plasma cell infiltration (PCI). (A) Proangiogenic and (B) antiangiogenic genes.
ADM CTGF TGFA VEGF
-2 5 -2 0 -1 5 -1 0 -5 pMMC XG-19 OPM-2 VEGF pMMC (MGUS) VEGF
A
B
iB
iiB
iiiB
ivFigure 3. Validation of gene expression by quantitative real-time PCR and flow cytometry. Expression of ADM, CTGF, TGFA, and VEGA as determined by
(A) quantitative real-time PCR. Shown are⫺dCt values (reference gene 18S RNA). (B) Flow cytometric analysis of intracellular VEGF in (i) one MGUS sample (pMMC,
reported a correlation of MVD with the labeling index (LI) but not with the PCI.2Rajkumar et al reported initially the same
result8; in a larger series of patients, however, they found a
correlation of MVD with PCI.47Niemoller et al found MVD to
increases with disease progression and to correlate with PCI and B2M.48 Both hypotheses sound convincing: Angiogenesis is
needed for increased proliferation and infiltration, as both rely on
nutrition supply. In our data, however, the PCI does not signifi-cantly correlate with the expression of any proangiogenic or antiangiogenic gene, neither does the LI (n⫽ 67) but for BIRC5 (survivin), a gene associated with proliferation. A possible explanation is that increased LI and PCI are independent surrogates for advanced (vs MGUS or SMM) disease: PCI correlates with Salmon/Durie-stage, as does LI.49
Table 5. Secreted levels of VEGF, IGF-1, HGF, IL-15, and TGFA as measured by enzyme-linked immunosorbent assay
HMCL pMMC BM serum (MM) BM serum (ND) Samples 10 2 10 3 VEGF (pg/mL) 9326 ± 4423 812 ± 1103 5008 ± 3830 2699 ± 1343 IGF-1 (pg/mL) 34 ± 41 28 ± 19 118943 ± 41985 144418 ± 47638 HGF (pg/mL) 1119 ± 1986 541 ± 596 2750 ± 1346 1258 ± 741 IL-15 (pg/mL) 1,4 ± 1,0 0,01 ± 0,01 21 ± 20 38 ± 19 TGFA (pg/mL) 40 ± 38 25 ± 35 70 ± 44 95 ± 48
Mean values⫾ SD are given.
HMCL indicates human myeloma cell line; pMMC, primary myeloma cells; BM, bone marrow; MM, multiple myeloma; and ND, normal donor.
Medium control Positive control Negative control
MBC1 MBC2 MBC3 BMPC1 BMPC2 BMPC3 MMC1 MMC2 MMC3 U266 XG-10 SKMM-2 tubule dev e lopment 0 .8 1 .2 1 .6 2. 0 Medium MBC BMPC MMC HMCL * * *
A
B
Figure 4. Induction of in vitro angiogenesis. Endothelial cell growth in the AngioKit model. (A) Box plot summarizing the ELISA results. Unlike those of MBC supernatants of BMPCs, pMMCs and HMCLs show a significant induction of tubule formation compared with medium control. *Significant difference compared with medium
control (P⬍ .05). (B) Immunostaining with monoclonal anti-human CD31 antibody: medium control (RPMI 1640), positive control (VEGF), negative control (suramin) as well as
supernatants of memory B-cell samples (MBC1-3), normal bone marrow plasma cell samples (BMPC1-3), primary myeloma cell samples (pMMC1-3), and the myeloma cell
Angiogenesis in multiple myeloma: hypothetic model
Based on the data presented in this paper, we propose a new model of angiogenesis in MM comprising 3 hypotheses (H1-H3).
H1: BMPCs induce controlled angiogenesis. The function of
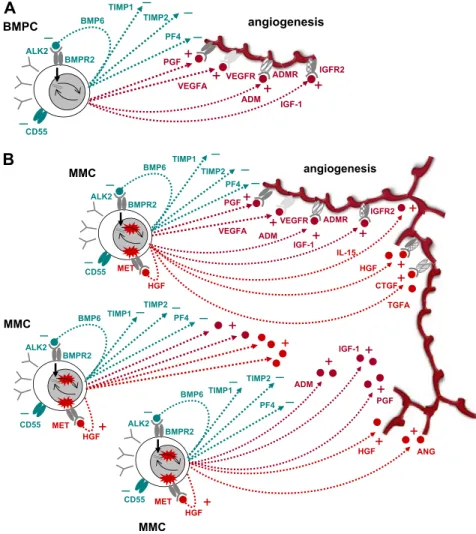
BMPCs is to survive for several years and to produce huge quantities of antibodies (“antibody factories”). BMPCs therefore induce, in interaction with the BMME, a favorable microenviron-ment (“niche”), including blood-vessel supply, by producing and inducing the production of a slight surplus of proangiogenic over antiangiogenic factors. The concomitant expression of the latter allows (1) limiting the extent of the angiogenic stimulus to the vicinity of the BMPCs and (2) increasing angiogenesis in case of need by concomitant loosening of antiangiogenic breaks and increased production of proangiogenic factors.
Five lines of evidence support this hypothesis: (E1) BMPCs express proangiogenic factors, such as VEGFA, ADM, and IGF-1, and antiangiogenic factors, such as TIMP1, TIMP2, or BMP6 (Table 1; Figure 2). (E2) BMPCs are found in close proximity to blood vessels in the BM,50indicating an interaction between the
2 cell types. (E3) Angiogenic factors are relevant for endothelial cell survival and maintenance of blood vessel integrity.51(E4) The
strongest evidence is given by the fact that supernatants of BMPCs induce angiogenesis in our in vitro assay compared with medium controls (Figure 4). (E5) This induction cannot be seen for supernatants of MBCs and is therefore not a general characteristic of cells (of B-cell lineage). At gene expression level, MBCs show a significantly lower expression of several proangiogenic cytokines
compared with BMPCs, but likewise of antiangiogenic factors, such as TIMP1 (Table 2; Figure 2). A possible explanation for the latter is the lack of a necessity for antiangiogenic regulation if no angiogenesis induction is present (see Figure 4).
H2: An increase in the number of (BM) PCs increases angiogenesis. Given a slight excess of production of
proangio-genic over antiangioproangio-genic factors in BMPCs (H1), it follows that an increase in plasma cell number yields an increase of the absolute surplus of proangiogenic factors produced in the BM. (Despite that the relative quantities remain the same, the absolute surplus in proangiogenic factors increases.) In this line of argumentation, it would not be necessary that accumulating MMCs show a differen-tial expression of proangiogenic and antiangiogenic genes com-pared with BMPCs.
This hypothesis is supported by several lines of evidence: (E1) Comparing the percentage of plasma cells in the normal BM of approximately 0.5% with the infiltration rates seen in advanced MM of more than 50% and the increase in BM cellularity, the amount of plasma (myeloma) cells can be estimated to be a factor of at least 100 times higher compared with that in normal BM. Hence, a surplus in proangiogenic over antiangiogenic stimulation (on the basis of H1) would follow. (E2) If an increased rate of angiogenesis is the result of a slight excess of production of proangiogenic over antiangiogenic factors present already in BMPCs, all MM patients should show increased BM angiogenesis, which is the case. (E3) MMCs do not show a significantly higher median number of expressed proangiogenic (45) or antiangiogenic
VEGFA BMP6 BMPR2 ALK2 BMPC
+
VEGFR IGF-1 TIMP1 CD55 TIMP2 angiogenesis–
–
–
+
PF4–
ADM ADMR IGFR2+
PGF+
–
A
– MMC VEGFA BMP6 BMPR2 ALK2 MMC +VEGFR MET IGF-1 TIMP1 CD55 TIMP2 angiogenesis – – – + PF4 PGF ADM ADMR IGFR2 + IL-15 + HGF CTGF HGF + IGF-1 + ADM + PGF ANG HGF BMP6 BMPR2 ALK2 MET CD55 – HGF BMP6 BMPR2 ALK2 MMC MET CD55 – HGF – – + + + TIMP1 TIMP1 – – – TIMP2 – PF4 – TIMP2– PF4 – + + + + + + TGFAB
Figure 5. Schematic representation of findings. (A) Interaction of normal BMPCs that produce proangio-genic (dark red) and antiangioproangio-genic (dark green) factors, respectively. At a normal ratio, angiogenesis is restricted to the surrounding of BMPCs. (B) By proliferation and increasing number, aberrant as well as normal BMPC factors accumulate in the bone marrow microenviron-ment, inducing widespread angiogenesis.
(31) genes, and neither a single factor nor a factor combination is aberrantly expressed in all MMCs (Table 1; see also point E1 in “H3”). (E4) The BMME mirrors presence of (malignant) plasma cells, evidenced by ND-WBM clustering together (Figure S2) and the predictability of “being” ND- versus MM-WBM with an error rate of 9% (Table S5B). Indeed, of 12 genes differentially expressed between ND- and MM-WBM, 10 are already expressed by BMPCs and 7 of these correlate positively with PCI (Table 4). (E5) There is no significant association with chromosomal aberra-tions detected by iFISH of a single proangiogenic or antiangiogenic factor but for the association of FGFR3 expression and t(4;14). (E6) There is no association with surrogates of tumor mass, such as B2M or International Staging System-stage, or clinical parameters. (E7) Despite a well-known increase of surrogates of MVD or BM perfusion as assessed by dce-MRI,4no association with angiogenic
gene expression could be found.
H3: Aberrantly expressed angiogenic factors by MMCs fur-ther increase BM angiogenesis in MM and might lead to different angiogenic patterns. Evidence is given by the following
observa-tions: (E1) Despite the lack of a single aberrantly expressed factor or factor combination, 89% to 97% of MMC samples in different cohorts (TG, VG) show an aberrant expression of at least one of the angiogenic factors HGF, IL-15, ANG, APRIL, CTGF, or TGFA (Table 1). (E2) Based on expression of (anti)angiogenic genes, “being” MBC/BMPC/MMC/HMCL can be predicted fairly well (error rate: 3% TG, 3% VG) and populations separate in an unsuper-vised clustering (Figure 2D, supplemental Figure 1D; supplemental Table 5A) denoting a characteristic expression difference. (E3) Superna-tants of MMCs and HMCLs induce higher in vitro angiogenesis compared with BMPCs (Figure 4). HMCLs here retain the proangio-genic pattern of MMCs, in analogy with HMCLs conserving signatures of BM dependence or independence.26
Based on these observations, angiogenesis seems to be a general feature of MM, not an (additional) risk factor per se for patients treated with HDT and ASCT. Another subject for further studies given these findings is whether angiogenesis may not be critical for MM pathogenesis, but just an epiphenomenon driven by the accumulation of (malignant) plasma cells and a production of proangiogenic cytokines that have a dual role as growth and survival factors for MMCs, eg, IGF-1.52Likewise, aberrant
expres-sion of the HGF receptor MET by 70% of MMCs (Table 1; Figure 2) might allow these to make use of the HGF levels present within the BM (Table 1). This possibility would arguably explain the lack of major differences in gene expression in contrast to the striking angiogenesis induction seen in the myelomatous BM compared with normal persons. A further question is if or to what extent inflammatory cells (ie, macrophages, mast cells, lymphocytes) may also contribute substantially to angiogenesis induction in myeloma. In conclusion, in contrast to MBCs, BMPCs express a surplus of proangiogenic over antiangiogenic genes transmitting to induction of in vitro angiogenesis. Thus, already an accumulation of BMPCs can induce a basal level of angiogenesis. Aberrant expression of proangiogenic genes and down-regulation of antiangiogenic genes
by MMCs further increase the angiogenic stimulus already induced by BMPC genes, together explaining the presence of BM angiogen-esis at various degrees in all myeloma patients (Figure 5). Chromosomal aberrations and changes in gene expression driving the evolution to MGUS and further to active MM thereby lead to the slow but progressive accumulation of plasma cells/MMCs, which “draw” their own supply with blood and nutrients by an induced and increased angiogenesis. This leads to a gradual change of the BMME (“BMME-switch,” Figure 5), providing in turn supply (nutrition, O2) and increased growth factor stimulation
(proangiogenic cytokines with dual role) that help progressively overruling cell cycle breaks on the basis of altered D-type cyclin expression characteristic for MM.
Acknowledgments
The authors thank Bart Barlogie and John D. Shaughnessy for the opportunity to validate our expression data on their cohort of patients; Stefan Delorme for participation in obtaining the dce-MRI data; Ve´ronique Pantesco, Katrin Heimlich, and Maria Do¨rner for technical assistance; and Rainer Saffrich for help in microscopic imaging.
This work was supported in part by grants from the Hopp-Foundation, Germany; the University of Heidelberg, Germany; the National Center for Tumor Diseases, Heidelberg, Germany; the Tumorzentrum Heidelberg/Mannheim, Germany; the European Myeloma Stem Cell Network funded within the 6th Framework Program of the European Community; and the Ligue Nationale Contre Le Cancer (e´quipe labellise´e), Paris, France. It is also part of a national program called Carte d’Identite´ des Tumeurs funded by the Ligue Nationale Contre le Cancer, France.
Authorship
Contribution: D.H. designed research, wrote the paper, and partici-pated in the microarray experiments; J.M. participartici-pated in the analyzing of the data; T. Meissner and A.B. performed statistical analysis; A.S. performed experiments and participated in the writing of the paper; H.G. participated in the analyzing of the data and in the writing of the paper; K.M., T.R., and M.C. participated in the analyzing of the data; J.H. collected bone marrow samples as well as clinical data and contributed in performing the dce-MRI experiments and analyzing of the data; M.H., U.B., and J.-F.R. collected bone marrow samples and clinical data; J.D.V. partici-pated in the microarray experiments; A.J. contributed in perform-ing the iFISH experiments; and B.K. and T. Mo¨hler participated in the analyzing of the data and in the writing of the paper.
Conflict-of-interest disclosure: The authors declare no compet-ing financial interests.
Correspondence: Dirk Hose, Medizinische Klinik V, Universita¨-tsklinikum Heidelberg, Im Neuenheimer Feld 410, 69120 Heidel-berg, Germany; e-mail: [email protected].
References
1. Kyle RA, Rajkumar SV. Multiple myeloma.
N. Engl J Med. 2004;351:1860-1873.
2. Vacca A, Ribatti D, Roncali L, et al. Bone marrow angiogenesis and progression in multiple my-eloma. Br J Haematol. 1994;87:503-508. 3. Vacca A, Ria R, Semeraro F, et al. Endothelial
cells in the bone marrow of patients with multiple myeloma. Blood. 2003;102:3340-3348.
4. Nosas-Garcia S, Moehler T, Wasser K, et al. Dy-namic contrast-enhanced MRI for assessing the disease activity of multiple myeloma: a compara-tive study with histology and clinical markers.
J Magn Reson Imaging. 2005;22:154-162.
5. Kumar S, Fonseca R, Dispenzieri A, et al. Bone marrow angiogenesis in multiple myeloma: effect of therapy. Br J Haematol. 2002;119:665-671.
6. Sezer O, Jakob C, Eucker J, et al. Serum levels of the angiogenic cytokines basic fibroblast growth factor (bFGF), vascular endothelial growth factor (VEGF) and hepatocyte growth factor (HGF) in multiple myeloma. Eur J Haematol. 2001;66:83-88.
7. Hillengass J, Wasser K, Delorme S, et al. Lumbar bone marrow microcirculation measurements