HAL Id: hal-02171956
https://hal.sorbonne-universite.fr/hal-02171956
Submitted on 3 Jul 2019
HAL is a multi-disciplinary open access archive for the deposit and dissemination of sci-entific research documents, whether they are pub-lished or not. The documents may come from teaching and research institutions in France or abroad, or from public or private research centers.
L’archive ouverte pluridisciplinaire HAL, est destinée au dépôt et à la diffusion de documents scientifiques de niveau recherche, publiés ou non, émanant des établissements d’enseignement et de recherche français ou étrangers, des laboratoires publics ou privés.
Epistasis detectably alters correlations between genomic
sites in a narrow parameter window
Igor Rouzine, Gabriele Pedruzzi
To cite this version:
Igor Rouzine, Gabriele Pedruzzi. Epistasis detectably alters correlations between genomic sites in a narrow parameter window. PLoS ONE, Public Library of Science, 2019, 14 (5), pp.e0214036. �10.1371/journal.pone.0214036�. �hal-02171956�
Epistasis detectably alters correlations
between genomic sites in a narrow parameter
window
Gabriele Pedruzzi, Igor M. RouzineID*
Sorbonne Universite´ , Institute de Biologie Paris-Seine, Laboratoire de Biologie Computationelle et Quantitative, LCQB, Paris, France
Abstract
Different genomic sites evolve inter-dependently due to the combined action of epistasis, defined as a non-multiplicative contribution of alleles at different loci to genome fitness, and the physical linkage of different loci in genome. Both epistasis and linkage, partially compen-sated by recombination, cause correlations between allele frequencies at the loci (linkage disequilibrium, LD). The interaction and competition between epistasis and linkage are not fully understood, nor is their relative sensitivity to recombination. Modeling an adapting pop-ulation in the presence of random mutation, natural selection, pairwise epistasis, and ran-dom genetic drift, we compare the contributions of epistasis and linkage. For this end, we use a panel of haplotype-based measures of LD and their various combinations calculated for epistatic and non-epistatic pairs separately. We compute the optimal percentages of detected and false positive pairs in a one-time sample of a population of moderate size. We demonstrate that true interacting pairs can be told apart in a sufficiently short genome within a narrow window of time and parameters. Outside of this parameter region, unless the popu-lation is extremely large, shared ancestry of individual sequences generates pervasive sto-chastic LD for non-interacting pairs masking true epistatic associations. In the presence of sufficiently strong recombination, linkage effects decrease faster than those of epistasis, and the detection of epistasis improves. We demonstrate that the epistasis component of locus association can be isolated, at a single time point, by averaging haplotype frequencies over multiple independent populations. These results demonstrate the existence of funda-mental restrictions on the protocols for detecting true interactions in DNA sequence sets.
Introduction
Epistasis is inter-dependence of the fitness effects of mutations occurring at different loci. The term ‘epistasis’ in population genetics refers to the fact that mutations occurring at different genomic sites affect the Darwinian fitness of an organism, i.e., its average progeny number, in a non-multiplicative fashion. At the cell biology level, this phenomenon is caused by various biological interactions [1–4]. In biological systems, amino acids in proteins domains interact
a1111111111 a1111111111 a1111111111 a1111111111 a1111111111 OPEN ACCESS
Citation: Pedruzzi G, Rouzine IM (2019) Epistasis
detectably alters correlations between genomic sites in a narrow parameter window. PLoS ONE 14 (5): e0214036.https://doi.org/10.1371/journal. pone.0214036
Editor: Badri Padhukasahasram, Illumina Inc,
UNITED STATES
Received: March 5, 2019 Accepted: May 18, 2019 Published: May 31, 2019
Copyright:© 2019 Pedruzzi, Rouzine. This is an open access article distributed under the terms of theCreative Commons Attribution License, which permits unrestricted use, distribution, and reproduction in any medium, provided the original author and source are credited.
Data Availability Statement: All relevant data are
within the paper and its Supporting Information files.
Funding: Author IMR is funded by Agence National
de Recherche, France, grant J16R389. The funders had no role in study design, data collection and analysis, decision to publish, or preparation of the manuscript.
Competing interests: The authors have declared
with each other. The resulting networks of interactions that include direct protein-protein binding and allosteric effects, shape the gene regulation and metabolic networks. Epistasis is a widespread property of biological networks [2,5–8] and a subject of intense studies. The vital role it plays in the genetic evolution of populations and the heritability of complex traits is well established. The existing estimates indicate that the variation of an inherited trait across a pop-ulation can only partially be explained by the additive contributions from the relevant alleles. On average, 70% of the inheritance may be due to epistasis or epigenetic effects [9]. Epistasis defines the evolutionary paths and creates fitness valleys, i.e., intermediate genetic variants with reduced fitness [10–12].
A crucial biological scenario is a viral population adapting to the abrupt changes in external conditions. Examples include the transmission to a new host, the invasion of a new organ, or the process of immune evasion or the development of drug resistance. Typically, virus adapta-tion consists of primary mutaadapta-tions followed by a cascade of several compensatory (helper) mutations [13–18]. These mutations help the adapting virus to pass through a fitness valley [11]. During this process, compensatory mutations rescue the replicative fitness of virus while preserving its resistant phenotype [13,15,19].
However, epistasis is not the only force causing inter-dependence in the evolution of genomic regions. The other dominant factor is the host of linkage effects due to the fact that different loci in the absence of recombination (or under limited recombination) are linked, i.e., inherited together, as a set [20,21]. The consequences of linkage include Fisher-Muller effect (clonal interference), genetic hitchhiking and genetic background effects, and Hill-Robertson interference between genetic drift and selection [21–23]. The effects of linkage on evolution in the presence of selection is well understood theoretically [12,24–31]. The theory shows that linkage significantly slows adaptation, enhances accumulation of deleteri-ous mutations, and changes the shape of the phylogenetic tree [32,33]. The magnitude of linkage effects grows rapidly with the number of loci,L. Recombination partly offsets link-age effects and accelerates evolution [34–40] and competes with epistasis [41]. Epistasis has been shown to be potentially important for the evolution of recombination in a two-locus model [42,43].
Another consequence of linkage, which represents the focus of the present work, is the strong interaction between the evolutionary trajectories of different sites. LD stemming from linkage is easy to confuse with epistasis effects. Linkage effects are stochastic, due to stochastic sampling of genomes and random nature of mutations. They become small only in populations that are exponentially large in the number of sitesL [25]. Working with sequence data from real populations, it is often unclear how to discriminate the effects of shared ancestry from those of epistasis, and which of the two evolutionary forces dominates in each case (for a comprehensive review, see [1,44,45]). Therefore, despite of a consider-able theoretical and experimental effort, detecting epistasis from genomic data remains a challenge.
In the present work, we offer an evolutionary explanation for the observed difficulty of the detection of epistasis from one-time data set. The idea is to generate mock data using a Monte-Carlo model of evolution and then try to discriminate between effects of linkage and epistasis. We use a panel of six pairwise LD measures to compare their distributions between epistatic and random pairs in a broad range of model parameters. We also use 3D and 2D maps of all possible combinations of LD measures and employ an optimization algorithm based ona pri-ori knowledge to estimate the best, theoretically possible identification of epistatic pairs. As a result, we delineate the region of time and model parameters where the epistatic pairs can be detected against the linkage background. Finally, we investigate the role of recombination and the effects of averaging over multiple independently-evolving populations.
Results
Computer simulation of evolution
We consider a haploid population ofN genomic sequences comprised of L sites, where L >> 1, and either a favorable or deleterious allele is present at each site. Evolution of the population between discrete generations is simulated using a Wright-Fisher model including the evolu-tionary factors of random mutation with the rateμ per site, random genetic drift, and natural selection, as described inMethods. Natural selection includes positive (antagonistic) epistatic interaction between selected pairs of deleterious alleles. A simple case of genomes with uni-form selection coefficients0and uniform epistatic strength,E, is considered. We also assume
that epistatic pairs are isolated, i.e., that each genomic site interacts with only one site. The ini-tial population is randomized as it is done in virus passage experiments, with an average allelic frequencyf0. In most of our work, we initially neglect the factor of recombination and
primar-ily focus on asexual evolution, but lift this restriction in the end and explore broad parameter ranges. We aim to simulate the detection of epistatic pairs and identify the best conditions for detection theoretically.
Measures of linkage disequilibrium (LD)
Various haplotype-based measures based on known haplotype frequencies have been proposed to characterize the allelic association between loci. We will list four measures, as follows.
Lewontin’s measure of statistical correlation between alleles at different loci has a form [46] D0 ¼ D Dmax ;D ¼ fij fi fj ð1Þ Dmax¼ maxf fifj; ð1 fiÞð1 fjÞg;D < 0 minffið1 fjÞ; ð1 fiÞfjg;D > 0 (
Herefijis the average frequency of a bi-allelic haplotype of locii and j, and Dmaxis a
nor-malization coefficient making sure thatD02 [0, 1].
An alternative measure is Pearson correlation coefficient between pairs of locir, expressed as [47] r ¼ D= ffiffiffiffiffiffiffiffiffiffiffiffiffiffiffiffiffiffiffiffiffiffiffiffiffiffiffiffiffiffiffiffiffiffi fið1 fiÞfjð1 fjÞ q ð2Þ More recently, Wu and colleagues [48] have proposed another statistical marker of linkage disequilibrium which has the bi-allelic form
WU ¼ logf11f00
f01f10
ð3Þ which represents the logarithm of theZ-measure proposed previously by Kimura [49].
In our recent work [50], we introduced another bi-allelic measure UFE ¼ 1 logðf11=f00Þ
logðf01f10=f00 2
Þ ð4Þ
The advantage of this measure with respect to previous three is that it has a direct meaning in terms of fitness. For isolated interacting pairs, when frequencies inEq 4are ensemble-aver-aged, it represents the degree of mutual compensation of two deleterious mutations, UFE =E (seeMethodsbelow). Here the valueE = 0 corresponds to the absence of compensation, and
E = 1 to full mutual compensation of the two mutations. We checked that the singularity inEq 4atf10f01=f00
2
does not affect our results.
Below we investigate the effect of linkage for interacting and noninteracting pairs of loci using the measures defined in Eqs1–4. Also, we employ an optimization algorithm that, exploiting a priori knowledge of the correct epistatic pairs, puts the best possible threshold between the two distributions of LD. We consider different combinations of two or three LD measures to obtain the best detection possible.
LD of epistatic and non-epistatic pairs are distinct in a narrow parameter
window
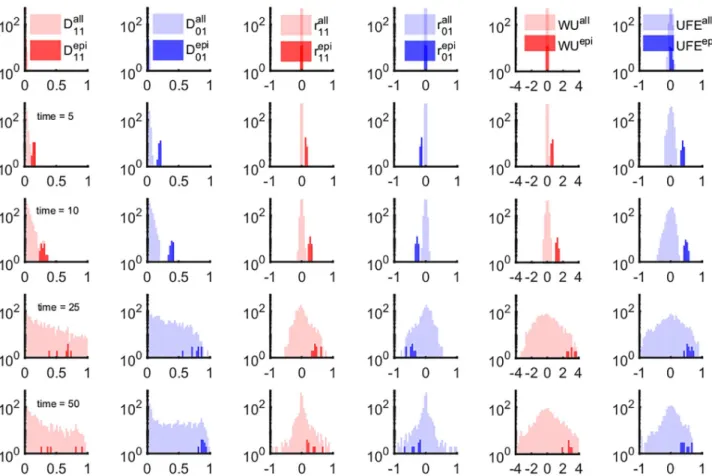
We started by plotting the distribution of six LD measures calculated fromEq 1over individual pairs of sites, at different times (Fig 1). We show separately the distribution for two subsets of pairs: the known epistatic subset (dark shade) and all the pairs (light shade). In the beginning, LD is narrowly distributed around zero, for both epistatic and non-epistatic subsets (Fig 1, row 1).
Fig 1. LD- and haplotype-based measures of epistasis identify a narrow time window of epistasis detectability. We compared the time-dependent
distribution of 6 markers of LD shown in 6 columns. Each column shows the profile of the distribution of a measure of epistasis:D'11,D'01(Eq 1),r11,r01 (Eq 2), WU (Eq 3) and UFE (Eq 4). Different rows correspond to different time points:t = 1, t = 5, t = 10, t = 25 and t = 50. The shaded regions
correspond to the density distributions for all possible pairwise interactions (lighter color) and the known epistatic pairs (darker shade). The shaded areas are normalized distributions reflecting the fact that epistatic pairs represent a tiny fraction of the all possible pairs in a genome. The fluctuations of non-epistatic pairs increasing in time overlap onto the distributions of epistatic pairs. Parameters:N = 2 104,
s0= 0.1,L = 50, E in the range [0, 1], μL = 7 10−2. Each odd site interacts with its neighbor on the right (1–2, 3–4, 5–6, . . .) with epistatic strengthE = 0.75. Initially, sequences were random with
average allelic frequency set tof = 0.4. The negative control result in the absence of epistasis (E = 0) is presented onS1 Fig. https://doi.org/10.1371/journal.pone.0214036.g001
Subsequent time points (Fig 1, rows 2 and 3) show progressive separation of the two distri-butions. In the course of further evolution (Fig 1, rows 4 and 5), the distribution of randomly-chosen pairs, which was initially narrow and concentrated near the originE = 0, gradually expands and overlaps with the small epistatic distribution (Fig 1). This effect implies that non-epistatic pairs of sites, due to the stochastic nature of evolution, produce large LD of random sign. In this case, it is impossible to tell apart epistatic pairs from any of these measures of LD.
Results are robust to the choice of an LD measure or their combination
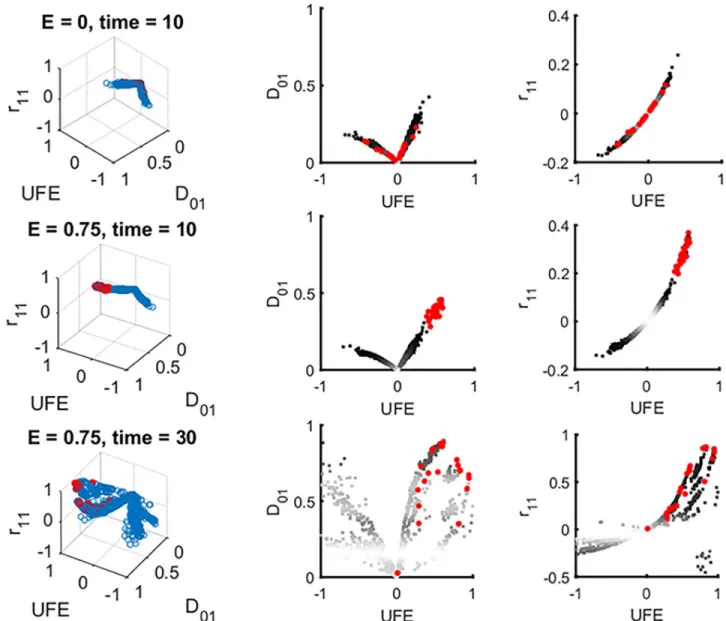
Next, we checked whether combinations of LDs used together can improve detection. We have calculated all possible combination of six LD measures inEq 2and tried to separate inter-acting and non-interinter-acting pairs using 3D and 2D scatter plots. A representative example is shown inFig 2, forE = 0, and for E = 0.75 at two time points. Other possible combinations of 2 and 3 measures are summarized inS1 Table.
We wrote an optimization algorithm which separates the cloud of interacting pairs from the cloud of non-interacting pairs in the best possible way, usinga priori knowledge about the identity of pairs (Fig 2). We adjusted the threshold to optimize the difference between the detection rare and the false positive rate. This method, employing the principle of machine learning, does not give any substantial improvement on the detection window (SeeS1 Table). For a real data sets,a priori knowledge about interacting pairs is usually unavailable, so that the detection of epistasis in a single population at one time point will be even worse than our prediction.
Clonal exclusion has a minor effect on detection window
We also attempted to improve detection by analyzing the clone structure of population and excluding the largest clones from the simulated sequences set, which comprise a significant fraction of population [28] and could contribute to noise (S1 Appendix). We have reached only a slight expansion in the time window of detection (S2andS3Figs).
Parameter sensitivity analysis confirms the narrow window of detection
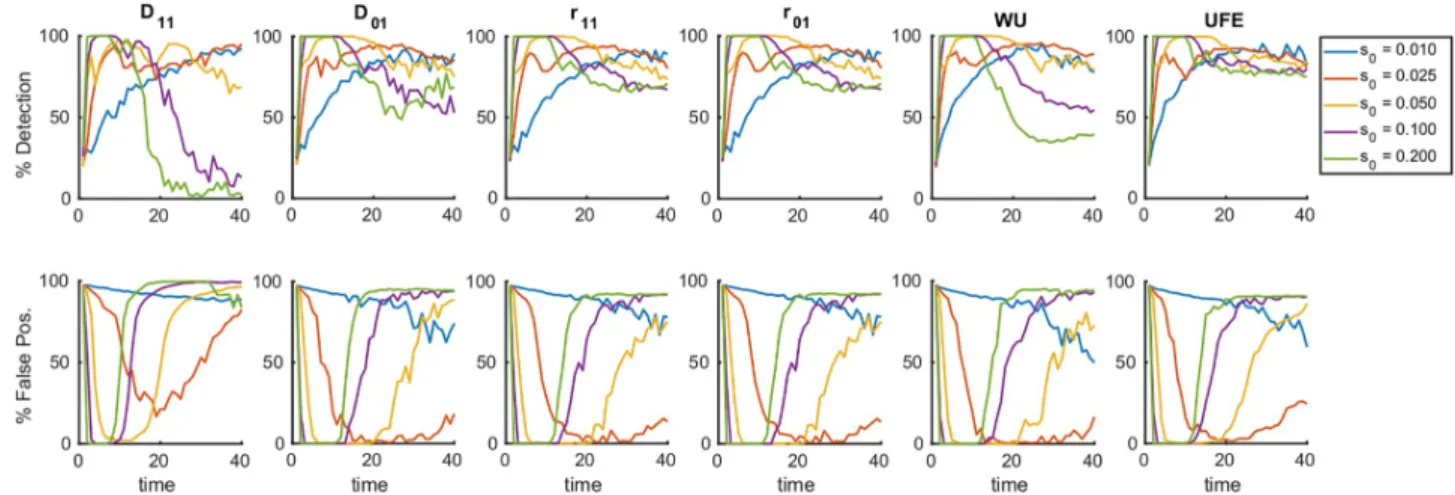
Selection coefficient. Next, we investigated how the window of detection changes withmodel parameters. We calculated the detection rate and the false positive rate for the six mea-sures of LD at different values of selection coefficient,s0(Fig 3). For each measure, the results
show an inverse scaling of the detection time window ons0. Note that the window closes at
very smalls0, where evolution is almost selectively neutral, and epistasis is never detectable. Distributed selection coefficient. Next, we conducted a sensitivity analysis with respect
to the other model parameters (S5 Fig). Firstly, we lifted the simplifying assumption of a con-stant selection coefficient,s = s0, and allowed variation ofs among sites according to a
half-Gaussian distribution. We obtain a similar dependence of the window width on the average selection coefficient (S5 Fig), although with a higher false positive rate within the detection window than for the case with constants.
Length of the genome. We found out, that sequence lengthL limits the detectability of epistasis substantially (S5 Fig). An increase of the sequence length or a reduction of the popula-tion size leads to narrowing and, eventually, disappearance of the detecpopula-tion window. These results limit the applicability of these methods to short sequences. Indeed, the number of all possible locus pairs increases with genome lengthL proportionally to L2, and the number of epistatic pairs increases only asL, so that the task of finding "the ruby in the rubbish" becomes harder at largerL [1,44,45].
Population size. We observed a very slow (logarithmic) expansion of the detection
win-dow with population sizeN (S5 Fig). This is consistent with the results of asexual evolution models, which predict a very slow logarithmic dependence onN for all the evolutionary observables, including evolution speed, genetic diversity, and the average time to most recent ancestor [25–31,35–37,39,40,51]. Only in very large populations whose size increases expo-nentially genome lengthL, linkage effects become small [25]. In these, astronomically large populations, epistasis would be easily detectable.
Fig 2. The optimization algorithm to identify ideal conditions for detection of epistasis is exemplified through the 3D scatter plot of three different measures of LD. Left: A representative example of three-dimensional scatter plots of three LD statistics, UFE,D'01andr11, plotted for all pairs of sites (blue circles) and for designated epistatic pairs (red circles). Right and middle: two-dimensional projections. The upper row corresponds to zero epistasis (E = 0, top). Second and third row are two time points in the presence of epistasis, within and outside the detection window, respectively. All
possible combinations of two and three measures have also been tested and summarized inS1 Table. At intermediate timet = 10, a distinct cloud of
epistatic pairs (red dots) cluster separately from the other pairs and, hence, are detectable (middle row). At long times, substantial overlap with non-interacting pairs contaminates detection (bottom row). To optimize detection, we define a detection threshold for each statistics and use an
optimization algorithm that minimizes the following quantity "DET +a FPOS", where a is a fitting parameter, DET represent the detection percentage,
and FPSO is the percentage of false positive, based on prior knowledge of the identity of true epistatic pairs. Parameters are as inFig 1. https://doi.org/10.1371/journal.pone.0214036.g002
Initial standing variation. We have observed a detection window in time only at the
initial frequencies of deleterious alleles above 10% (S5 Fig). At smaller frequencies, detection lapses. We can conclude that detection of epistasis in a single population studied is possible in a narrow parameter range.
Recombination improves detection
Until now, we have assumed a completely asexual evolution. In our next step, we investigated the role of recombination, parametrised by the average number of crossovers per genome,M, and by the probability of outcrossing per genome,r. We obtained that intermediate recombi-nation rates rescue the detection of epistasis by disrupting linkage and yet preserving the epis-tasis contribution to LD. At our default parameter set (Fig 1legend), we observed a significant reduction of linkage fluctuations starting fromr = 20% and M = 5 (Fig 4). The results show that LD effects of linkage are much more resistant to recombination than, for example, the evolution speed, which increases substantially already at tiny values ofr [34–40]. We found out also that extremely high levels of recombination decrease LD for epistatic pairs as well, thus rendering epistasis undetectable. Thus, there exists a narrow window of recombination rates where epistasis can be observed outside of the detection window for time and other parameters described above.
Population divergence creates strong linkage effects
In order to understand the reason behind the strong linkage effects masking epistasis, we investigated the time-dependent changes of the phylogenetic tree using a hierarchical cluster-ing algorithm (Fig 5a–5d). The initial, randomized population display a star-shaped phylog-eny, characterized by the same mean distance between all sequences and the most common sequence (Fig 5). With time, the phylogenetic tree grows branches of increasingly related sequences (Fig 5c and 5d). As simulation continues (Fig 5d), the tree becomes more lopsided, while recent mutations create short branches at the bottom. At the same time, we observe that the tree has a decreasing number of ancestors. Eventually, the tree evolves into
Bolthausen-Fig 3. Detection of epistasis is confined in a time window whose width is controlled by the mean selection coefficient. Percentile of detection and
false discovery as a function of time is averaged over 25 random simulation runs per each value ofs0, the constant selection coefficient for each allele in the sub-population. For the average over 300 runs, seeS4 Fig. The detection of epistatic pairs for a panel of measures of LD, namely,D11,D01(Eq 1),r11,
r01(Eq 2), WU (Eq 3) and UFE (Eq 4). Results from a detection protocol that maximizes the difference between the detection percentile and the false-positive fractions by tuning the detection threshold, show the same trend for all measures considered. At time ~1.5/s0generations, we observe the beginning of a transition which completely blurs the detection of epistatic interaction at time ~2.5/s0. The initial allelic frequencyf0= 0.45,s0is shown, the other parameters are as inFig 1.
Fig 4. Variation of the time window of detection with recombination. Percentile of detection and false discovery as a function of time is averaged
over 25 random simulations (runs) in a broad range of parameters values. The detection rare and false positive rate of epistatic pairs with UFE at different values ofs, randomly drawn from a half-Gaussian distribution of deleterious alleles. The presence of moderate recombination characterized by
outcrossing rater and the average number of cross-overs, M, broadens the detection window. We observe similar results for all the statistics considered
in this study (S5–S10Figs). The default parameter set isE = 0.75, with the other parameters as inFig 1. https://doi.org/10.1371/journal.pone.0214036.g004
Fig 5. Evolution of genealogy within a single, well-mixed population and comparative representation of multiple, independently evolving population. (a-d) Phylogenetic structure of a single population comprising a sample of 500 genomes at four different times:t = 0, 10, 20, and 30
generations. Mean genetic distance between genomes decreases in time, and the structure of the tree changes from a star-like shape towards a monophyletic tree (BS coalescent), with a single common ancestor. The right panel shows the reconstructed phylogenetic tree of three populations, independently evolved from the same initial random seed. At a glance, it is possible to determine that the three populations do not share much sequence homology and segregate into different, phylogenetically distinct clades.N = 20000 genomes, initial average allelic frequency f0= 0.40, other parameters as inFig 1.
https://doi.org/10.1371/journal.pone.0214036.g005
Sznitman coalescent (BSC) with a single common ancestor, previously predicted for the sta-tionary regime of traveling wave [25,29,37] (Fig 5).
Emergence of this phylogeny is coincident with the increase in the fluctuations of LD of non interacting pairs (Fig 1). The reason for strong random LD is stochastic divergence of the population from the initial state, as illustrated by clustering of three independently evolved populations (Fig 5, right). The distance between the trees obtained in separate runs increases linearly in time due to fixed beneficial mutations at randomly chosen sites. Haplotype configu-rations of the common ancestor of the population are inherited by all members of the popula-tion, with some small variation determined by the time to the most recent common ancestor. Thus, the stochastic divergence of individual populations creates strong LD with a random sign.
The use of multiple populations defeats LD fluctuations and rescues
epistatic signature
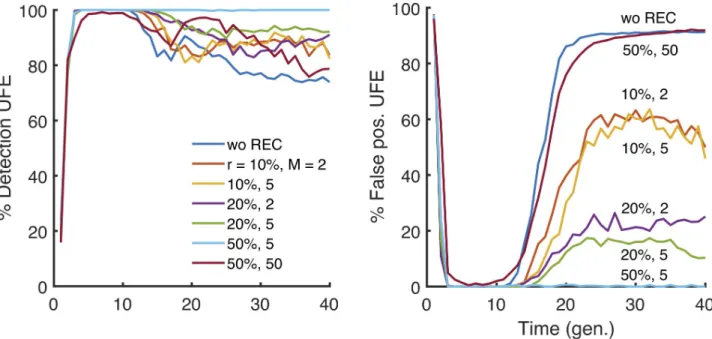
Because the linkage fluctuations arise due to stochastic divergence of the founder, the common ancestor, the natural idea is to use multiple populations to average over possible founder sequences. To test this idea, we evolved independently multiple populations at the same initial conditions and averaged the haplotype frequencies used in LD markers (Eqs.1–4) over popu-lations, for each pair of sites, separately. We found out that including a sufficient number of independent populations results in a substantial reduction of the noise and indefinite expan-sion of the window of detection (Fig 6). Qualitatively similar results are obtained for all LD markers.
Discussion
In the present work, using a Monte-Carlo simulation of a haploid population, we calculated the distributions of six measures of linkage disequilibrium and their combinations for epistatic and random locus pairs. We demonstrated that, in a single asexual population, the footprints
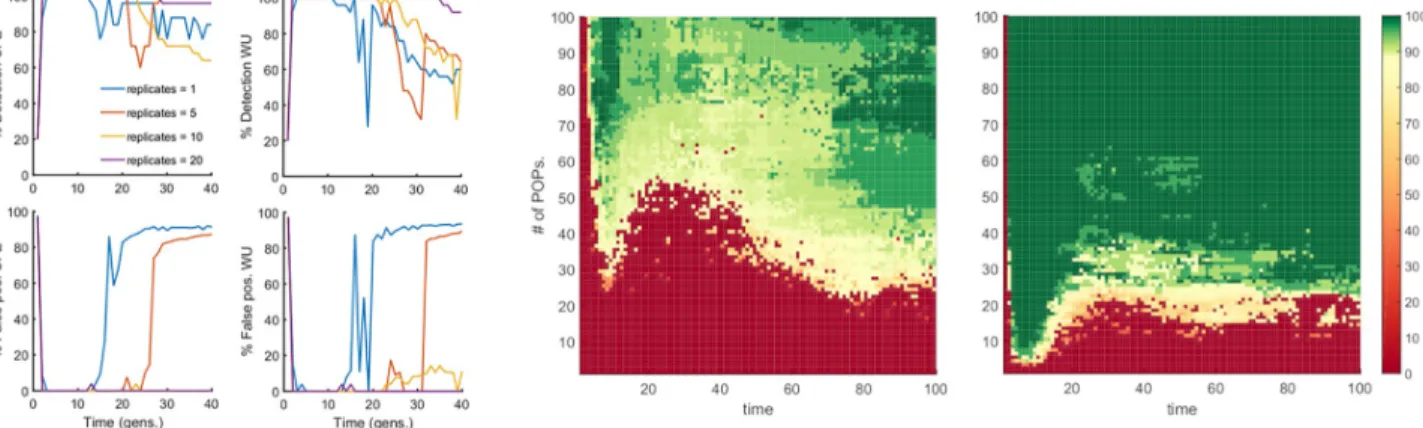
Fig 6. Detection of epistasis is rescued by simultaneous analysis of multiple independently-evolved populations. Left 4 plots: Percentile of detection
(top) and false discovery (bottom) as a function of time are presented for UFE and WU measures. Number of replicate Monte-Carlo runs is shown. The haplotype frequencies are averaged over runs, which represent independently-evolved populations. At time ~1.5/s0, we observe the beginning of a transition which completely blurs the detection of epistatic interaction for a single replicate (blue line), however, already 5 replicates are sufficient to significantly extend the detection window up to ~2.5/s0, and a higher number of replicates completely eliminate false-positive pairs, while maintaining the average detection above 80%. Parameters:E = 0.75, N = 20000, the others as inFig 1. Right: Two-dimensional color maps for UFE measure of LD, which summarize the results of a similar analysis for two population sizes:N = 100 (middle plot) and N = 1000 (right plot). Y-axis: Number of
independent populations.X-axis: time of evolution. Color shows the percentage of detection with the detection threshold of interacting pairs chosen to
give the false discovery rate below 20%. https://doi.org/10.1371/journal.pone.0214036.g006
of epistatic pairs are readable only in a narrow time interval between 0.2/s0and 1.5/s0
genera-tions. During later adaptation, the distribution of linkage disequilibrium for non-interacting pairs broadens and engulfs the distribution for epistatic pairs. These results indicate that, long before the onset of the steady state, linkage effects dominate over the effects of epistasis. This phenomenon is predicted in a broad parameter region and for all the LD statistics, suggesting that, in the context of inherited linkage fluctuations, all statistics based on pairwise linkage dis-equilibrium are equal.
To gain insight into the evolutionary origin of these fluctuations, we investigated phyloge-netic trees of the entire population at different time points to observe that the shape of the tree strongly correlates with the magnitude of linkage fluctuations. The shape of the phylogenetic tree changes in time from the initially star-shaped genealogy to a Bolthausen-Sznitman (BS) coalescent [32,33] previously analyzed in great detail for adapting asexual populations [25,36,
37]. Once BS genealogy is established, individual sequences share a high degree of interrelated-ness due to fixed beneficial mutations at randomly chosen sites. The presence of the BS coales-cent is coincident with strong co-inheritance linkage fluctuations. The stochastic nature of their common ancestor sequence, divergent in time from common ancestors in other indepen-dent populations (Fig 5) is the cause of the strong fluctuations of LD.
We have also directly quantitated the detection of epistatic pairs against the background of random linkage effects. We evaluated the sensitivity of the width of the detection window with respect to several input parameters, such as the mean selection coefficient, the size of the popu-lation, the sequence length, and initial genetic variation, and the role of recombination. We observed that the window is proportional to the inverse average selection coefficient, 1/s0, but
a very smalls0abolishes any chance of detection, so that the best detection is attained in the
case of moderately weak selection. The detection window exists only for sufficiently small genomes. The presence of recombination has the effect of compensating the linkage compo-nent and thus significantly improving the detection of epistasis. Yet, very frequent recombina-tion disrupts epistatic effects.
To isolate the epistatic component from co-inheritance effects, we performed simulations over several independently-evolved populations and averaged the haplotype frequencies over these runs. The results predict the number of independent population required to attain signif-icant expansion of the detection window (Fig 6). Thus, the averaging over multiple indepen-dently-evolved populations filters out linkage effects leaving a clear footprint of epistasis in a much broader parameter range. However one should note that the multiple-population sam-pling was conducted under the ideal conditions, in which every population evolved indepen-dently for the same time with the same parameter set, and represented the same fraction of the total sample. Unequal sampling or heterogeneous representation in real data sets may create additional problems.
Our model adopts several simplifying assumptions. (i) Deleterious alleles are assigned selec-tion coefficient constant in time. (ii) We considered constant and fixed epistatic strength for all pairs. (iii) We focused on a simple topology of epistatic network. While these are reasonable assumptions to describe the problem of linkage fluctuations in biological systems, a real sce-nario with mixed sign epistasis and complex topology might pose additional challenges for the accurate detection of epistasis.
The results obtained from averaging over independent populations give strong evidence for the role of stochastic divergence in linkage statistics. There are some cases, such as virus evolu-tion in independent populaevolu-tions where it is possible to obtain independent replicates. Exam-ples include influenza virus sampled in different countries, virus passage in parallel tissue cultures, cancer cell evolution in different organs. For the study of human genetics, it may be possible to obtain independent isolates from under-mixed subpopulations that split long time
ago. In principle, one can try to use data from different countries of common origin. For example, full genome studies show that European nations, despite of interbreeding and out-breeding, remain genetically distinct after a split from a common origin ~6000 years ago (seeFig 2in [52]). Therefore, they can be viewed as quasi-independent populations with weak genetic exchange. Our results imply that comparing genetic data from related but distinct eth-nicities allows to study epistasis more reliably than in a single ethnic group.
Conclusions
We identified the evolutionary reason for strong fluctuations of epistatic estimates in the exist-ing sequence sets. Linkage due to stochastic divergence of the common ancestor of a popula-tion from the origin is responsible for the high false-positive rates of epistasis detecpopula-tion in a single population. We demonstrated how the use of multiple independently-evolving popula-tions allows to average out strong linkage effects and rescue the detectability of epistasis.
Materials and methods
We consider a haploid population ofN binary sequences, where each genome site (nucleotide position) numbered byi = 1, 2, . . ., L is either Ki= 0 orKi= 1. We assume that the genome is
long,L >> 1. Evolution of the population in discrete time measured in generations is simu-lated using a standard Wright-Fisher model, which includes the factors of random mutation with rateμL per genome, natural selection, and random genetic drift. Recombination is assumed to be absent. Once per generation, each genome is replaced by a random number of its progeny which obeys multinomial distribution. The total population stays constant with the use of the broken-stick algorithm.
To include natural selection, we calculate fitness (average progeny number)eWof sequence Kias given by [50] W ¼XL i¼1siKiþ XL i<jSijKiKj ð5Þ Sij¼Eijðjsij þ jsjjÞTij ð6Þ The biological meaning of this expression is, as follows. According to a well-know theorem of population genetics, different loci are predicted to evolve independently in a large popula-tion if contribupopula-tions of mutapopula-tions occurring at different loci to organism’s log fitness are additive, which corresponds to the case of biologically non-interacting sites. Formally, this sit-uation is described by the first term inEq 5with additive contribution of single mutations to fitness, with selection coefficientsifor each sitei. Interaction between loci creates non-additive
effects to the fitness log: the second term inEq 5describes pairwise interactions of sites with magnitudesSijgiven byEq 6.
CoefficientEijintroduced inEq 6represents the relative strength of epistatic interaction
between sitesi and j, while the binary elements of matrix T indicate the interacting pairs by Tij= 1 and the other pairs byTij= 0. An example of positive epistasis is the compensation of
two deleterious mutations inside protein segments that bind each other. Note thatEij= 1
cor-responds to full mutual compensation of deleterious mutants at sitesi and j. We consider the simplest interaction topology of interacting neighbors, as given byT2i,2i+1= 1 and 0 for all
other pairs.
Here we include only pairwise interactions, neglecting higher-order interactions between protein residues. Even though non-pairwise models are sometimes used in the literature, we
are not aware of any evidence that higher-order interactions are significant in viruses or any other organisms.
Supporting information
S1 Table. Theoretical limits of detection of epistasis, expressed as the percentages of detec-tion and false positives. We devised an optimizadetec-tion algorithm that, based on prior
knowl-edge of the true epistatic association, identifies threshold within the data that allow to sort epistatic pairs from non-interacting ones. We present data for each induvial estimator of epistasis and for combinations of two, and three measure simultaneously. The analysis was repeated at two time points (T1= 10 andT2= 30 generations, within and outside of the widows
of detection, respectively. The results offer a comparative perspective over the detection perfor-mances of different measure and show that all LD- and haplotype-based estimators of epistasis can only detect true association, with reduced error and bias, only atT1, while at the later time
point the magnitude of CI effects mask the epistatic associations. (PDF)
S1 Appendix. Clonal exclusion does not remove the limit to the detection of epistasis in a single-population.
(PDF)
S1 Fig. The time-dependent profile of the distributions of UFE and WU in the absence of epistasis (E = 0). The shaded areas are the distribution density of UFE (Eq 4, upper row, red) or WU (Eq 3, bottom row, blue). All possible pairwise interactions are shown by light shades, versus the distribution of epistatic pairs knowna priori (dark shades). Between times of 0 and 50, the set of 20,000 sequences with a high standing variation evolves in the presence of the fac-tors of mutation, selection, linkage, and random drift into broader (plus larges) distributions due to the co-inheritance linkage. Both the epistatic and all pair distributions are centered at the origin and overlap. This setting serves as a negative control toFig 2and confirms that the noise of UFE is an inherent structural component of the system and independent of the pres-ence of epistasis. Parameters:N = 2 104,s0= 0.1,L = 50, E = 0, μL = 7 10−2. Each odd site
inter-acts with its neighbor to the right (1–2, 3–4, . . .). Initially, sequences are randomized with the average deleterious allelic frequency set tof = 0.4.
(TIFF)
S2 Fig. Clonal structure within unequal fitness classes emerges over time. Results show
(a− e) the establishment of the clonal structure in discrete fitness classes, in the absence (E = 0, upper row) or in the presence of epistasis (E = 0.75, lower row) for a large asexual population. Stacked boxes represent the size of clonal lineages within each fitness class. The population is initially highly diverse (is composed ofN unique clones), new mutations create a subpopulation, which drifts randomly at the higher end of the fitness distribution, meanwhile the less fit clones are selected out, and the fitness distribution travels rightward. Parameters:N = 2 104,s0= 0.1,L = 50, μL = 7 10−2. Each odd site interacts with its neighbor
to the right (1–2, 3–4, etc.). Initially, sequences were random with allelic frequency set to f = 0.4.
(TIFF)
S3 Fig. Clonal exclusion reduces the noise in a time-dependent manner. X-axis: the number
of excluded clones. Y-axis: the variance-to-mean ratio, which can be considered as a measure of fluctuation amplitude. The dotted blue lines track the percentage of excluded sequences. The black dotted lines show the predicted decrease of noise assuming that all clones are
statistically independent. Parameter values are as inFig 1withE = 0.75. These results show the decrease of the variance-to-mean ratio of the distribution of haplotype frequencies over time. (TIFF)
S4 Fig. Detection of epistasis is restrained to a limited time window. Percentile of detection
and false discovery as a function of time is averaged over 300 random simulation runs. The detection of epistatic pairs for two measures, UFE (Eq 4) and WU (Eq 3), follows an optimiza-tion protocol that minimizes the sum of detecoptimiza-tion and false positive fracoptimiza-tions by tuning the detection threshold set based on distribution of random sample of pairs (see the details inS3 Fig). At time ~1.5/s0, we observe the beginning of a transition which completely blurs the
detection of epistatic interaction at time ~2.5/s0, coincident with the establishment of BS
coalescent (Fig 5). These results describe a possible rationale for the design of an experimental setting that could detect epistatic interactions. Parameters:N = 2 104
,s0= 0.1,E = 0.75, L = 50,
μL = 7 10−2. Each odd site interacts with its neighbor to the right (1–2, 3–4, etc.). Initially, sequences were random with allelic frequency set tof = 0.4.
(TIFF)
S5 Fig. Sensitivity analysis of epistasis detection with respect to model parameters for UFE measure of linkage disequilibrium (Eq 4). Percentile of detection and false discovery
as a function of time is averaged over 25 random simulations (runs) in a broad range of parameters values. The default parameter set isE = 0.75, with the other parameters as inFig 1. Parameters values are shown. Thick lines correspond to default parameter values used in
Fig 1. (a) Distributed values ofs, randomly drawn from a half-Gaussian distribution of dele-terious alleles with averages0(shown). (b) Increasing genome lengthL closes the detection
window. (c) Decrease in population sizeN narrows the detection window. (d) The initial standing variation with average frequency of deleterious allelesf0allows detection in a
nar-row time window atf0> 10%.
(TIF)
S6 Fig. Sensitivity analysis of epistasis detection with respect to model parameters for WU measure of linkage disequilibrium (Eq 3). Notation as inS5 Fig.
(TIF)
S7 Fig. Sensitivity analysis of epistasis detection with respect to model parameters for LewontinD11’ measure of linkage disequilibrium (Eq 1). Notation as inS5 Fig.
(TIF)
S8 Fig. Sensitivity analysis of epistasis detection with respect to model parameters for LewontinD01’ measure of linkage disequilibrium (Eq 1). Notation as inS5 Fig.
(TIF)
S9 Fig. Sensitivity analysis of epistasis detection with respect to model parameters for Pearson coefficientr11as a measure of linkage disequilibrium (Eq 2). Notation as inS5 Fig.
(TIF)
S10 Fig. Sensitivity analysis of epistasis detection with respect to model parameters for Pearson coefficientr01as a measure of linkage disequilibrium (Eq 2). Notation as inS5 Fig.
(TIF)
Acknowledgments
Author Contributions
Conceptualization: Igor M. Rouzine. Funding acquisition: Igor M. Rouzine. Investigation: Gabriele Pedruzzi.
Methodology: Gabriele Pedruzzi, Igor M. Rouzine. Software: Igor M. Rouzine.
Supervision: Igor M. Rouzine. Validation: Gabriele Pedruzzi. Visualization: Gabriele Pedruzzi.
Writing – original draft: Gabriele Pedruzzi. Writing – review & editing: Igor M. Rouzine.
References
1. Cordell HJ. Epistasis: what it means, what it doesn’t mean, and statistical methods to detect it in humans. Hum Mol Genet. 2002; 11(20):2463–8. Epub 2002/09/28.https://doi.org/10.1093/hmg/11.20. 2463PMID:12351582.
2. Combarros O, Cortina-Borja M, Smith AD, Lehmann DJ. Epistasis in sporadic Alzheimer’s disease. Neurobiol Aging. 2009; 30(9):1333–49. Epub 2008/01/22.https://doi.org/10.1016/j.neurobiolaging. 2007.11.027PMID:18206267.
3. Combarros O, van Duijn CM, Hammond N, Belbin O, Arias-Vasquez A, Cortina-Borja M, et al. Replica-tion by the Epistasis Project of the interacReplica-tion between the genes for IL-6 and IL-10 in the risk of Alzhei-mer’s disease. J Neuroinflammation. 2009; 6:22. Epub 2009/08/25. https://doi.org/10.1186/1742-2094-6-22PMID:19698145
4. Bullock JM, Medway C, Cortina-Borja M, Turton JC, Prince JA, Ibrahim-Verbaas CA, et al. Discovery by the Epistasis Project of an epistatic interaction between the GSTM3 gene and the HHEX/IDE/KIF11 locus in the risk of Alzheimer’s disease. Neurobiol Aging. 2013; 34(4):1309 e1-7. Epub 2012/10/06.
https://doi.org/10.1016/j.neurobiolaging.2012.08.010PMID:23036584.
5. McKinney BA, Pajewski NM. Six Degrees of Epistasis: Statistical Network Models for GWAS. Front Genet. 2011; 2:109. Epub 2012/02/04.https://doi.org/10.3389/fgene.2011.00109PMID:22303403 6. Steen KV. Travelling the world of gene-gene interactions. Brief Bioinform. 2012; 13(1):1–19. Epub
2011/03/29.https://doi.org/10.1093/bib/bbr012PMID:21441561.
7. Ritchie MD. Using biological knowledge to uncover the mystery in the search for epistasis in genome-wide association studies. Ann Hum Genet. 2011; 75(1):172–82. Epub 2010/12/17.https://doi.org/10. 1111/j.1469-1809.2010.00630.xPMID:21158748
8. Zhang Y, Jiang B, Zhu J, Liu JS. Bayesian models for detecting epistatic interactions from genetic data. Ann Hum Genet. 2011; 75(1):183–93. Epub 2010/11/26.https://doi.org/10.1111/j.1469-1809.2010. 00621.xPMID:21091453.
9. Zuk O, Hechter E, Sunyaev SR, Lander ES. The mystery of missing heritability: Genetic interactions create phantom heritability. Proc Natl Acad Sci U S A. 2012; 109(4):1193–8. Epub 2012/01/10.https:// doi.org/10.1073/pnas.1119675109PMID:22223662
10. Desai MM, Fisher DS, Murray AW. The speed of evolution and maintenance of variation in asexual pop-ulations. Curr Biol. 2007; 17(5):385–94.https://doi.org/10.1016/j.cub.2007.01.072PMID:17331728.
11. Weissman DB, Desai MM, Fisher DS, Feldman MW. The rate at which asexual populations cross fit-ness valleys. Theor Popul Biol. 2009; 75(4):286–300. Epub 2009/03/17.https://doi.org/10.1016/j.tpb. 2009.02.006PMID:19285994
12. Gerrish PJ, Lenski RE. The fate of competing beneficial mutations in an asexual population. Genetica. 1998; 102–103(1–6):127–44. Epub 1998/08/28. PMID:9720276.
13. Gonzalez-Ortega E, Ballana E, Badia R, Clotet B, Este JA. Compensatory mutations rescue the virus replicative capacity of VIRIP-resistant HIV-1. Antiviral Res. 2011; 92(3):479–83. Epub 2011/10/27.
https://doi.org/10.1016/j.antiviral.2011.10.010PMID:22027647.
14. Handel A, Regoes RR, Antia R. The role of compensatory mutations in the emergence of drug resis-tance. PLoS Comput Biol. 2006; 2(10):e137. Epub 2006/10/17.https://doi.org/10.1371/journal.pcbi. 0020137PMID:17040124
15. Levin BR, Perrot V, Walker N. Compensatory mutations, antibiotic resistance and the population genet-ics of adaptive evolution in bacteria. Genetgenet-ics. 2000; 154(3):985–97. Epub 2000/04/11. PMID:
10757748
16. Nijhuis M, Schuurman R, de Jong D, Erickson J, Gustchina E, Albert J, et al. Increased fitness of drug resistant HIV-1 protease as a result of acquisition of compensatory mutations during suboptimal ther-apy. AIDS. 1999; 13(17):2349–59. Epub 1999/12/22. PMID:10597776.
17. Noviello CM, Lopez CS, Kukull B, McNett H, Still A, Eccles J, et al. Second-site compensatory muta-tions of HIV-1 capsid mutamuta-tions. J Virol. 2011; 85(10):4730–8. Epub 2011/03/04.https://doi.org/10. 1128/JVI.00099-11PMID:21367891
18. Piana S, Carloni P, Rothlisberger U. Drug resistance in HIV-1 protease: Flexibility-assisted mechanism of compensatory mutations. Protein Sci. 2002; 11(10):2393–402. Epub 2002/09/19.https://doi.org/10. 1110/ps.0206702PMID:12237461
19. Cong ME, Heneine W, Garcia-Lerma JG. The fitness cost of mutations associated with human immuno-deficiency virus type 1 drug resistance is modulated by mutational interactions. J Virol. 2007; 81 (6):3037–41. Epub 2006/12/29.https://doi.org/10.1128/JVI.02712-06PMID:17192300
20. Barton NH. Linkage and the limits to natural selection. Genetics. 1995; 140(2):821–41. Epub 1995/06/ 01. PMID:7498757
21. Hill WG, Robertson A. The effect of linkage on limits to artificial selection. Genet Res. 1966; 8(3):269– 94. Epub 1966/12/01. PMID:5980116.
22. Felsenstein J. The evolutionary advantage of recombination. Genetics. 1974; 78(2):737–56. Epub 1974/10/01. PMID:4448362
23. McVean GA, Charlesworth B. The effects of Hill-Robertson interference between weakly selected muta-tions on patterns of molecular evolution and variation. Genetics. 2000; 155(2):929–44. PMID:
10835411
24. Tsimring LS, Levine H, Kessler DA. RNA virus evolution via a fitness-space model. Phys Rev Lett. 1996; 76(23):4440–3.https://doi.org/10.1103/PhysRevLett.76.4440PMID:10061290.
25. Rouzine IM, Wakeley J, Coffin JM. The solitary wave of asexual evolution. Proc Natl Acad Sci U S A. 2003; 100(2):587–92. Epub 2003/01/15.https://doi.org/10.1073/pnas.242719299PMID:12525686 26. Brunet E, Rouzine IM, Wilke CO. The stochastic edge in adaptive evolution. Genetics. 2008; 179
(1):603–20. Epub 2008/05/22. 179/1/603https://doi.org/10.1534/genetics.107.079319PMID:
18493075
27. Rouzine IM, Brunet E, Wilke CO. The traveling-wave approach to asexual evolution: Muller’s ratchet and speed of adaptation. Theor Popul Biol. 2008; 73(1):24–46.https://doi.org/10.1016/j.tpb.2007.10. 004PMID:18023832
28. Desai MM, Fisher DS. Beneficial mutation selection balance and the effect of linkage on positive selec-tion. Genetics. 2007; 176(3):1759–98. Epub 2007/05/08.https://doi.org/10.1534/genetics.106.067678
PMID:17483432
29. Hallatschek O. The noisy edge of traveling waves. Proc Natl Acad Sci U S A. 2011; 108(5):1783–7. Epub 2010/12/29.https://doi.org/10.1073/pnas.1013529108PMID:21187435
30. Good BH, Rouzine IM, Balick DJ, Hallatschek O, Desai MM. Distribution of fixed beneficial mutations and the rate of adaptation in asexual populations. Proc Natl Acad Sci U S A. 2012; 109(13):4950–5. Epub 2012/03/01.https://doi.org/10.1073/pnas.1119910109PMID:22371564
31. Good BH, Desai MM. The impact of macroscopic epistasis on long-term evolutionary dynamics. Genet-ics. 2015; 199(1):177–90. Epub 2014/11/15.https://doi.org/10.1534/genetics.114.172460PMID:
25395665
32. Neher RA, Hallatschek O. Genealogies of rapidly adapting populations. Proc Natl Acad Sci U S A. 2013; 110(2):437–42. Epub 2012/12/28.https://doi.org/10.1073/pnas.1213113110PMID:23269838 33. Walczak AM, Nicolaisen LE, Plotkin JB, Desai MM. The structure of genealogies in the presence of
puri-fying selection: a fitness-class coalescent. Genetics. 2012; 190(2):753–79.https://doi.org/10.1534/ genetics.111.134544PMID:22135349
34. Batorsky R, Kearney MF, Palmer SE, Maldarelli F, Rouzine IM, Coffin JM. Estimate of effective recom-bination rate and average selection coefficient for HIV in chronic infection. Proc Natl Acad Sci U S A. 2011; 108(14):5661–6. Epub 2011/03/26.https://doi.org/10.1073/pnas.1102036108PMID:21436045 35. Gheorghiu-Svirschevski S, Rouzine IM, Coffin JM. Increasing sequence correlation limits the efficiency
of recombination in a multisite evolution model. Mol Biol Evol. 2007; 24(2):574–86.https://doi.org/10. 1093/molbev/msl189PMID:17138627.
36. Rouzine IM, Coffin JM. Evolution of human immunodeficiency virus under selection and weak recombi-nation. Genetics. 2005; 170(1):7–18.https://doi.org/10.1534/genetics.104.029926PMID:15744057.
37. Rouzine IM, Coffin JM. Multi-site adaptation in the presence of infrequent recombination. Theor Popul Biol. 2010; 77(3):189–204.https://doi.org/10.1016/j.tpb.2010.02.001PMID:20149814.
38. Xiao Y, Rouzine IM, Bianco S, Acevedo A, Goldstein EF, Farkov M, et al. RNA recombination enhances adaptability and is required for virus spread and virulence. Cell Host Microbe. 2016; 19(4):493–503.
https://doi.org/10.1016/j.chom.2016.03.009PMID:27078068.
39. Neher RA, Leitner T. Recombination rate and selection strength in HIV intra-patient evolution. PLoS Comput Biol. 2010; 6(1):e1000660. Epub 2010/02/04.https://doi.org/10.1371/journal.pcbi.1000660
PMID:20126527
40. Neher RA, Shraiman BI, Fisher DS. Rate of adaptation in large sexual populations. Genetics. 2010; 184 (2):467–81.https://doi.org/10.1534/genetics.109.109009PMID:19948891.
41. Neher RA, Shraiman BI. Competition between recombination and epistasis can cause a transition from allele to genotype selection. Proc Natl Acad Sci U S A. 2009; 106(16):6866–71. Epub 2009/04/16.
https://doi.org/10.1073/pnas.0812560106PMID:19366665
42. Barton NH. A general model for the evolution of recombination. Genet Res. 1995; 65(2):123–45. PMID:
7605514.
43. Kouyos RD, Otto SP, Bonhoeffer S. Effect of varying epistasis on the evolution of recombination. Genetics. 2006; 173(2):589–97.https://doi.org/10.1534/genetics.105.053108PMID:16547114 44. Cordell HJ. Detecting gene-gene interactions that underlie human diseases. Nature reviews Genetics.
2009; 10(6):392–404.https://doi.org/10.1038/nrg2579PMID:19434077
45. Wei W-H, Hemani G, Haley CS. Detecting epistasis in human complex traits. Nature Reviews Genetics. 2014; 15:722.https://www.nature.com/articles/nrg3747#supplementary-information. PMID:25200660 46. Lewontin RC. On measures of gametic disequilibrium. Genetics. 1988; 120(3):849–52. PMID:3224810 47. Balding DJ. A tutorial on statistical methods for population association studies. Nat Rev Genet. 2006; 7
(10):781–91.https://doi.org/10.1038/nrg1916PMID:16983374.
48. Wu X, Dong H, Luo L, Zhu Y, Peng G, Reveille JD, et al. A novel statistic for genome-wide interaction analysis. PLoS Genet. 2010; 6(9):e1001131.https://doi.org/10.1371/journal.pgen.1001131PMID:
20885795
49. Kimura M. Attainment of Quasi Linkage Equilibrium When Gene Frequencies Are Changing by Natural Selection. Genetics. 1965; 52(5):875–90. PMID:17248281
50. Pedruzzi G, Barlukova A, Rouzine IM. Evolutionary footprint of epistasis. PLoS Comput Biol. 2018; 14 (9):e1006426.https://doi.org/10.1371/journal.pcbi.1006426PMID:30222748
51. Desai MM, Weissman D, Feldman MW. Evolution can favor antagonistic epistasis. Genetics. 2007; 177 (2):1001–10. Epub 2007/08/28.https://doi.org/10.1534/genetics.107.075812PMID:17720923 52. Behar DM, Yunusbayev B, Metspalu M, Metspalu E, Rosset S, Parik J, et al. The genome-wide
struc-ture of the Jewish people. Nastruc-ture. 2010; 466(7303):238–42.https://doi.org/10.1038/nature09103
PMID:20531471.