HAL Id: hal-03007362
https://hal.archives-ouvertes.fr/hal-03007362
Submitted on 3 Jan 2021HAL is a multi-disciplinary open access archive for the deposit and dissemination of sci-entific research documents, whether they are pub-lished or not. The documents may come from teaching and research institutions in France or abroad, or from public or private research centers.
L’archive ouverte pluridisciplinaire HAL, est destinée au dépôt et à la diffusion de documents scientifiques de niveau recherche, publiés ou non, émanant des établissements d’enseignement et de recherche français ou étrangers, des laboratoires publics ou privés.
Playing with Pt II and Zn II Coordination to Obtain
Luminescent Metallomesogens
Adelina-antonia Andelescu, Benoît Heinrich, Maria Angela Spirache, Emilie
Voirin, Massimo La Deda, Giuseppe Di Maio, Elisabeta Szerb, Bertrand
Donnio, Otilia Costisor
To cite this version:
Adelina-antonia Andelescu, Benoît Heinrich, Maria Angela Spirache, Emilie Voirin, Massimo La Deda, et al.. Playing with Pt II and Zn II Coordination to Obtain Luminescent Metallomesogens. Chemistry - A European Journal, Wiley-VCH Verlag, 2020, 26 (21), pp.4850-4860. �10.1002/chem.202000124�. �hal-03007362�
Playing with Pt
II
and Zn
II
Coordination to
Obtain Luminescent Metallomesogens
Adelina‐Antonia Andelescu, Benoît Heinrich, Maria Angela Spirache, Emilie Voirin, Massimo La Deda, Giuseppe Di Maio, Elisabeta I. Szerb*, Bertrand Donnio*, Otilia Costisor*Cite as Chem. Eur. J. 2020, 26, 4850-4860 First published: 17 February 2020
https://doi-org.scd-rproxy.u-strasbg.fr/10.1002/chem.202000124
Abstract
Blue–green luminescent terpyridine‐containing PtII and ZnII complexes are reported. Equipped with
lipophilic gallate units, which act as monodentate ancillary coordinating ligands and/or as anions, they display low‐temperature mesomorphic properties (lamello‐columnar and hexagonal mesophases for PtII and ZnII complexes, respectively). The mesomorphic properties were
investigated by polarised optical microscopy, differential scanning calorimetry, thermogravimetric analysis and X‐ray scattering of bulk materials and oriented thin films. The model of self‐assembly into the lamello‐columnar phase of the PtII complex has been described in detail. The optical
properties of the complexes were investigated in the liquid and condensed liquid crystalline states, highlighting the delicate balance between the role of the metal in determining the type of excited state responsible for the emission, and the role of the ancillary ligand in driving intermolecular interactions for proper mesophase formation.
Introduction
Luminescent d‐block metallomesogens are promising functional materials for practical applications. They have mainly been investigated in terms of obtaining polarised emission to be used as backlighting in displays,1-4 but also some studies concerning their use as stimuli responsive materials for sensing5, 6 or security inks,7 or high‐hole mobility materials for electroluminescent devices8 have been reported. Despite recent progress with square‐planar PtII and octahedral
IrIII complexes, which are considered among the best emitters, there is still considerable work to be
done to control the phase type and transition temperatures or to improve the luminescence in the mesophase.9 In fact, only a few studies on the mesophases of luminescent liquid‐crystalline transition metal complexes have been carried out, with, just to cite non‐exhaustively, the contributions of Bruce et al. on IrIII,8, 10-12 Espinet et al.13 and Tsutsumi et al.14, 15 on AuI,
Gimenénez et al. on AgI[16] and ZnII,17 Cârcu et al. on PdII,18-20 Cano et al. on AgI[21–22] and Pucci,
Crispini and Ghedini et al. on RuII,23 AgI,24-26 IrIII[27] and ZnII[28, 29] complexes. For practical
and optical stabilities, availability and cost of the precursors and straightforward syntheses. Lately, some ionic PtII complexes with terpyridine (tpy) or functionalised terpyridine ligands were showed
to be good candidates for obtaining luminescent supramolecular assemblies both in liquid crystalline phases and gels,[30-33] owing to the extended aromatic region that favours π–π stacking
and short Pt⋅⋅⋅Pt distances.[34] However, no study has demonstrated the retention of luminescence
properties in the mesomorphic ranges of the bulk PtII terpyridine‐based complexes yet.
In this context, our interest in luminescent d‐block metallomesogens[24,27,35-37] prompted us to
synthesise some luminescent PtII coordination complexes. They were prepared by a versatile and
straightforward synthesis, which permits facile molecular engineering by using anions of different coordination strengths and dimensions, including non‐coordinating medium sized BF4, weakly
coordinating bulky lipophilic benzoate and small and strongly coordinating Cl (Scheme 1). This strategy represents an easy way to induce liquid crystallinity in PtII complexes by avoiding the
several steps necessary to precisely functionalise the ligands. To explore the role of the metal cation, the same strategy was extended to ZnII complexes, but owing to the different electronic
configuration only neutral penta‐coordinated species were obtained.
Scheme 1 Synthesis of PtII and ZnII complexes: i) MeOH, ΔT, 1.5 h; ii) CHCl
3/MeOH 1:1, r.t., 2 h;
iii) CHCl3/MeOH 1:1, r.t., 1 h; iv) CHCl3/acetone 1:5, r.t., 2 h; v) MeOH/CHCl3, r.t., 1.5 h; vi) CHCl3,
r.t., 2 h.
In this study, we designed and synthesised tpy‐containing PtII and ZnII complexes by using this
the low solubility of the PtII chloro chloride (analogues of Pt_1 in Scheme 1) and ZnII dichloro
(analogues of Zn_1) derivatives prevented the acceptable progress of the successive steps. Therefore, the ligand was functionalised with a long alkyl chain through an ether linkage (ligand L). The methyl ester group at the end of the chain is important for future applications of the complexes, as it allows derivatisation potentially to link the complexes onto functionalised metallic and/or oxide nanoparticles or mesoporous silica structures for theranostic purposes, in particular.
Of the three lipophilic complexes (i.e., Pt_2, Pt_4, Zn_2 in Scheme 1), two were found to be mesomorphous, displaying room‐temperature lamello‐columnar (Pt_4, LamColr and LamCol) and
hexagonal columnar (Zn_2, Colhex) phases, whereas Pt_2 was found to be thermally unstable and
to dissociate rapidly (see below). The thermal behaviour and liquid‐crystalline self‐assemblies were fully characterised by polarised optical microscopy (POM), differential scanning calorimetry (DSC), thermogravimetric analysis (TGA) and small‐ and wide‐angle X‐ray scattering (S/WAXS) of bulk materials, combined with grazing incidence wide‐angle X‐ray scattering (GIWAXS) on oriented thin films. Accurate structural and photophysical investigations in different solvents and condensed states were carried out, in an attempt to determine structure–property relationships. In particular, of capital interest was the investigation of the influence of the mesophase organization on the emitting states.
Results and Discussion
Synthesis and spectroscopic characterisation
Ligand L (tpy) was obtained from 2,6‐bis‐(2′‐pyridyl)‐4‐pyridone[38] by etherification with methyl 11‐
bromoundecanoate[39] (see the Supporting Information). Complex Pt_1, synthesised by a slight
modification of a method described in the literature for similar derivatives,[40] was used as precursor
for both Pt_2 and Pt_3 ionic complexes: Pt_2 was obtained by reacting Pt_1 with 2 moles of the silver(I) salt of 3,4,5‐tridodecyloxybenzoate,[41] whereas Pt_3 was obtained by metathesis reaction
by using an excess of NH4BF4. The intermediate coordination strength of the benzoate unit gives
the possibility for this anion to act as both counter anion and as coordinating ligand on PtII, when
no other competitor is present (complex Pt_2), or exclusively as a ligand in the presence of a non‐ coordinating anion like BF4 (complex Pt_4).
The reaction of the tpy ligand L with ZnCl2 afforded the neutral complex Zn_1, with the metal centre
penta‐coordinated by the tridentate terpyridine and two monodentate chlorine ligands. Although ZnII can be forced to accommodate a square‐planar geometry with salicyldimine Schiff base[42,43] or
porphyrin[44] ligands, without steric constraints, it prefers tetrahedral or higher number coordination
neutral Zn_2 complex was obtained with two benzoate ligands saturating the coordination sphere of the ZnII metal centre. The proposed chemical structures of the ligand and its PtII and
ZnII complexes are supported by IR and accurate 1D and 2D NMR spectroscopy. The ionic
character of the PtII complexes was evidenced in solution by conductivity measurements.[45] The
complexes were obtained as yellow (PtII species) or white (ZnII species) powder or waxy solids and
were dried for several days under high‐pressure vacuum and then equilibrated under air. All PtII complexes were hygroscopic; the presence of water molecules being evidenced both by IR
spectroscopy (strong broad band centred at 3400 cm−1) and by TGA experiments (Figures SI‐1 to
SI‐7 in the Supporting Information) and elemental analysis.
The first indication of the dual coordination mode of the benzoate group in the case of the Pt_2 complex was evidenced by the COO− stretching frequencies, different from the
frequencies of the alkyl chain methanoate (νas=1740 cm−1). Indeed, for the benzoate the
asymmetrical stretching (νas) is around 1635 cm−1, and the symmetrical stretching (νs) for the ionic
band appears at 1555 cm−1 (Pt_2) and at 1340 cm−1 for a coordinated bond (Pt_2 and Pt_4), giving
a separation (Δ) of 80 and 295 cm−1, respectively (Figure 1).[46] Moreover, for Pt_4, the
characteristic band of the BF4− counter ion appears centred at 1062 cm−1 (Figure 1). The IR spectra
of the ZnII derivative Zn_2 (Figure SI_1, in the Supporting Information) contain only the stretching
COO− vibrations corresponding to the coordinated specie (Δ≈250 cm−1).
Figure 1 IR spectra of PtII complexes Pt_1, Pt_2 and Pt_4, showing the two types of carboxylate
coordination m odes.
The chemical shifts of the aromatic protons were assigned on the basis of accurate 1D and 2D NMR investigations (Tables SI‐1 to SI‐6 in the Supporting Information). In the cases of Pt_2 and Pt_4, the aromatic protons belonging to the benzoate groups have different chemical shifts when coordinated to the metal centre as a monodentate ligand or ensure the neutrality of the
complex as a negatively charged ion (Figure 2). In particular, for the coordinated benzoate, the aromatic protons are less shielded, shifting to higher frequencies.
Figure 2 1H NMR spectra of ligand L, Pt_2 and Pt_4, showing the different chemical shifts of the
aromatic proton belonging to the benzoate when they are coordinated or ionic.
Thermal and mesomorphic behaviour (POM, TGA, DSC)
The thermal behaviour was first investigated by POM, TGA and DSC. The complexes without the benzoate group (Pt_1, Pt_3 and Zn_1 in Scheme 1) were obtained as amorphous or crystalline solids with high melting points, and, as expected, deprived of liquid crystalline properties owing to the absence of aliphatic chains. The introduction of lipophilic gallate units as monodentate ligands (Pt_4 and Zn_2 in Scheme 1) or as both ligand and counter anion (Pt_2 in Scheme 1) resulted in the drastic lowering of the melting points for all and in the induction of mesomorphism for the former ones (Table 1).
The thermal behaviour of the platinum complex with two gallate groups, Pt_2, is rather peculiar and complicated, and requires some precision. During the first heating, a first broad, endothermic event is detected at around 37 °C by DSC, and a texture characteristic of a hexagonal (Colhex) phase is
easily recognised by POM (Figure 3 and Figure SI‐9 in the Supporting Information). On further heating, above 90 °C, phase co‐existence is observed (between Colhex phase and isotropic liquid),
and the birefringence persists until the sample fully clears at 155 °C, at which temperature no more birefringence is seen. This very broad transition, spreading over several tens of degrees Celsius, was not detected by DSC. On cooling, the isotropic liquid and the Colhex phase were found to co‐
exist again until a transition was detected at around 85 °C by DSC, where two phases eventually co‐exist. It is important to note that this transition was not seen by POM and that no textural change was evidenced either. On further cooling, the compound partly crystallises. This singular
phenomenon is reversible on successive thermal cycles, and suggests the partial dissociation of one gallate group during the first thermal treatment, as later confirmed by S/WAXS. 1H NMR and
IR spectroscopy measurements performed on Pt_2 after one cycle of heating and cooling indeed confirmed the dissociation of the ionic gallate (see Figures SI‐18 and SI‐19 in the Supporting Information). This lack of thermal stability therefore precludes any conclusive remarks on its supramolecular behaviour.
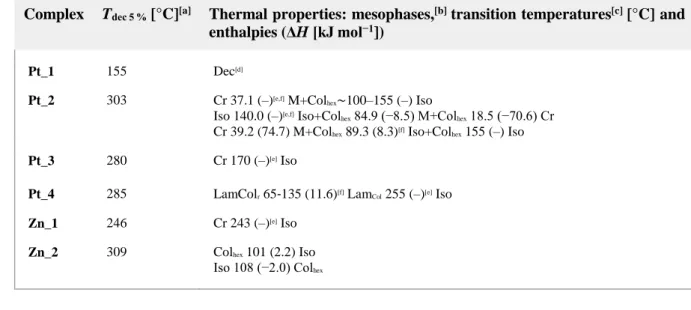
Table 1. Thermal behaviour of PtII and ZnII complexes.
Complex Tdec 5 % [°C][a] Thermal properties: mesophases,[b] transition temperatures[c] [°C] and
enthalpies (ΔH [kJ mol−1])
Pt_1 155 Dec[d]
Pt_2 303 Cr 37.1 (–)[e,f] M+Col
hex∼100–155 (–) Iso
Iso 140.0 (–)[e,f] Iso+Col
hex 84.9 (−8.5) M+Colhex 18.5 (−70.6) Cr
Cr 39.2 (74.7) M+Colhex 89.3 (8.3)[f] Iso+Colhex 155 (–) Iso
Pt_3 280 Cr 170 (–)[e] Iso
Pt_4 285 LamColr 65‐135 (11.6)[f] LamCol 255 (–)[e] Iso
Zn_1 246 Cr 243 (–)[e] Iso
Zn_2 309 Colhex 101 (2.2) Iso
Iso 108 (−2.0) Colhex
[a] Significant weight loss (5 %) from degradation from the TGA trace. [b] Determined on first cooling and second heating (for mesomorphous compounds), and only first heating for the other: Cr, crystalline phase; Colhex, hexagonal columnar mesophase; LamCol, lamellar columnar mesophase; LamColr,
lamellar columnar mesophase with rectangular symmetry; Iso, isotropic liquid. [c] Onset peaks. [d] Decomposition before melting. [e] POM observations. [f] Broad transition.
Figure 3 POM textures (top) of the Pt_2 sample at 35 °C on first cooling, of Pt_4 at 175 °C on
second cooling, and of Zn_2 at 80 and 20 °C, respectively, on cooling. DSC traces (bottom) of Pt_4 and Zn_2.
The platinum complex with only one gallate group (Pt_4) is clearly mesomorphous from room temperature up to 255 °C, with a reversible phase transformation spreading over 70 °C, from approximately 65 °C to 135 °C between two mesomorphic states. Another broad transition to a likely crystalline state was detected below 0 °C. Pt_4 exhibits a fan‐shaped texture reminiscent of a lamellar arrangement (Figure 3 and Figure SI‐10 in the Supporting Information). The Zn complex (Zn_2) is mesomorphous at room temperature up to a reversible but broad clearing transition at 101 °C. POM textures at 80 °C in the mesophase and at room temperature, obtained on cooling from the isotropic state, display pseudo‐focal‐conic defects and homeotropic zones, which indicate the formation of an untilted Colhex mesophase (Figure 3 and Figure SI‐11 in the Supporting
Information). In all cases, textures were preserved at room temperature.
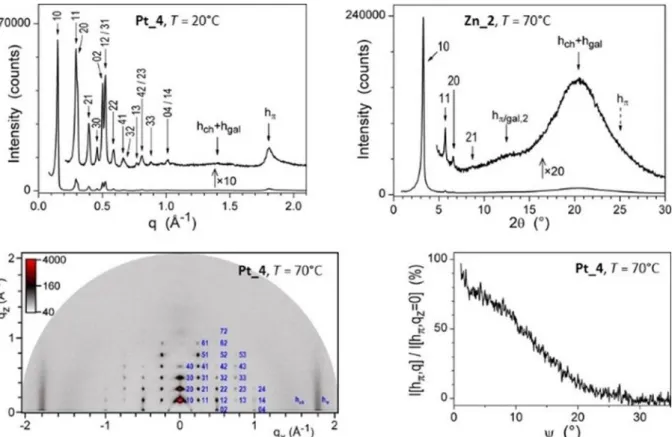
Characterisation of the mesophases by small‐ and wide‐angle
X‐ray scattering (S/WAXS)
Combined with S/WAXS investigation, lamello‐columnar phases were eventually confirmed for Pt_4 from room temperature up to 255 °C, whereas a hexagonal mesophase was confirmed for Zn_2. The S/WAXS patterns, recorded for both samples at various temperatures, revealed several sharp and intense reflections in the small‐angle range characteristic of the various two‐ dimensional arrangements of mesogenic columns separated in space by a molten aliphatic continuum (Figure 4). For Zn_2, up to four reflections in the ratio 1:√3:2:√7 were observed, unambiguously characterising a hexagonal p6mm lattice. The numerous sharp reflections of Pt_4 could be indexed according to a p2mg rectangular lattice, with the arrangement of columns into a rectangular symmetry. In the large‐angle region, a broad and diffuse scattering signal, emerging from undifferentiated lateral distances between the aliphatic chains and the gallate groups, respectively, hch+hgal, was systematically present and confirmed the fluid and liquid
crystalline nature of all mesophases: these average lateral distances give rise to scattering maxima hgal and hch, which are not resolved from the large scattering contribution hch from the
molten chains in the periphery of the columns. An additional signal is observed for Pt_4, hπ, arising
from the stacking distances between successive tpy‐platinum complexes into columns: this signal is rather sharp, suggesting a regular stacking of the complex along the columns. This signal is not present for the zinc complex, indicating that the stacking is completely undifferentiated from the broad scattering, hch+hgal. For this latter complex, another scattering maximum with a two‐core
between successive cores. The S/WAXS patterns recorded at various temperatures for complex Pt_2 unfortunately confirmed the erratic behaviour owing to the dissociation of the ionic gallate and the co‐existence of two or more species, making the phase identification impossible (Figure SI‐13 in the Supporting Information).
Figure 4 Representative S/WAXS (top) and GIWAXS (bottom) patterns of Pt_4 (in the low‐
temperature LamColr phase) and Zn_2 (in the Colhex). In the thin‐film pattern, the b‐axis
and hπ scattering lie in the equatorial plane and lamellae are thus parallel to the substrate (see
text). The profile analysis of the strip‐like hπ scattering further reveals that complexes fluctuate out
of the lamellar plane by roughly 10°.
The columns of the Colhex phase of Zn_2 are constituted by a core of piled complexes and a crown
of irregularly closed‐packed gallate units, the average lateral distances of which give rise to scattering maximums hgal and hch, which are not resolved from the scattering contribution hch from
the molten chains in the periphery of columns. The distribution of gallate units and chains around piled complexes results in the appearance of a scattering maximum from a two‐cores periodicity hπ/gal,2, in relation to the change of in‐plane orientation of successive cores. For this
compound, it turns out that the number of chains and the size of the cores are well adapted, so that molecules self‐assemble in an untilted Colhex phase, with hmol close to the natural stacking distance
of tpy‐zinc(II) (Figure SI‐16 in the Supporting Information) and with a chain packing ratio,[47] q
ch,
slightly above unity (Table 2). The stacking distance of the tpy rings is indeed 3.2945 Å at 25 °C in the single‐crystal structure CSD‐TPYZNC[48] of the dichloro‐terpyridyl‐zinc(II) complex, thus is
almost stretched chains, favouring the formation of sharp nanosegregation interfaces with piled cores and thus columnar mesomorphism.
Table 2. Mesophase parameters of complex Zn_2. Phase T[a] Vmol ρ[ b] a A[Z][c] hmol[d] χ Vch Acore[e]
Dcyl[f] Sch,cyl[g] qch,cyl[h]
Colhex 70 3025 1.04 31.32 850[1] 3.56 0.778 189 15.5 24.8 1.12 Colhex 30 2946 1.07 32.08 891[1] 3.31 0.775 200 16.0 23.7 1.11
[a] T, temperature of the measurement (°C). [b] Vmol, calculated molecular volume (Å3); ρ, density
(g cm−3). [c] a, lattice parameter (Å); A=a2√3/2, lattice area (Å2); Z, number of columns per lattice. [d]
hmol=Vmol/A, molecular slice thickness (Å). [e] χVch, calculated aliphatic volume
fraction; Acore=(1−χVch)×(A/Z), cross‐sectional area of columnar cores (Å2). [f] Dcyl=√(4/π Acore), diameter
(Å) of equivalent cylinder of cross‐sectional area Acore. [g] Sch,cyl=πDcyl×hmol/nch: cylinder area per chain
(Å2), n
ch=7, the number of chains per molecule. [h] qch=Sch,cyl/σch, chain packing ratio, σch=21.2 (Å2), the
cross‐sectional area of a molten chain at 20 °C.
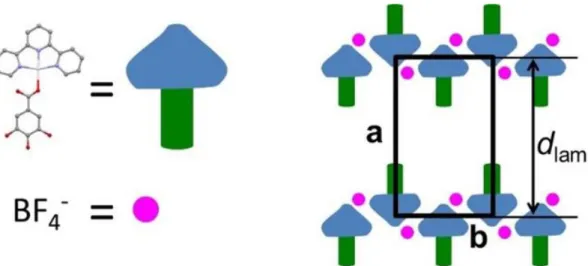
For the LamColr, the glide line coincides with the b‐axis, along which column rows and counter ions
compactly self‐assemble into layers (Figure 5). The sequence of column layers and of intermediate molten chain layers along the a‐axis generates a lamellar periodicity, dlam, giving a very strong first‐
order reflection (1 0) and reflections series (h l) that extend to high h. In the thin‐film pattern, the b‐ axis and hπ scattering lie in the equatorial plane and lamellae are thus parallel to the substrate. The
profile analysis of the strip‐like hπ scattering further reveals that complexes fluctuate out of the
lamellar plane by roughly 10° (Figure 4, bottom right).
Figure 5 Left: model of terpyridyl‐platinum complex moieties and gallate units, as reconstructed
representation of the likely molecular organization in the LamColr mesophase of p2mg symmetry.
Columns of stacked complexes and BF4− counter ions arrange in staggered rows; gallate units and
molten alkyl chains (not represented) fill the gaps between successive staggered rows. The a‐axis coincides with a lamellar periodicity dlam, maintained after heating in the LamCol mesophase,
whereas the rectangular long‐range lattice is suppressed by thermal fluctuations allowing successive column rows to move laterally one to another.
Terpyridyl‐platinum complexes stack into columns that self‐assemble with counter ions into layers alternating with aliphatic chains. At low temperature, the rings are nearly orthogonal to layers (hmol≈hπ), and the chains stretch onto the layer normal (qch≈1); the superimposition of layers defines
a rectangular lattice of one‐lamella and two‐column periodicity (Table 3). At higher temperature, fluctuations of ring orientations out of the lamellar plane are enhanced (⟨ψ⟩≫0), which causes elongation of columns (hmol>hπ) and lateral expansion of lamellae (higher Amol and qch), which in turn
affects the regularity of π‐stacking (lower ξ). The columnar superstructure finally vanishes in the following lamello‐columnar mesophase (LamCol), which preserves the long‐range correlated
lamellar structure and a local‐range ribbon periodicity from average lateral distances between piled complexes (D).
Table 3. Mesophase parameters of complex Pt_4.
Phase
T
[a]V
molρ
[b]a
b
A[Z]
d
lam[N
L]
[c]D[ξ]
[d]A
molS
ch[e]q
ch[f]D
colS
col[g]h
molh
π[ξ]
[h]ψ
[i] LamColr 20 1820 1.28 41.20 25.11 1035[2] 41.20[1] – 44.2 22.1 1.04 12.55 517 3.52 3.48 [90] 9 LamColr 70 1880 1.24 40.60 25.16 1022[2] 41.60[1] – 46.3 23.1 1.05 12.58 511 3.68 3.51 [70] 17 LamCol 140 1960 1.19 – 36.90[1] 12.5[60] 53.2 26.6 1.15 12.5 462 4.24 3.54 [40] 33 LamCol 180 2010 1.16 – 35.17[1] 12.2[60] 57.1 28.6 1.20 12.2 429 4.68 3.56 [25] 40 [a] Temperature of the measurement (°C). [b] Vmol, calculated molecular volume (Å3); ρ, density
(g cm−3). [c] a, b, A=a×b, Z: lattice parameters (Å), lattice area (Å2) and number of columns per
lattice; dlam, NL: lamellar periodicity (Å) and number of molecular layers per lamella (LamColr: dlam=a)
(for LamColr only). [d] D, ξ: average distance between columns from scattering maximum (Å) and
associated correlation length (Å, Scherrer equation with K=0.9) (for LamCol only). [e] Amol=Vmol/(dlam/NL)
molecular area (Å2); S
ch=Amol/2: area per chain in the lamellar plane (Å2). [f] qch=Sch/σch, chain packing
ratio, σch=21.2 Å2 at T=20 °C, being the cross‐sectional area of a molten chain. [g] Dcol: distance
between columns in the lamellar plane (Å) (LamColr: Dcol=b/2; Lamcol: Dcol=D); Scol=Dcol×(dlam/NL): cross‐
sectional area of a column (Å2). [h] h
mol=Vmol/Scol: molecular slice thickness (Å); hπ, ξ: distance
between stacked complexes from scattering maximum (Å) and associated correlation length (Å, Scherrer equation with K=0.9). [i] ψ=acos(hπ/hmol): mean out of plane tilt angle of stacked complexes
(°).
Photophysical characterisation
The photophysical properties of the complexes have been investigated in DMSO solution for Pt_1, Pt_3, Pt_4, in CH2Cl2 solution for Pt_2, Zn_1, Zn_2 and in the solid state for all samples.
The results are summarised in Table 4 and Table 5.
Table 4. Photophysical properties of the complexes in solution at room temperature.
Sample Absorption, λmax [nm] (ϵ [M−1 cm−1]) Emission
λmax [nm] Quantum yield, Φ [%] Lifetime τ [ns] Pt_1[a] 286 (24 780), 305 (13 330), 320 (13 940), 334 (15 580), 372 (3930), 395 (3960), 459 (650) 620 0.8 380 Pt_2[b] 285 (6310), 306 (2700), 317 (2370), 332 (1990), 381 (660), 393 (630), 459 (60) 600 1.7 397 Pt_3[c] 286 (78 320), 305 (41 990), 320 (41 770), 334 (46 580), 368 (10 690), 396 (11 670), 455 (1950) 615 0.5 338 Pt_4[d] 285 (25 630), 302 (14 650), 317 (13 370), 333 (12 570), 367 (4030), 395 (3400), 469 (800) 650 0.2 251 Zn_1[e] 248, 275, 311, 323 365 6.4 1.2 Zn_2[f] 258 (28 030), 285 (15 150), 306 (11 620), 319 (10 100) 379 24.5 2.7
Concentration: [a] 1.08×10⁻⁵ M; [b] 2.63×10⁻⁴ M; [c] 9.16×10⁻⁵ M; [d] 2.3×10⁻⁵ M. [e] Partially
soluble, ϵ data not available. [f] 3.96×10⁻⁶ M.
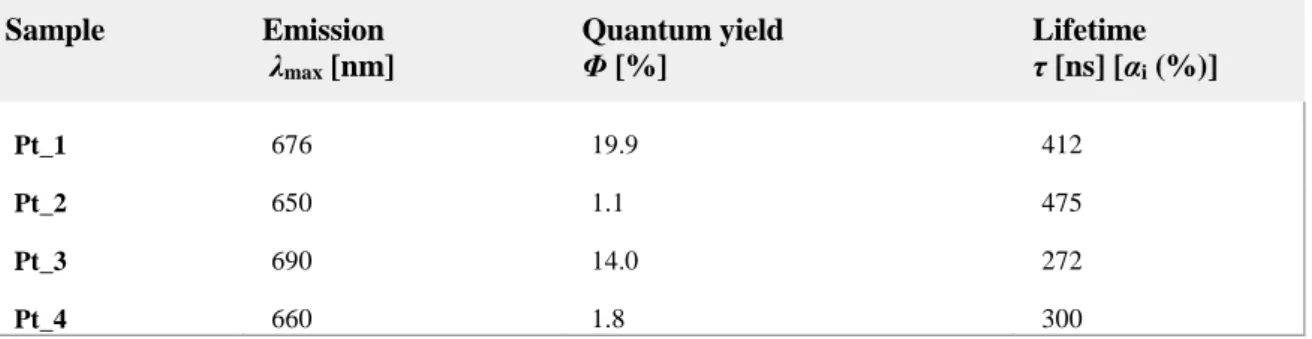
Table 5. Photophysical properties of the complexes in the condensed state at room temperature.
Sample Emission λmax [nm] Quantum yield Φ [%] Lifetime τ [ns] [αi (%)] Pt_1 676 19.9 412 Pt_2 650 1.1 475 Pt_3 690 14.0 272 Pt_4 660 1.8 300
Sample Emission λmax [nm] Quantum yield Φ [%] Lifetime τ [ns] [αi (%)] Zn_1 360 15.8 78.5 Zn_2 450 7.1 0.4[23], 3[69], 11[8]
All PtII complexes present a pale‐yellow colour in diluted solutions and absorb in the UV region with
weak bands in the visible region of the electromagnetic spectra (Figure 6 a). The spectra show a well‐resolved structure with numerous peaks, which can be grouped in three main regions: lowest intensity bands in the 450–500 nm range; medium‐intensity peaks in the 370–400 nm region; high‐ intensity bands below 350 nm. Although the spectral shape is almost unvaried on changing the counter ion or the ancillary ligand, the ϵ values are different.
Figure 6 (a) Absorption spectra of PtII complexes in DMSO (Pt_1, Pt_3, Pt_4) or CH
2Cl2 (Pt_2)
solutions. (b) Emission spectra of PtII complexes in DMSO (Pt_1, Pt_3, Pt_4) or CH
2Cl2 (Pt_2)
solutions at room temperature. Concentrations are reported in Table 4. (c) Emission spectra of PtII complexes in condensed phase at room temperature.
All solutions are weakly fluorescent at room temperature (Figure 6 b), with broad and structureless emission bands in the green–red region (peaks located from 600 to 650 nm) of the visible spectrum. The emission quantum yields measured in air‐equilibrated solution at room temperature are low and range from 0.2 to 1.7 %. The emission intensity decay has been fitted with a mono‐exponential function giving lifetime values between 251 and 397 ns (Table 4).
Platinum tpy complexes are well known to form aggregates through metal⋅⋅⋅metal/π⋅⋅⋅π interactions,[51-54] which give rise to various excited states. The combined effect of the counter ion
nature, the solution concentration and the solvent polarity modulates the photophysical properties of these complexes. On this basis, the 459 nm (Pt_1) and 455 nm (Pt_3) absorption bands in the first spectral region above identified, are attributed to a metal‐metal‐to‐ligand charge transfer (MMLCT) excited state, indicative of Pt–Pt dimerization in Pt_1 and Pt_3, both bearing the chlorine ancillary ligand. When this ligand is replaced by a benzoate, as in the case of Pt_2 and Pt_4, the bands at 459 and 469 nm, respectively, are attributed to a π–π* transition of the tpy–tpy bound dimer, the Pt–Pt interaction being hampered by the steric hindrance of the gallate ligand. The absorption bands in the second spectral region (superimposable in the DMSO‐dissolved complexes, and slightly redshifted in the CH2Cl2‐dissolved compounds) are due to a metal‐to‐ligand
charge transfer (d–π* MLCT) transition from PtII to the tpy ligand. Finally, the bands in the third
region are attributed to a ligand‐centred (π–π*LC) transition on the tpy ligand. Pt_1 and Pt_3 show an emission band at 620 and 615 nm, respectively, owing to the 3MMLCT deactivation.
The Pt_2 and Pt_4 broad, unstructured emission band (peaked at 600 and 650 nm, respectively) is ascribed to an excimeric emission, which accounts for the large Stokes shift observed for Pt_4 compared with Pt_1 and Pt_3; the blueshift observed for Pt_2 emission is ascribed to the different solvent in which the compound has been dissolved. This different aspect of the emission spectra of the complexes bearing a chlorine as an ancillary ligand (Pt_1 and Pt_3) compared with those that bind a gallate (Pt_2 and Pt_4), confirms the different attribution of the lowest excited state, that is, an MMLCT in the case of the first pair, and an excimer (formed by means of π–π interactions between the aromatic rings of tpy) in the case of the second pair.
In the Supporting Information (Figure SI‐21), the absorption spectra of platinum complexes at different concentrations are reported. It can be seen that as the concentration increases, the ratio between the bands attributed to the intermolecular interactions and those attributed to transitions on the single molecule, tends to grow, which is evidence for aggregation in solution.
Emission spectra recorded from solid samples at room temperature (Figure 6 c) have the same structure as those collected in solution under the same conditions. All show a redshift with respect to the solutions, but more accentuated for the complexes that bind chlorine (Pt_1 and Pt_3, which emit with a maximum at 676 and 690 nm, respectively) than for those that bind benzoate (Pt_2 and Pt_4, which emit with a maximum at 650 and 660 nm, respectively). Emission quantum yields and lifetimes in the condensed phase undergo a significant variation with respect to the values recorded in solution for Pt_2 and Pt_4, but this variation is much more consistent for Pt_1 and Pt_3 (see Table 4 and Table 5). In fact, the complexes bearing chlorine in solid samples show a redshifted emission maximum and an enhancement of the luminescence intensity with respect to the solution, whereas for the complexes with benzoate ligand these differences are smaller. This behaviour reflects the different origin of the emitting state for the two classes of compounds: for Pt_1 and Pt_3, the small steric hindrance of chlorine reinforces the Pt–Pt interaction in the solid, giving rise to an MMLCT excited state. On the contrary, the bulky benzoate group in Pt_2 and Pt_4 does not allow a Pt–Pt interaction, whereas weak π–π interactions on the tpy ligands give rise to the formation of excimers, similarly to the solution.
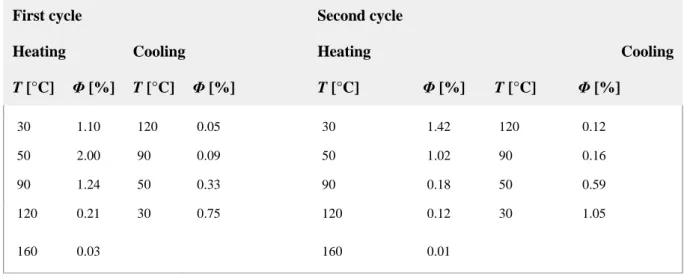
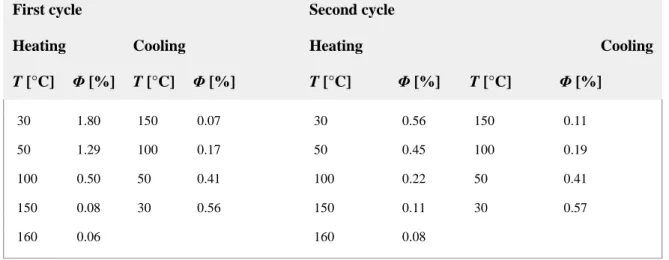
The photophysical behaviour of Pt_2 and Pt_4 was explored by changing the temperature. Both samples continue to emit during the heating and cooling cycles between 30 and 160 °C, retaining their emission maxima exhibited in the solid sample, that is, 650 nm and 660 nm for Pt_2 and Pt_4, respectively. The emission quantum yields have been measured at various temperatures (Table
6 and Table 7). For Pt_2, two heating/cooling cycles have been recorded, interspersed with cooling
in the freezer (at −20 °C) for 30 min. For Pt_4, three cycles have been performed; between the end of the second cycle and the start of third cycle, the sample was cooled in the fridge (at 4 °C) for 2 h.
Table 6. Quantum yields for Pt_2 by varying the temperature; emission maximum λmax=650 nm.
First cycle Second cycle
Heating Cooling Heating Cooling
T [°C] Φ [%] T [°C] Φ [%] T [°C] Φ [%] T [°C] Φ [%] 30 1.10 120 0.05 30 1.42 120 0.12 50 2.00 90 0.09 50 1.02 90 0.16 90 1.24 50 0.33 90 0.18 50 0.59 120 0.21 30 0.75 120 0.12 30 1.05 160 0.03 160 0.01
Generally, the quantum yield decreases as the temperature increases, owing to thermal agitation, which favours the non‐radiative deactivation pathway. For Pt_4, the experimental data follow this trend, after an initial steeper decrease on first heating, related to the development of the LamColr structure with the softening of the sample. Values on cooling and second heating stabilise
around 0.5 % in this phase and decrease to 0.2 % in the less‐ordered LamCol phase, prior to
dropping to below 0.1 % in the isotropic liquid state. This rational dependence upon structure contrasts with findings for the Pt_2 sample, which shows an increase in the quantum yield during the first cycle, whereas from the beginning of the second cycle, the emission quantum yield is higher than the value measured in the solid. This peculiar behaviour can be rationalised by considering that on heating Pt_2 during the first cycle eliminates one gallate unit and the metal centres are getting closer, which explains the increase of luminescence by Pt–Pt interactions.
Table 7. Quantum yields for Pt_4 by varying the temperature; emission maximum λmax=660 nm.
First cycle Second cycle
Heating Cooling Heating Cooling
T [°C] Φ [%] T [°C] Φ [%] T [°C] Φ [%] T [°C] Φ [%] 30 1.80 150 0.07 30 0.56 150 0.11 50 1.29 100 0.17 50 0.45 100 0.19 100 0.50 50 0.41 100 0.22 50 0.41 150 0.08 30 0.56 150 0.11 30 0.57 160 0.06 160 0.08
The absorption spectra of Zn_1 and Zn_2 complexes recorded in CH2Cl2 solution (Figure 7 a)
show a series of bands (Table 4) in the UV portion of the electromagnetic spectrum, all originating from tpy LC transitions.[55-56]
In particular, for Zn_2, these transitions overlap with those localised on the benzoate ligand, giving rise to a broad band below 300 nm. Interestingly, by comparing the absorption spectra of the zinc complexes with that of the tpy ligand (see Figure SI‐20 in the Supporting Information), it can be noted that in this last one the bands above 300 nm are very low in intensity, whereas in the absorption spectra of the complexes, these bands have an intensity comparable with those of the other bands. This different spectral behaviour is due to the different symmetry of the free and zinc‐ bonded terpyridine; the free tpy shows the nitrogen atoms of the lateral pyridines both facing the opposite side with respect to the nitrogen atom of the central pyridine,[56] whereas when the tpy
showing an asymmetric emission band at 365 nm (with a vibronic shoulder at 386 nm) for Zn_1, and at 379 nm (and a long tail extending towards the green spectral range) for Zn_2 (Figure 7 a). The luminescence intensity is quite high, with an emission quantum yield of 6.4 % for Zn_1 and 24.5 % for Zn_2; time‐resolved measurements give a mono‐exponential decay of the excited states, with lifetimes of, respectively, 1.2 and 2.7 ns (Table 4). By comparing the photophysical properties of the two zinc complexes, it is evident that the substitution of the two chlorine atoms with two electron‐donor benzoate groups involves a lowering of the energy of the emitting state, an increase of the Stokes shift and, above all, a considerable increase in the emission quantum yield.
Figure 7 (a) Absorption (continuous line) and emission (dashed line) spectra of ZnII complexes in
CH2Cl2 solutions at room temperature. (b) Emission spectra of ZnII in the pristine condensed states
at room temperature.
In the pristine condensed states (Figure 7 b), both samples are fluorescent. Comparing the luminescence properties of Zn_1 in solution (Table 4) with those measured in the condensed state (Table 5), the emission maximum remains almost unchanged (365 vs. 360 nm, respectively), whereas the quantum yield doubles from 6.4 % to 15.8 %, and the lifetime increases from 1.2 ns to 78.5 ns. This behaviour is attributable to the reduction of non‐radiative de‐excitation pathways that occurs in the solid phase, where the vibronic modes of the single molecule are somewhat reduced. If we compare the behaviour of Zn_2 in solution (Table 4) with the pristine condensed phase (Table
5), we first notice a consistent redshift of the emission band (379 nm in solution vs. 450 nm in
condensed phase), a drastic reduction of the quantum yield from 24.5 % to 7.1 % and different kinetics of the excited‐state decay: mono‐exponential in solution (with a lifetime of 2.7 ns) and multi‐
exponential in the pristine condensed phase, with a relevant percentage of short lifetimes (Table
5). The effect of temperature variation on the photophysical properties of Zn_2 is reported in Table 8. The temperature increase (both during the first and the second heating/ cooling cycle) involves
a redshift of the emission band and a decrease of quantum yield. As found for Pt_4, trends are reversible by decreasing the temperature, but the initial higher values are never restored in relation to the structural changes on first heating. The columnar structure of the Zn complex is indeed initially disordered, with only average distances between irregularly arranged columns (Figure SI‐ 16 in the Supporting Information), and the regular hexagonal arrangement only develops with the softening of the sample on first heating. Such a transformation clearly creates interactions between the compounds, which stabilise the excited state, as indicated by the redshift of the emission band, whereas the quantum yield decreases owing to the non‐radiative deactivation increase triggered by the high temperature.
Table 8. Emission maximum and quantum yields for Zn_2 by varying the temperature. Emission
maximum varies with temperature.
First cycle Heating Cooling T [°C] λmax [nm] Φ T [°C] λmax [nm] Φ 30 450 7.1 80 497 1.92 80 478 4.97 30 478 2.98 140 (isotropic) 507 0.71 Second cycle Heating Cooling T [°C] λmax [nm] Φ T [°C] λmax [nm] Φ 30 478 2.98 80 493 1.63 80 500 1.35 30 482 3.27 140 (isotropic) 509 0.50
Conclusion
Luminescent metallomesogens are promising functional materials for various display applications. Although considered as an emerging and growing field of research, there are still relatively few reported examples of square‐planar PtII and octahedral IrIII complexes being considered as
phase type, transition temperatures and thermal stability as well as to improve their luminescence in the mesophases.
The use of lipophilic gallate units is shown to be a good strategy in inducing low‐temperature liquid crystalline properties in terpyridine‐based PtII and ZnII coordination complexes by an elegant and
straightforward synthetic approach. The tpy ligand also was functionalised with a long alkyl chain, which ends with a methyl ester group, allowing further functionality derivatisation.
Only one Zn complex (Zn_2) and one thermally stable Pt complex (Pt_4) exhibited mesomorphic properties, the latter forming an original LamColr mesophase of p2mg symmetry, for which self‐
assembly and a structural model were proposed and discussed.
The photophysical properties of the complexes were investigated in solution and in the condensed state. In this work, we have highlighted the role of the metal in determining the type of excited state responsible for the emission, and the role of the ancillary ligand in driving intermolecular interactions. In the case of a d‐block open‐shell metal, such as platinum, we have studied the role of metal–metal interactions in the formation of excited states involving the metal centre, and the steric hindrance of the ancillary ligands in directing such interactions. For Pt_1 and Pt_3 the small steric hindrance of chlorine allows a Pt–Pt interaction (already present in solution and more strongly reinforced in the solid), giving rise to an MMLCT excited state in the mesophase. On the contrary, the bulky benzoate group of Pt_2 and Pt_4 does not allow a Pt–Pt interaction, whereas weak π–π interactions on the tpy ligands give rise to the formation of excimers, similarly to the solution.
Instead, in the case of a closed‐shell metal such as zinc, the excited states are typically located on the ligand, so any variation of the intermolecular interactions (different in solutions rather than in the various condensed phases), which modifies the distances between the ligands of neighbouring complexes, entails a variation of the emission wavelength.
Finally, the presence of a metal centre, providing the optical properties tuning, requires great attention during molecular design, as the excited electronic states responsible for the luminescence can be modified by the supramolecular interactions that occur in the mesophase. The gallate unit, although beneficial for inducing room‐temperature mesomorphism for both metal centres, is detrimental for the luminescence of the PtII complexes, whereas it is more favourable for the
synthesis of luminescent ZnII complexes. However, whereas in solution the Zn_2 complex is a good
emitter, in columnar mesomorphic organisation its luminescence decreases. The great sensitivity of the metal centre with respect to its molecular environment is a potentially good property, which will be further exploited in sensing applications.
Acknowledgements
This research was partially supported by Regione Calabria (POR Calabria FESR
2014/2020‐Azione 1.2.2) through the MERAVIGLIE project. M.L.D. and G.D.M. are
grateful to Dr. Angela Candreva for her collaboration in spectral acquisition. We thank
the Pohang Accelerator Laboratory (PAL) for giving us the opportunity to perform the
GIWAXS measurements, MEST and POSTECH for supporting these experiments, Dr.
Hyungju Ahn for adjustments and help, and other colleagues from the 9A USAXS
beamline for assistance. E.V., B.D. and B.H. thank the CNRS and University of
Strasbourg for support. A.A.A., M.A.S., E.I.Sz. and O.C. acknowledge the Romanian
Academy, Program 4. A.A.A. is grateful for an “Ion Heliade Radulescu” mobility
scholarship.
References
1 D. Pucci, B. Donnio, Handbook of Liquid Crystals: Metal-Containing Liquid Crystals, Vol. 5:
Non-Conventional, Supramolecular, Chromonic and Amphiphilic Liquid Crystals (Eds.: ),
Wiley-VCH, Weinheim, 2014, ISBN: 9783527671403. Google ScholarSFX
2 Y. Wang, J. Shi, J. Chen, W. Zhu, E. Baranoff, J. Mater. Chem. C 2015, 3, 7993– 8005.
CrossrefCASWeb of Science®Google ScholarSFX
3 X. Yang, X. Wu, D. Zhou, J. Yu, G. Xie, D. W. Bruce, Y. Wang, Dalton
Trans. 2018, 47, 13368– 13377.CrossrefCASPubMedWeb of Science®Google ScholarSFX
4 X. Wu, G. Xie, C. P. Cabry, X. Xu, S. J. Cowling, D. W. Bruce, W. Zhu, E. Baranoff, Y. Wang, J. Mater. Chem. C 2018, 6, 3298– 3309.CrossrefCASWeb of Science®Google ScholarSFX
5 C. Cuerva, J. A. Campo, M. Cano, C. Lodeiro, Chem. Eur. J. 2016, 22, 10168– 10178.Wiley Online LibraryCASPubMedWeb of Science®Google ScholarSFX
6 C. Cuerva, J. A. Campo, M. Cano, M. Caño-García, J. M. Otón, C. Lodeiro, Dyes
Pigm. 2020, 175, 108098.CrossrefCASWeb of Science®Google ScholarSFX
7 A. Kishimura, T. Yamashita, K. Yamaguchi, T. Aida, Nat.
Mater. 2005, 4, 546– 549.CrossrefCASPubMedWeb of Science®Google ScholarSFX
8 Y. Wang, C. P. Cabry, M. Xiao, L. Male, S. J. Cowling, D. W. Bruce, J. Shi, W. Zhu, E. Baranoff, Chem. Eur. J. 2016, 22, 1618– 1621.Wiley Online LibraryCASPubMedWeb of Science®Google ScholarSFX
9 X. Wu, M. Zhu, D. W. Bruce, W. Zhu, Y. Wang, J. Mater. Chem.
C 2018, 6, 9848– 9860.CrossrefCASWeb of Science®Google ScholarSFX
10 A. M. Prokhorov, A. Santoro, J. A. G. Williams, D. W. Bruce, Angew. Chem. Int.
Ed. 2012, 51, 95– 98;Wiley Online LibraryCASPubMedWeb of Science®Google ScholarSFX Angew.
Chem. 2012, 124, 99– 102.Wiley Online LibraryGoogle ScholarSFX
11 A. Santoro, A. M. Prokhorov, V. N. Kozhevnikov, A. C. Whitwood, B. Donnio, J. A. Williams, D. W. Bruce, J. Am. Chem. Soc. 2011, 133, 5248– 5251.CrossrefCASPubMedWeb of Science®Google ScholarSFX
12 N. S. S. Kumar, M. Z. Shafikov, A. C. Whitwood, B. Donnio, P. B. Karadakov, V. N. Kozhevnikov, D. W. Bruce, Chem. Eur. J. 2016, 22, 8215– 8233.Wiley Online
LibraryCASPubMedWeb of Science®Google ScholarSFX
13 R. Bayón, S. Coco, P. Espinet, Chem. Eur. J. 2005, 11, 1079– 1085.Wiley Online LibraryCASPubMedWeb of Science®Google ScholarSFX
14 K. Fujisawa, N. Kawakami, Y. Onishi, Y. Izumi, S. Tamai, N. Sugimoto, O. Tsutsumi, J. Mater.
Chem. C 2013, 1, 5359– 5366.CrossrefCASWeb of Science®Google ScholarSFX
15 K. Fujisawa, Y. Okuda, Y. Izumi, A. Nagamatsu, Y. Rokusha, Y. Sadaike, O. Tsutsumi, J.
Barberá, I. Lantero, S. Moyano, J. L. Serrano, A. Elduque, R. Giménez, Chem. Eur.
J. 2010, 16, 14545– 14553.Wiley Online LibraryCASPubMedWeb of Science®Google ScholarSFX
17 E. Cavero, S. Uriel, P. Romero, J. L. Serrano, R. Giménez, J. Am. Chem.
Soc. 2007, 129, 11608– 11618.CrossrefCASPubMedWeb of Science®Google ScholarSFX
18 M. Iliş, M. Micutz, V. Cîrcu, J. Organomet. Chem. 2017, 836–837, 81– 89.CrossrefCASWeb of Science®Google ScholarSFX
19 M. Iliş, D. Batalu, I. Pasuk, V. Cîrcu, J. Mol. Liq. 2017, 233, 45– 51.CrossrefCASWeb of Science®Google ScholarSFX
20 M. Micutz, M. Iliş, T. Staicu, F. Dumitraşcu, I. Pasuk, Y. Molard, T. Roisnel, V. Cîrcu, Dalton
Trans. 2014, 43, 1151– 1161.CrossrefCASPubMedWeb of Science®Google ScholarSFX
21 M. J. Mayoral, P. Ovejero, J. A. Campo, J. V. Heras, E. Pinilla, M. R. Torres, C. Lodeiro, M. Cano, Dalton Trans. 2008, 6912– 6924.CrossrefCASPubMedWeb of Science®Google ScholarSFX
22 M. J. Mayoral, P. Ovejero, J. A. Campo, J. V. Heras, M. R. Torres, C. Lodeiro, M. Cano, New
J. Chem. 2010, 34, 2766– 2776.CrossrefCASWeb of Science®Google ScholarSFX
23 D. Pucci, A. Bellusci, A. Crispini, M. Ghedini, N. Godbert, E. I. Szerb, A. M. Talarico, J. Mater.
Chem. 2009, 19, 7643– 7649.CrossrefCASWeb of Science®Google ScholarSFX
24 D. Pucci, G. Barberio, A. Bellusci, A. Crispini, B. Donnio, L. Giorgini, M. Ghedini, M. La Deda, E. I. Szerb, Chem. Eur. J. 2006, 12, 6738– 6747.Wiley Online LibraryCASPubMedWeb of Science®Google ScholarSFX
25 D. Pucci, G. Barberio, A. Bellusci, A. Crispini, M. La Deda, M. Ghedini, E. I. Szerb, Eur. J.
Inorg. Chem. 2005, 2457– 2463.Wiley Online LibraryCASWeb of Science®Google ScholarSFX
26 D. Pucci, A. Crispini, M. Ghedini, E. I. Szerb, M. La Deda, Dalton
Trans. 2011, 40, 4614– 4622.CrossrefCASPubMedWeb of Science®Google ScholarSFX27 E. I. Szerb, A. M. Talarico, I. Aiello, A. Crispini, N. Godbert, D. Pucci, T. Pugliese, M. Ghedini, Eur. J. Inorg.
Chem. 2010, 3270– 3277.Wiley Online LibraryCASWeb of Science®Google ScholarSFX
28 D. Pucci, I. Aiello, A. Bellusci, A. Crispini, M. Ghedini, M. La Deda, Eur. J. Inorg.
Chem. 2009, 4274– 4281.Wiley Online LibraryCASWeb of Science®Google ScholarSFX
29 D. Pucci, A. Crispini, M. Ghedini, M. La Deda, P. F. Liguori, C. Pettinari, E. I. Szerb, RSC
Adv. 2012, 2, 9071– 9078.CrossrefCASWeb of Science®Google ScholarSFX
30 F. Camerel, R. Ziessel, B. Donnio, C. Bourgogne, D. Guillon, M. Schmutz, C. Iacovita, J.-P. Bucher, Angew. Chem. Int. Ed. 2007, 46, 2659– 2662;Wiley Online LibraryCASPubMedWeb of Science®Google ScholarSFX Angew. Chem. 2007, 119, 2713– 2716.Wiley Online LibraryWeb of Science®Google ScholarSFX
31 A. Y.-Y. Tam, K. M.-C. Wong, G. Wang, V. W.-W. Yam, Chem.
Commun. 2007, 2028– 2030.CrossrefCASPubMedWeb of Science®Google ScholarSFX
32 A. Y.-Y. Tam, V. W.-W. Yam, Chem. Soc.
Rev. 2013, 42, 1540– 1567.CrossrefCASPubMedWeb of Science®Google ScholarSFX
33 Y. Chen, C.-M. Che, W. Lu, Chem.
Commun. 2015, 51, 5371– 5374.CrossrefCASPubMedWeb of Science®Google ScholarSFX
34 K. Li, G. S. M. Tong, Q. Wan, G. Cheng, W.-Y. Tong, W.-H. Ang, W.-L. Kwong, C.-M. Che, Chem. Sci. 2016, 7, 1653– 1673.CrossrefCASPubMedWeb of Science®Google ScholarSFX
35 Y. J. Yadav, B. Heinrich, G. De Luca, A. M. Talarico, T. F. Mastropietro, M. Ghedini, B. Donnio, E. I. Szerb, Adv. Opt. Mater. 2013, 1, 844– 854.Wiley Online LibraryWeb of Science®Google ScholarSFX
36 C. Oliviero Rossi, C. Cretu, L. Ricciardi, A. Candreva, M. La Deda, I. Aiello, M. Ghedini, E. I. Szerb, Liq. Cryst. 2017, 44, 880– 888.CrossrefWeb of Science®Google ScholarSFX
37 C. Cretu, A. A. Andelescu, A. Candreva, A. Crispini, E. I. Szerb, M. La Deda, J. Mater. Chem.
C 2018, 6, 10073– 10082.CrossrefCASWeb of Science®Google ScholarSFX
38 U. S. Schubert, S. Schmatloch, A. Precup, Des. Monomers
Polym. 2002, 5, 211– 221.CrossrefCASWeb of Science®Google ScholarSFX
39 X. Yao, X. Zeng, M. Xue, L. Cseh, Y. Liu, G. Ungar, Nanoscale
Horiz. 2017, 2, 43– 49.CrossrefCASPubMedWeb of Science®Google ScholarSFX
40 G. Annibale, M. Brandolisio, B. Pitteri, Polyhedron 1995, 14, 451– 453.CrossrefCASWeb of Science®Google ScholarSFX
41 E. I. Szerb, D. Pucci, A. Crispini, M. La Deda, Mol. Cryst. Liq. Cryst. 2013, 573, 34– 45.
CrossrefCASWeb of Science®Google ScholarSFX
42 C. J. Whiteoak, G. Salassa, A. W. Kleij, Chem. Soc.
43 S. Chakraborty, P. Mondal, S. K. Prasad, D. S. S. Rao, C. R. Bhattacharjee, J. Mol.
Liq. 2017, 246, 290– 301.CrossrefCASWeb of Science®Google ScholarSFX
44 B. A. Gregg, M. A. Fox, A. J. Bard, J. Chem. Soc. Chem.
Commun. 1987, 1134– 1135.CrossrefCASWeb of Science®Google ScholarSFX
45 W. J. Geary, Coord. Chem. Rev. 1971, 7, 81– 122.CrossrefCASWeb of Science®Google ScholarSFX
46 G. B. Deacon, R. J. Phillips, Coord. Chem. Rev. 1980, 33, 227– 250.CrossrefCASWeb of Science®Google ScholarSFX
47 D. Myśliwiec, B. Donnio, P. J. Chmielewski, B. Heinrich, M. Stępień, J. Am. Chem.
Soc. 2012, 134, 4822– 4833.CrossrefCASPubMedWeb of Science®Google ScholarSFX
48 D. E. C. Corbridge, E. G. Cox, J. Chem. Soc. 1956, 594– 603.CrossrefCASWeb of Science®Google ScholarSFX
49 The Cambridge Structural Database. V. Phillips, F. G. Baddour, T. Lasanta, J. M. Lopez-de-Luzuriaga, J. W. Bacon, J. A. Golen, A. L. Rheingold, L. H. Doerrer, Inorg. Chim.
Acta 2010, 364, 195– 204.CrossrefCASWeb of Science®Google ScholarSFX
50 The Cambridge Structural Database. J. Zhao, I. A. Khan, F. R. Fronczek, Acta Crystallogr.
Sect. E 2011, 67, o 316–o 317.CrossrefGoogle ScholarSFX
51 J. A. Bailey, M. G. Hill, R. E. Marsh, V. M. Miskowski, W. P. Schaefer, H. B. Gray, Inorg.
Chem. 1995, 34, 4591– 4599.CrossrefCASWeb of Science®Google ScholarSFX
52 V. W.-W. Yam, K. M.-C. Wong, N. Zhu, J. Am. Chem.
Soc. 2002, 124, 6506– 6507.CrossrefCASPubMedWeb of Science®Google ScholarSFX
53 S. C. F. Kui, Y.-C. Law, G. S. M. Tong, W. Lu, M.-Y. Yuen, C.-M. Che, Chem.
Sci. 2011, 2, 221– 228.CrossrefCASWeb of Science®Google ScholarSFX
54 G. Arena, G. Calogero, S. Campagna, L. Monsú Scolaro, V. Ricevuto, R. Romeo, Inorg.
Chem. 1998, 37, 2763– 2769.CrossrefCASPubMedWeb of Science®Google ScholarSFX
55 X. Chen, Q. Zhou, Y. Cheng, Y. Geng, D. Ma, Z. Xie, L. Wang, J.
Lumin. 2007, 126, 81– 90.CrossrefCASWeb of Science®Google ScholarSFX
56 W. Goodall, J. A. G. Williams, Chem.
Commun. 2001, 2514– 2515.CrossrefCASPubMedWeb of Science®Google ScholarSFX
57 K. F. Bowes, I. P. Clark, J. M. Cole, M. Gourlay, A. M. E. Griffin, M. F. Mahon, L. Ooi, A. W.Parker, P. R. Raithby, H. A. Sparkes, M. Towrie, CCDC 263509: Experimental Crystal Structure Determination 2005, https://doi-org.scd-rproxy.u-strasbg.fr/10.5517/cc8v69l.Google ScholarSFX