HAL Id: tel-00109864
https://tel.archives-ouvertes.fr/tel-00109864
Submitted on 25 Oct 2006HAL is a multi-disciplinary open access archive for the deposit and dissemination of sci-entific research documents, whether they are pub-lished or not. The documents may come from teaching and research institutions in France or
L’archive ouverte pluridisciplinaire HAL, est destinée au dépôt et à la diffusion de documents scientifiques de niveau recherche, publiés ou non, émanant des établissements d’enseignement et de recherche français ou étrangers, des laboratoires
To cite this version:
Ida Di Carlo. Experimental simulation of pre-eruptive conditions of“yellow pumice”-Stromboli (Aeo-lian arc)-Italy. Applied geology. Università degli studi di Palermo, 2005. English. �tel-00109864�
Unione Europea
Fondo Sociale Europeo Ministero dell’Università e della Ricerca Scientifica e Tecnologica Università degli Studi di Palermo
Tesi cofinanziata dal Fondo Sociale Europeo PROGRAMMA OPERATIVO NAZIONALE 2000/2006 “Ricerca Scientifica, Sviluppo Tecnologico, Alta Formazione”
Misura III.4 “Formazione Superiore e Universitaria”
Experimental simulation of pre-eruptive conditions of
“yellow pumice”-Stromboli
(Aeolian arc)-Italy
PhD thesis by:
Tutor:
Ida Di Carlo
Dott. S.G. Rotolo
Prof. M. Valenza
DOTTORATO DI RICERCA IN GEOCHIMICA XVI CICLO (LUGLIO.2001– GIUGNO.2004)
Dipartimento di Chimica e Fisica della Terra ed Applicazioni alle Georisorse ed ai Rischi Naturali (CFTA)
Aeolian Islands from the Vulcano crater
…..Au-dessus de notre tête, à cinq cents pieds au plus, s’ouvrait le cratère d’un volcan par lequel s’échappait, de quart d’heure en quart d’heure, avec une très forte détonation, une haute colonne de flammes,
mêlée de pierres ponces, de cendres et de laves. Je sentais les convulsions de la montagne qui respirait à la façon des baleines, et
rejetait de temps à autre le feu et l’air par ses énormes évents. …. “Dove noi siamo …Come si noma quest’isola ? “
“Stromboli”…
JULES VERNE, VOYAGE AU CENTRE DE LA TERRE
INDEX
I
NTRODUCTION1
1. V
OLCANOLOGICAL BACKGROUND 41.1The Aeolian Archipelago volcanic arc 4
1.2 Stromboli: petrology 6
1.3 Stromboli: volcanic activity 9
1.4 Volatiles in Stromboli magmas 11
2.
T
HE YELLOW PUMICE(YP)
12
2.1 Petrology of the yellow pumice: literature studies 12
2.2 The starting material for experiments: the PST 9 yellow pumice 17
3.
E
XPERIMENTAL AND ANALYTICAL METHODS25
3.1 Experimental strategy 25
3.1.1 Glass preparation 25
3.1.2 Experimental containers 25
3.1.3 Experimental charge preparation 25
3.1.4 Experimental equipment 26
3.1.5 Control and monitoring of oxygen fugacity 28
3.2 Analytical techniques and methodology 31
3.2.1 Scanning Electron Microscope and Electron Microprobe 31
3.2.2 Karl Fischer Titration 33
3.2.3 Infrared Spectroscopy 34
4.
E
XPERIMENTAL RESULTS38
4.1 Attainment of equilibrium, quench crystallisation and iron-loss 38
4.2 Phase equilibria: the 1 bar isobaric section 41
4.3 Phase equilibria: the 4 kbar isobaric section 44
4.3.1 Phase equilibria 44
4.3.1.2 Effect of sulphur in oxidizing conditions 49
4.3.1.3 Mixed fluid (H2O+CO2) experiments 51
4.4 Phase equilibria: the 1100°C isothermal section 53
4.5 Composition of experimental products 57
4.5.1 Mineral phases 61
4.5.1.1 Clinopyroxene 61 4.5.1.2 Olivine 64 4.5.1.3 Plagioclase 65 4.5.2 Glasses 65
4.5.3 Last considerations: S-and CO2-bearing charges 68
5.
D
ISCUSSION70
5.1 Is the yellow pumice magma a primitive magma? 70
5.2 The yellow pumice magma 72
5.3 From yellow pumice to black scoria: 73
5.4 Some considerations about H2O-CO2 solubility 78
C
ONCLUSIONS81
A
CKNOWLEDGEMENTS84
R
EFERENCES85
APPENDIX 94
In the most recent years big attention was been addressed to the volcanic hazard. Stromboli is characterized by a persistent activity. Hazards associated with volcanic activity at Stromboli may include gas emissions and fall-outs of volcanic ash and bombs, but more global hazards can not be dismissed such as large-scale eruptions or tsunamis generated in the Tyrrhenian sea as a result of flank collapse of the volcano. Stromboli is actively monitored by italian groups and institutions. The present project complements these efforts in providing an experimentally-based modelling of how magma ascends beneath Stromboli. Knowledge of the physicochemical properties of magmas may improve in the long-term the interpretation of geophysical signals and the understanding of the real-time behaviour of the volcano.
Its normal activity is periodically interrupted by emission of lava flow or much more energetic explosions. The most energetic explosions are distinguished in major explosions (1-2 per year) and paroxysms (one event in 5 to 15 years).
Most of the existing works and dynamic models of the Stromboli’s activity are done on the normal activity, but, maybe, studying the paroxysm can be the important means to understand its persistent activity.
The paroxysm permits to study mingling, crystallisation and degassing processes in the volcanic system. During major explosion and paroxysm, a particular product constituted by a yellow pumice intermingled with a black scoria is emitted. The yellow pumice is a crystal-poor (< 10 vol % of crystals), gold-coloured, highly vesiculated pumice and represent the most primitive magma ever erupted at Stromboli; the black scoria is crystal-rich (~50 vol % of crystals), rather dense, lower vesiculated, usual product of the normal activity. The two portions are so different in features, but so similar in bulk chemical composition ranging from K-rich basalt and shoshonitic basalt. They display only slight variations in major and trace elements contents, and rare earth element patterns. The very big differences are played by the volatile content (H2O-CO2-S) on the two part of rock.
The aims of this petrological experimentally study are: (i) to characterize the source region of magmatism, (ii) to constrain the P-T-aH2O during the ascent path of yellow pumice magma, (iii) to constrain the derivation of the black scoria from the yellow pumice magma during the rapid ascent path in the shallow level of the Stromboli conduit.
The volatiles constituents play a narrower importance in the phase relations as in the chemical and physical properties of the magmas. We planned two series of experiments, an isobaric 4 kbar (1175-1050°C) section and an isothermal 1100°C (4-0.5 kbar) section, in variable water content, from undersaturation near to the water saturation. We chosen as starting material one of the most primitive yellow pumice never erupted. The starting composition will be prepared as glass, to avoid any residual crystal, and glass finely crushed. Some additional experiment was carried out in order to ascertain the
CO2 +/- S).
According our experimental data yellow pumice is a near primitive magma in equilibrium with clinopyroxenite source at P-T of stagnation: the first phase to appears on the liquidus is pyroxene; olivine follows at lower temperature, for lower hydration conditions. Clinopyroxene plays an important role at higher pressure conditions (4 kb), plagioclase instead is the most relevant phase at lower pressure. It was possible to derive an experimental geobarometer from the cotectic ol/cpx ratio: if we apply this correlation between pressure and cpx(ol ratio, we can obtain a pressure of crystallisation for yellow pumice (3.7-2.9 kb) and black scoria (1.2-0.6 kb). Our experimental data, show a clear correlation between Ca content in clinopyroxene and water content in the melt and this correlation can be used a geohygrometer in the 3-phase assemblage, to infer the water content in natural samples. The last important results are about empirical solubility data of both together H2 O-CO2 that are in bad accordance with most used thermodynamic models that overestimate the pressure of saturation of nearly 50%
Stromboli volcano is the northeasternmost volcanic island of the Aeolian archipelago. It represents one of the most visited volcanoes in the world due to its exceptionally persistent status of activity, documented to have begun at least 20 centuries ago. Activity is characterised by open-conduit degassing and intermittent explosions which take place at intervals of 10-20 minutes and are manifested by molten-lava jets and gas emissions. The “normal” behaviour of the volcano (“Strombolian” activity) is periodically interrupted by emission of lava flows or much more energetic explosions.
The most energetic explosions are distinguished in: major explosions (1-2 per year) and paroxysms (one event in 5 to 15 years). The most important and dangerous paroxysms during last hundred years occurred in 1919 and 1930.
Due to its continuous and potentially hazardous activity, Stromboli is monitored from several points of view (seismological, geochemical, petrological), but the majority of dynamic models of the Stromboli’s activity have been based on the observations of the “normal” activity. Our opinion is that the study of products emitted during major explosions offers a unique window on the deep volcano feeding system, giving thus a key to understand also the “normal” activity. In fact, only during major explosions and paroxysm, is emitted very light aphyric pumice (yellow pumice , hereafter YP) often intermingled with a crystal rich scoria (black scoria, hereafter BS).
The YP is a crystal-poor (< 10 vol. % crystals), gold-coloured highly vesicular pumice. The BS is crystal-rich (~ 50 vol. % crystals), less vesiculated and typical of the normal activity. The YP and BS appear often intermingled and share similar bulk chemical composition in major elements (High-K/Shoshonitic basalt) as well as in trace element contents. Conversely large differences are observed in volatile contents (H2O, CO2 and S in the melt inclusion trapped in these two rocks).
Olivines and clinopyroxenes are frequently complexly zoned while plagioclase is usually patchy zoned and also rimmed by tiny skeletal plagioclase individuals indicative of abruptly increased undercooling.
-2-uppermost part of the chamber consist of resident crystal-rich and volatiles-poor magma (the “resident magma”, i.e. the black scoria). It sustains the normal strombolian activity and it results from the low pressure crystallisation of yellow pumice magma. Yellow pumice instead represents the undegassed primitive parent magma.
This study is not a petrological-field study and intends to supply an experimental-petrology tool to understand the behaviour of Stromboli volcano, by simulating the conditions (P, T. fO2,
aH2O) experienced by primitive magmas from the deeper to the shallower level. In fact in the great effort that several researcher are carrying on, there is a macroscopic gap of knowledge in the results heretofore obtained consisting in the absolute lack of an experimental petrology support.
This experimental study has several targets: (i) to characterize the source region of magmatism, (ii) to constrain the pressure-temperature-fluid activity during the ascent paths of this primitive yellow pumice magma, (iii) to experimentally investigate the influence of H2O (and secondarily CO2 ± S) in this magma and the effects of these volatiles on the phase relations, and (iv) try to constrain the derivation of the black scoria from the yellow pumice magma during the rapid ascent path in the upper part of the Stromboli conduit, (v) try to depict a petrological model and to constrain the magma pre-eruptive conditions.
Yellow pumice (due to its aphyric, volatile rich, primitive characters, rapid ascent path) offers the unique opportunity to investigate a deeply rooted magma during its path to the surface. Are thus evident the bearings on the knowledge of the plumbing system of the volcano itself, as well on in the eruptive style.
Must be said here that this study should never have started without the efforts and the interest of CNRS-ISTO of Orléans (France), where the experimental work has been carried out, under the guidance of Michel Pichavant and Bruno Scaillet.
Particularly relevant are the experiments focused on volatiles solubility and on mixed volatiles. We simulated different XH2O, XCO2 during the rising paths of the magma, for progressively lower pressure conditions.
(1175-1050°C), but with two main guidelines:
a well characterised isobaric section at 4 kbar (the inferred storage region of yellow pumice), where experimental fO2 and H2Omelt were varied in a wide range;
an isothermal section at 1100°C in the pressure range 4 - 0.5 kbar, in order to simulate the ascent path. Secondarily, is also possible to examine experimental data along iso-oxybaric and iso-activity (aH2O) sections.
The P-T-fO2,fH2O constraints derived from our experiments will hopefully give an useful tool for geochemical petrological and geophysical research at Stromboli, but will also give an important basic knowledge about all primitive worldwide Ca-rich arc magmas.
This thesis is thus divided in five principal sections:
1. Petrological and volcanic background at Stromboli. We focused on characterisation of volcanic activity and principal petrological features at Stromboli.
2. Yellow pumice. Here the attention is on the characteristics of yellow pumice and the relationships between yellow pumice and black scoria. In particular we will deal with chemical, mineralogical and textural characteristics of our starting material.
3. Experimental and analytical methods. We describe the experimental and analytical machines. We illustrate experimental strategy: the choices, the obstacles and the proposed solutions.
4. Experimental results. We present the experimental data, linking chemical characteristics of mineral phases and glasses with pressure, temperature and fluids dissolved in the melt. We divide the results in two parts: an isobaric (4 kbar) and an isothermal (1100°C) section.
5. Discussion. Here we try to apply our experimental results to the natural system trying to constrain the magma evolution from the deep feeding system to the shallow-level.
1.1 The Aeolian Archipelago volcanic arc
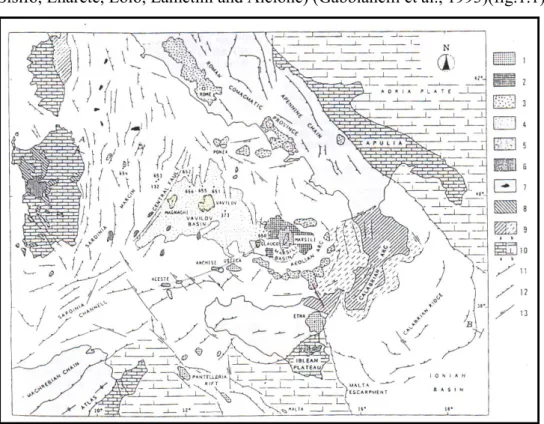
The Aeolian archipelago is a Quaternary volcanic arc that extends for ca. 200km along the inner side of the Calabria-Peloritani belt. It includes 17 major volcanoes forming islands and semounts (Sisifo, Enarete, Eolo, Lametini and Alcione) (Gabbianelli et al., 1993)(fig.1.1).
fig. 1.1: geodynamic setting and magmatic typology of the Tyrrhenian Sea.1: Extension-related
volcanism of Pleistocene age; 2: oceanic crust of Pleistocene age; 3. subduction-related volcanism of Pleistocene age: 4. oceanic crust of Pliocene age; 5: subduction-related volcanism of Pliocene age; 6: extension-related volcanism of Pliocene age; 7: Northern Tyrrhenian plutonic bodies of Late Miocene age; 8: Subduction-related volcanism of Oligocene-Early Miocene age; 9. calabrides units, a=emerged, b=submerged; 10: hinterland and foreland areas, a= emerged, b= submerged; 11:thrust; 12:extensional faults; 13: strike-slip fault. (from Ferrari and Manetti, 1993).
NE-SW for Panarea and Stromboli. The overall semicircular geometry of the Aeolian Volcanic Structure is interrupted by the trasverse lineament related to Eolie-Tindari-Letoianni crustal discontinuity (Romagnoli et al., 1989).
The ages of volcanism range from Pleistocene to present-day. Specifically Sisifo, Eolo and Enarete seamounts are 1-0.8 Ma years old. Salina 500-12ka and Panarea 650or 590 -10 ka seems the younger volcanoes.
The Aeolian volcanoes are founded on basement which thins from 40 km beneath northern Sicily, to about 18 km beneath the Aeolian region. Some authors suggest that the subduction process has ceased 1Ma ago and the Aeolian vocanism is due to the post-subduction extensional strain to the slab detachment beneath the Calabrian Arc and the south-eastern propagation of the Tyrrenian Sea opening (Esperança et al., 1992).
In the pyroclastics units of Salina, as well as in the Lipari (the famous “cordierite lavas”) were found frequent xenoliths of metamorphic basement on which the Aeolian arc lies and they include granites, gneisses, metapelites, carbonates etc. Much of the sub-arc crust may be of Hercynian age or younger (Ellam and Harmon, 1990).
Calcalkaline and high-K calcalkaline rocks are the most widely present among emitted products (from high-alumina basalts to dacites) and they dominate in the western sector of the archipelago. Shoshonitic rock series and potassic series (KS) are exclusive of Stromboli and younger series of Vulcano.
Any relationships between K2O content and time are vague and only locally applicable (Ellam et al., 1988).
For Ellam et al. (1988), Ellan and Harmon (1990) the processes is two stages: 1. source contamination by sediments subduction that gives rise to a range of Sr isotope ratios observed (0.7040-0.7075) and only small 18Oδ variation and 2. crustal assimilation and fractional crystallisation. They suppose that in the mantle wedge are coexisting two components (MORB and OIB)
Various evolutionary mechanisms have been proposed for the petrogenesis of single volcano: are recognised AEC (Assimilation and Equilibrium Crystallisation) process for Alicudi; AEC
volcano. For Stromboli an RTFA (Refilled Tapped Fractionating Assimilation) process has been proposed (Francalanci et al, 1989).
Francalanci et al. (1989, 1993) suggest a variable intense mantle metasomatism.
However the very strong evidence is that fractional crystallisation was accompanied by crustal contamination in the Aeolian magmas should be demonstrated by the characteristically low εNd and high εSr, signatures wish typify the involvment of upper continental crust.
1.2 Stromboli: petrography
Stromboli is a northernmost island of the Aeolian arc. Is a composite volcano and rises 3000 mt above sea floor.
All data confirm the entirely Upper Quaternary age of Stromboli. Gillot and Keller (1993) suggest ages of < 100.000 years for the emerged part of Stromboli and an age of ca. 200.000 years for Strombolicchio, remnant of an older edifice sited offshore NE of Stromboli island.
Most of product were erupted from central crater zone that is also the site of present day activity.
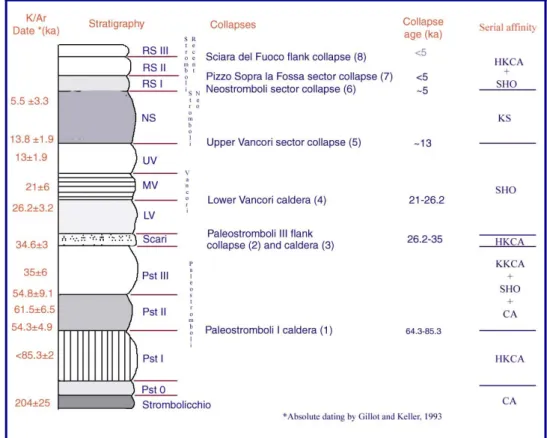
The inner structure of Stromboli volcano is complex because of the alternating building and destructive phases. The destructive phases ranges from slow erosion to rapid slope failure (Tibaldi 2001) and have several unconformities, which enabled Rosi (1980), Francalanci et al.,(1989), Hornig-Kjarsgaard et al (1993) and Pasquarè et al., (1993) to distinguish a succession of litostratigraphic units, representing the main volcanic system: Paleostromboli (I,II and III), Vancori (lower, middle and upper), Neostromboli and Recent Stromboli. Tibaldi (2001) added Paleostromboli 0 (PST0) unit, which represent undated, fracturated lava unconformably covered by Paleostromboli I (PST I) lavas, and he also divided recent Stromboli product in Recent Stromboli (RS I,II and III) (fig. 1.2 and 1.3). Several collapses separate the successions; the most important is the of Sciara del Fuoco collaps, which occurred ca 5000yrs ago (Bertagnini et Landi, 1996).
fig. 1.2: simplified stratigrafic column of the main geological units cropping out in the Island
of Stromboli and at Strombolicchio and collaps from Pasquarè et al. (1993), Hornig-Kjarsgaard et al (1993).Dates from Gillot and Keller (1993), collapse origin from Tibaldi et al. (1994). RS: recent Stromboli; NS: NeoStromboli; UV,MV,LV: Upper-Middle-Lower Vancori; Pst 0, I, II, III: PaleoStromboli.KS: ultra potassic; SHO: shoshonitic; HKCA: high-K; CA: calcalkaline.
One of the most interesting characteristic of this volcano is that dykes are not arranged in a typical radial pattern as observed in other volcanoes, but they developed preferentially along a NE trending weakness zone. The majority of dykes have been injected along the weakness zone cutting NE-SW the volcano summit (Pasquarè et al, 1993; Bonaccorso, 1998; Tibaldi, 2003).
As regards the chemistry of emitted products at Stromboli, on the K2O vs SiO2 classification diagram (Peccerillo and Taylor, 1976) the samples from the various cycles of activity covers all the serial interval calcalkaline, High-K calcalkaline, shoshonitic and ultra potassic series.
plagioclase and clinopyroxene. Olivine and orthopyroxene are present in the mafic and intermediate rocks of each series, respectively. Rocks of K-series have commonly leucite in their groundmass. Present day products are shoshonitic to high-K basalts (Francalanci et al., 2004).
fig.1.3: schematic geological map of the Island of Stromboli (I: early HKCA phase; II:CA
phase; III: early SHO phase, IV:HKCA phase; V: SHO phase; VI: KS phase; VII: recent HKCA and active SHO phase) (from Francalanci et al., 1989).
The composition of rocks belonging to the calcalkaline series (basaltic andesites to basalts)is relatively homogeneous. Crustal xenoliths are rather frequent, especially in the Strombolicchio neck. The High-K calcalkaline series is represented by rocks ranging from basalts to high-K andesites. The chemical variations within the High-K calcalkaline series indicate that fractional
simple FC with imperfect separation of mineral phases from the liquid may have been the most important mechanism responsible for the evolution of the High-K calcalkaline series. The greatest variations in silica content are in the rocks of the shoshonitic series (particularly the Vancori cycle), which range from shoshonitic basalts to trachytes; the latter is the more acidic product ever erupted at Stromboli. Thus fractional crystallisation is considered as the main evolutionary mechanism of the shoshonitic series turns out to be valid as well. The ultrapotassic volcanics are basic to intermediate in composition with silica abundances clustering around 52%, and K2O : 3.5-5 wt%. Francalanci et al. (1989) interpreted this series as composition deriving from assimilation of crustal material by hot mafic magma.
The variable 87Sr/86Sr ratios (0.7050 -0.7076) and trace element abundances in the Stromboli magmas may thus suggest mantle melts variably interacted with supra-crustal material, living a range of isotopically and geochemically distinct primary liquids.
The most reliable hypothesis is that geochemical variation in the mafic rocks could de generated by processes occurring during the ascent of magma to the surface: a primary liquid with CA composition underwent continuous FC and Assimilation in magma chamber (RTFA)(Francalanci et al., 1989).
1.3 Stromboli: volcanic activity
Stromboli volcano is characterised by a persistent state of activity, consistent of:
open-conduit degassing. The total daily discharge reaches the considerable range of 6000 - 12000 tons (Allard et al., 1994) depending upon activity. H2O is the most abundant component followed by CO2 , SO2 , HCl and HF.
intermittent low-energy explosions. consisting of frequent (3-6 events/hour ) throws of glowing scoriae, gas and ash to heights < 150 m above the summit vents
lava flows. Occur periodically. The last one was during December 2002-july 2003.
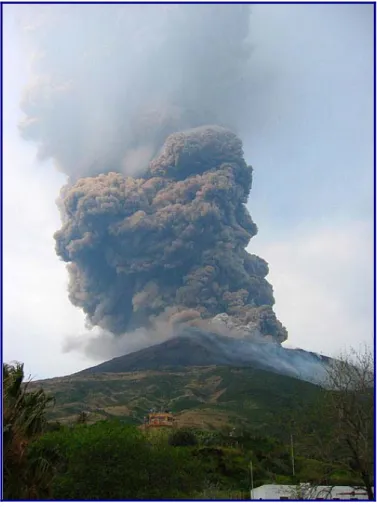
major explosions and paroxysm. Major explosions occur 1-3 times/year and consist in much higher jets than normal explosions. Paroxysms represent the less frequent
eruptions (fig.1.4), highly vesiculated yellowish pumice has been recorded, together with the scoria, normal product of the eruptions. Scoriae and pumices are often intermingled at the hand specimen scale. They presents the same bulk compositions, the same mineral assemblages, but different crystallinity and different vesicularity. The most striking differences between yellow pumice and black scoria is in the volatile contents (H2O, CO2, S, Cl) of olivine hosted melt inclusions: volatile-rich, primitive, melt inclusions for yellow pumice, volatile-poor for scoriae (Metrich et al., 2001).
fig. 1.4: photograph of 5 april 2003 paroxysm. Is well visible the column rich in cinder and
volatiles.
Most part of Stromboli activity is determined by degassing activity.
Gas flux measurements have revealed that Stromboli produces comparable amounts of gas and lava and that open conduit degassing is responsible for almost the total of gas output (Allard 2004).
Seven major and minor component constitute the gaseous phase emitted: H2O, CO2, SO2, HCl, HF, CO and COS (Allard et al., 2001).
Data for present-day volatile emissions can be applied to the long-lived volcanic activity of Stromboli. Variations in chemical ratio of gas proportion are observed during explosions and are consistent with fast rising of slugs, created under the craters, in the degassing out of equilibrium (Rayleigh distillation). In contrast, the non explosive gaseous phase is representative of equilibrium in the column (batch equilibrium degassing) (Allard et al., 2001). S/Cl ratios of 1.5-2, in the volcanic plume and in the crater, are consistent with quiescent degassing (Allard and Metrich, 2001); an anomalous sulphur degassing was highlighted some days before the 5 april 2003 event, where S/Cl was 9 (Aiuppa et al.,2004). This was interpreted as evidence of degassing from S-rich primitive magma ascending on the shallow part of the volcano.
Updated SO2 plume flux values measured by airborne COSPEC by Allard et al. (2000) is around 2.9 ±0.6 kg*s-1 and from this value and with measured ratio for different gases species (Allard and Metrich, 2001), we know the time averaged emission rates of H2O (25±5 kg*s-1), CO2 (10±2 kg*s-1) and HCl (0.8 kg*s-1).
Measurements of gas emitted are complement for information obtained from melt inclusions (Allard and Metrich, 2001; Metrich et al, 2001) where are measured the fluid hosted in more primitive and more evolved crystals.
As regard volatiles dissolved in magma, the melt inclusions data (hosting: olivine Fo90) clearly trapped H2O-and CO2 rich primitive melts (H2O = 1.8–3.4 wt. %, CO2 = 894-1689 ppm). The more evolved inclusions are instead crystallised at shallower depths and display a lower volatile content (H2O 0.05-0.6 wt. %, CO2<100 ppm). The volatile rich melt inclusions were in primitive yellow pumice, the volatile-poor ones in black scoria.
2.
T
HE YELLOW PUMICE(YP)
2.1 Petrology of the yellow pumice: literature studies.In the volcanological and petrological evolution of Stromboli, the crystal-poor yellow pumice (fig.2.1) plays an important role and provides constraints on deep feeding system and magma ascent dynamics.
fig.2.1: small fragment of yellow pumice, from a few cm-tick layer produced in a period
precedent to 1600 A.D. and subsequent to 800 A.D.
Pumices and scoriae at Stromboli are well distinguished by their mineral composition and zoning patterns (Metrich et al., 2001; Francalanci et al., 2004): olivine phenocrysts in pumice show a wide compositional range (Fo70-89) with Mg-rich outer rims (fig.2.2a), while those in
scoriae have a narrower range (Fo70-74) and no reversely zoned rims.
Clinopyroxene, both in pumices and scoriae, shows complex zoning patterns, from diopside to augite, but only in pumices it is characterized by Mg-rich outer rims (fig.2.2b). There is not a clear distinction between clinopyroxene composition of yellow pumice and black scoria (Francalanci et al., 2002).
Plagioclase in pumices covers the span of An 64-90, with Ca-rich outer rims (fig.2.2c & d); in
scoriae the compositional range is An 63-72, and calcic cores are common.
fig.2.2 : back-scattered electron image of crystals from yellow pumice (PST9).
a) olivine showing Mg-rich outer rim (Fo88) surrounded by glass. A crystallised melt inclusion visible close to the core of the crystal. b) well faceted phenocryst of clinopyroxene with frequent inclusion of plagioclase phenocryst and melt inclusion. c) plagioclase phenocryst crowded with glass inclusions. Note the 15µ-thick rim consisting of skeletal individuals d) of plagioclases. This particular texture mirrors an abrupt increase of undercooling, which occurred just before the eruption.
a)
Fo 88 Fo 70b)
c)
An 75 plgd)
b)
Important insights are provided by the study of melt inclusions (according to Metrich et al. 2001): primitive melt inclusion (CaO/Al2O3 up to 1.0) are hosted in Mg-rich olivine in
pumices (fig.2.3).
fig.2.3: back-scattered electron image of a phenocryst of Mg-rich olivine, with glass
inclusions. PST9 yellow pumice, natural sample.
The volatile contents of these primitive melt inclusion (H2O = 1.8–3.4 wt. %, CO2 =
894-1689 ppm, S = 1660-2250 ppm, Cl = 1660-2030 ppm, F = 649-680 ppm) helped to constrain the pressure of entrapment of this volatile-rich magma at approximately 3.5 kb (Bertagnini et al. (2003) and Landi et al.,(2004), using the Papale’s (1999) H2O-CO2 solubility model. In the
Fo 85
calculation they have obviously neglected the S content in the glasses. We tried to make some experiments with sulphur added in order to evaluate the sulphur solubility.
Scoriae are, on the other hand, characterized by volatile-poor melt inclusion (0.05-0.6 wt. % H2O, <100 ppm CO2, 1000-2600 ppm Cl, S below detection limit), reflecting the trapping of
an extensively degassed magma.
Both the mineral and melt-inclusion composition patterns strongly suggest that crystal-rich scoriae represent a crystal mush (the “resident magma”), degassed at low depth and being periodically replenished by the deep-seated volatile-rich crystal-poor yellow-pumice -magma. Syn-eruptive recycling of crystals from the crystal-rich to the crystal-poor magma explains the zoning and compositional patterns of the yellow-pumice phenocrysts (Metrich et al., 2001; Francalanci et al., 2004).
Additional important information from melt inclusions is applicable to chemical and textural zoning of plagioclase phenocrysts in black scoria (Landi et al. 2002; Landi et al. 2004), which show zoning ranging between An63-70 and more calcic zones An75-88 (fig.2.4).
The labradoritic layers are free of melt inclusions; the bytownitic layers, occur as discordant overgrowths on the dissolution surfaces and have typical sieve texture with abundant microscopic inclusions. The melt inclusions found at the interface between poor and An-rich plagioclase are strongly depleted in H2O, S and Cl. The fluctuation of the plagioclase
composition has been interpreted (Landi et al., 2004) as due to a stepwise replenishment of the shallow crystal-rich mush by volatile-rich melt batches. The high volatile content in the melts stabilizes An-rich plagioclase (Landi et al., 2004) and the sieve texture results from rapid degassing and subsequent crystallisation.
The 87Sr/86Sr isotopic signature of the yellow pumice and that of scoriae emitted over the past 100 years cluster at a mean value of 0.70626, with a small decrease (to 0.70617) in magmas erupted after 1985 (Francalanci et al., 1999; 2004).
fig.2.4: back-scattered electron image of plagioclase from black scoria of december
2002-april 2003 flank eruption (this sample which was collected on the Sciara del Fuoco scar, at an altitude of 650 m a.s.l, belongs to the lava flow of 10-1-2003). Zoned phenocryst consist of alternating of labradoritic and bytownitic layers with glassy inclusions in bytownitic layers.
An
79An
63An
70An
732.2 The starting material for experiments: the PST 9 (yellow pumice)
We have chosen the PST-9 yellow pumice as a starting material (tab.2.1 for composition).
SiO2 49.4 TiO2 0.79 Al2O3 15.75 Fe2O3 1.3 FeO 6.5 MnO 0.15 MgO 7.96 CaO 12.73 Na2O 2.27 K2O 1.85 P2O5 0.43 LOI 0.62 SUM 99.1 V 252 Cr 259 Co 130 Ni 75 Rb 55 Sr 701 Y 24 Zr 144 Nb 16 Cs 3.53 Ba 920 La 45 Ce 94 Pr 11 Nd 43 Sm 8 Eu 2 Gd 6 Tb 1 Dy 5 Ho 1 Er 2 Tm 0.3 Yb 2 Lu 0.3 Hf 3 Ta 4.5 Pb 16 Th 14 U 3 Cu 96 Major elements Trace elements
tab.2.1: chemical analysis of PST 9 whole rock.
Major elements ( wt%) analysed by ICP-AES; trace elements (ppm) analysed by ICP-MS. The analysis was performed at the Centre de la Recherche Petrographiques et Geochimiques (Nancy- France).<l.d. below detention limit.
This sample was recovered from a few cm-thick layer produced in the period precedent to 1600 A.D. and subsequent to 800 A.D. (M. Pompilio, personal communication). This yellow pumice layer was exposed in an exploration trench on the summit area of the volcano, at a height of 795 m a.s.l. and the sample was kindly supplied by Massimo Pompilio (INGV-Pisa). We note that all yellow pumices emitted over of the last few centuries, including the last eruption in April 2003, display a striking compositional similarity (fig. 2.5), in the bulk chemistry and the mineral and melt inclusion compositions (cf. Metrich et al., 2001; Bertagnini et al., 2003 ). Yellow pumice represents the more primitive and less phyric material erupted at Stromboli with robust evidence of rapid ascent path; consequently it represents the last available material to study Stromboli magmas from the experimental point of view. 0,0 0,5 1,0 1,5 2,0 2,5 3,0 3,5 4,0 48 53 58 63 68 SiO2 (wt%) K2O ( w t% ) Yellow Pumices Black Scoriae PST 9 (YP) Legend
fig.2.5: SiO2-K2O classification diagram (after Peccerillo and Taylor, 1976) for black scoria
and yellow pumice. Whole-rock samples data are from Francalanci et al. (1999), Rosi et al. (2000), Metrich et al. (2001), Bertagnini et al. (2003), Francalanci et al. (2004) and Landi et al. (2004). PST 9 (yellow pumice) is analysed at CRPG-Nancy-France.
PST-9 is strongly vesicular (vesicles ≈ 60 vol. %), sligthly porphyritic (≈ 11 vol. % crystals) and it is characterized by a microlite-free glassy groundmass. Mineral mode (on a vesicle-free basis) is: glass ≈ 89, cpx ≈ 8, ol ≈ 1-2, plg ≈ 2-1 vol. %. Due to the uncertanties in point counting, we have also calculated the phase proportions by the least-squares mass-balance techniques (Albaréde, 1995), yielding: glass ≈ 91, cpx ≈ 8, ol ≈ 1 ( sum of residual squares of oxides = 0.4). In the view of these results, plagioclase plays a very subordinate role or is xenocrystic (being present with a negative 4 % abundance. These PST-9 phase proportions are slightly different from those reported, at similar phenocryst content, to those by Metrich et al. (2001) for their yellow pumices (plg ≈ 5 - 6, cpx ≈ 4 - 5 , ol ≈ 1). It is noteworthy that mineral abundances in yellow pumice could be affected by the presence of disequilibrium crystals, originally belonging to the degassed crystal mush and captured by the ascending yellow pumice magma.
Clinopyroxene in PST-9 shows characteristic optical zoning, but its chemical zoning is slight:
Al2O3-rich rims (up to 4,8 wt. % and Wo48 En44 Fs8) and Al2O3 poor cores (up to 2.6 % and
Wo44 En44Fs12).
Olivine shows complex zoning patterns, frequently with Mg-rich rims (Fo85) and less
magnesian cores (Fo70-84). Patchy resorption and zoning are also frequent. Cr-spinel
inclusions were not encountered in PST-9, but are randomly present in other yellow pumice samples (Metrich et al., 2001). Olivine is typically crowded with abundant melt inclusions that often are arranged along irregular trails and occupy more than 30 % of the crystal surface. Post-entrapment crystallization of olivine and clinopyroxene variably affected the composition of olivine-hosted melt inclusion, thus producing large variations in the CaO/Al2O3 ratio of the melt (0.35 to 0.89). Rarely, some melt inclusion appear to have
completely crystallized in the form of Al-rich clinopyroxene, a K-rich phase (probably biotite-phlogopite) and sulphides (fig.2.6).
Plagioclase often exhibits sieve textures and crystal rims characterized by skeletal growth
(about 15 micrometers in size). The latter can be interpreted as due to an increase in undercooling of the crystallizing magma (H2O exsolution,). Plagioclase composition is also
highly variable: while the mean composition is An72, some Ca-rich cores (An85 ) are also
present.
Rare Ti-magnetite (Usp39) and apatite (fig.2.7) are hosted in clinopyroxene and were never
found in the groundmass.
fig.2.6: back-scattered electron image of a melt inclusion hosted in clinopyroxene. The melt
inclusion is totally re-crystallised in high-Al cpx and High-K phase, probably phlogopite (natural sample,PST9)
fig.2.7: back-scattered electron image micro photo of clinopyroxene from yellow pumice,
showing melt inclusion re-crystallised and containing sulphide. In cpx are evident two partially resorbed crystals of Ti-magnetite. Ti-mt was never found in the groundmass.
Glassy groundmass has a very homogeous composition: SiO2 = 51.0 wt. %, MgO = 6.4 wt.
% and CaO/Al2O3 = 0.66 (by weight).
Selected analysis of minerals and glassy groundmass are reported in tab. 2.2, 2.3, 2.4 and 2.5 at the end of this section.
SiO2 TiO2 Al2O3 FeO MnO MgO CaO Na2O K2O Cr2O3 tot Wo En Fs
pheno core 51.54 0.60 2.68 7.47 0.10 15.18 20.20 0.32 0.00 0.08 98.15 43 45 12 pheno core 51.60 0.68 2.76 9.36 0.26 14.91 19.36 0.24 0.10 0.00 99.28 41 44 15 pheno Rim 50.88 0.85 3.82 8.73 0.32 14.32 20.83 0.40 0.00 0.00 100.15 44 42 14 pheno core 50.61 0.68 2.59 7.49 0.21 14.99 20.95 0.31 0.00 0.02 97.85 44 44 12 pheno rim 50.94 0.70 2.63 9.48 0.41 14.52 19.74 0.33 0.00 0.09 98.84 42 43 15 pheno core 49.74 1.04 4.02 7.99 0.13 13.48 21.01 0.27 0.02 0.04 97.73 46 41 13 pheno core 51.09 0.83 2.99 8.15 0.25 14.10 20.96 0.22 0.02 0.13 98.75 45 42 13 micropheno incl 52.08 0.69 2.85 9.38 0.27 14.79 19.52 0.32 0.01 0.06 99.96 41 44 15 pheno rim 50.58 0.46 3.71 4.18 0.00 15.66 22.85 0.31 0.00 0.00 97.75 48 45 7 pheno rim 48.60 0.67 4.80 4.95 0.20 14.97 23.09 0.27 0.00 0.00 97.55 48 44 8
tab.2.2: representative analysis at electron microprobe (Cameca SX50) of clinopyroxene from
PST 9 (yellow pumice). Pheno: phenocrysts (>500 micron in size); micropheno: microphenocryst (50-500 micron in size ); incl: included in other phase. Wo: wollastonite; En: enstatite; Fs: ferrosilite.
SiO2 FeO MnO MgO CaO Cr2O3 NiO Tot. Fo Fa Tefr
Pheno rim 42.55 16.03 0.18 40.84 0.28 0.00 0.02 99.90 82 18 0 Pheno rim 39.72 13.45 0.27 43.58 0.32 0.05 0.04 97.42 85 15 0 pheno core 38.73 15.43 0.31 44.45 0.36 0.04 0.10 99.42 84 16 0 Pheno ultra-rim 40.30 11.70 0.23 48.40 0.25 0.01 0.18 101.06 88 12 0 Pheno ultra-rim 35.96 11.40 0.28 48.13 0.28 0.04 0.06 96.16 88 12 0 Pheno ultra-rim 39.10 11.92 0.29 47.61 0.20 0.01 0.04 99.17 88 12 0 Pheno intermiddle 39.66 14.98 0.26 45.64 0.37 0.07 0.00 100.98 84 15 0 Pheno Rim 38.05 25.50 0.33 37.18 0.31 0.05 0.00 101.42 72 28 0 Pheno Rim 39.14 21.89 0.28 38.90 0.38 0.00 0.18 100.75 76 24 0 pheno core 38.21 26.93 0.40 35.66 0.30 0.00 0.00 101.50 70 30 0 Pheno core 37.77 25.42 0.55 36.92 0.32 0.14 0.00 101.11 72 28 0 Pheno Rim 38.90 13.29 0.00 44.69 0.36 0.00 0.00 97.24 86 14 0
tab.2.3: representative microprobe analysis of olivine from PST 9(yellow pumice). Pheno:
phenocrysts (>500 micron in size). Fo: forsterite; Fa: Fayalite; Tefr:tefroite.
SiO2 Al2O3 Fe2O3 CaO Na2O3 K2O tot. An Ab Or
pheno 48.8 31.66 0.94 14.92 2.36 0.38 99.06 86 14 0
micropheno 50.65 29.91 0.43 12.84 3.18 0.91 97.91 78 22 0
tab.2.3: representative microprobe analysis of plagioclase from PST 9(yellow pumice).
An:anorthite; Ab: albite; Or: orthoclase. Pheno: phenocrysts (>500 micron in size); micropheno: microphenocryst (50-500 micron in size )
SiO2 TiO2 Al2O3 FeO MnO MgO CaO Na2O K2O Cr2O3 NiO Total CaO/Al2O3
gdm 49.91 0.71 17.01 6.91 0.06 6.55 11.26 2.51 1.99 0.07 0.00 96.98 0.66 gdm 49.82 0.90 17.17 7.06 0.01 6.39 11.14 2.52 2.02 0.11 0.00 97.12 0.65 gdm 48.72 0.85 17.14 6.92 0.10 6.45 11.65 2.64 2.15 0.00 0.00 96.61 0.68 gdm 49.77 0.84 17.29 7.34 0.10 6.47 11.11 2.50 2.13 0.05 0.00 97.59 0.64 gdm 49.50 0.83 16.97 7.31 0.11 6.20 11.17 2.51 2.14 0.06 0.00 96.77 0.66 gdm 50.10 0.88 17.23 7.09 0.17 6.34 11.35 2.70 2.06 0.00 0.00 97.93 0.66 gdm 50.24 0.86 17.28 7.28 0.17 6.42 11.70 2.66 1.94 0.04 0.13 98.71 0.68 gdm 49.15 0.83 16.97 6.72 0.13 6.30 11.49 2.57 2.04 0.00 0.00 96.21 0.68 gdm 49.13 0.80 17.37 7.26 0.08 6.46 11.44 2.59 2.13 0.00 0.06 97.32 0.66 gdm 49.83 0.85 17.31 7.15 0.03 6.55 11.53 2.58 2.15 0.00 0.02 97.99 0.67
tab. 2.4: representative microprobe analysis of glass from PST 9(yellow pumice).Groundmass
(gdm). Analyses were carried out with defocused beam in order to prevent Na-loss.
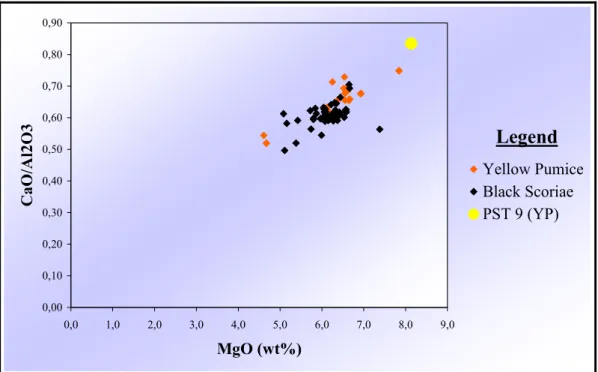
PST-9 whole-rock chemical data, when compared to other yellow pumice data (Metrich et al, 2001), suggest a slightly higher primitivity of PST-9 (at similar phenocryst contents)(fig.2.8), manifested by the higher CaO/Al2O3 ratio (0.79 vs. 0.64), higher MgO (7.8
vs. 6.3 %), higher Cr (259 vs. 75 ppm) and Ni concentrations (75 vs. 43 ppm). The silica content is slightly lower for PST-9 (50.5 vs. 51.2 wt. %).
0,00 0,10 0,20 0,30 0,40 0,50 0,60 0,70 0,80 0,90 0,0 1,0 2,0 3,0 4,0 5,0 6,0 7,0 8,0 9,0 MgO (wt%) CaO/A l2O3 Yellow Pumice Black Scoriae PST 9 (YP) Legend
fig. 2.8: variation of CaO/Al2O3 ratio versus MgO of whole rock samples of yellow pumices
and black scoriae . The CaO/Al2O3 ratio is used as a primitivity index . PST9 (yellow pumice)
shows the more primitive character among al the literature samples. Data are from Francalanci et al. (1999), Rosi et al. (2000), Metrich et al. (2001), Bertagnini et al. (2003), Francalanci et al. (2004) and Landi et al. (2004).
The presence of a weak negative Eu anomaly (fig.2.9) (in PST9: Eu/Eu*= 0.84) also present in literature studies; (Bertagnini et al., 2003, mean: Eu/Eu* = 0.87) implies that the PST-9 magma experienced some plagioclase fractionation. REE display rather high absolute abundances for such a mafic rock (PST9: LaN = 197) and fractionated LREE/HREE patterns
(LaN/YbN = 15.3).
fig.2.9: chondrite-normalised REE patterns (Mc Donough & Sun, 1995) for PST 9 whole rock
(yellow line). For comparison are reported REE patterns for pumice-scoria pairs from 23 august 1998 paroxysm (from Metrich et al., 2001)
Chondrite normalis
ed
black scoria (literature datum) yellow pumice (literature datum) PST 9 yellow pumice
L
LEEGGEENNDD
3.1 Experimental strategy
3.1.1 Glass preparation and containers
Experiments were all performed on the yellow pumice (PST 9), the less phyric product of Stromboli in the laboratory of ISTO-CNRS, Orléans, France.
The starting composition can be used for experiments either as a fine-grained as rock powder or as a glass. The use of finely ground rock powders requires much longer experiment times and does not eliminate the presence of “resistate” crystals. Conversely glass is the ideal material for most phase equilibrium studies because of its high reactivity and because of mineral nucleation is quite simple for mafic compositions. For these reasons we preferred to use a glass as starting material. Single batches of 10 g of PST 9 were firstly ground (≈ 30-100 µm size) in agate mortar under acetone and then molten in a Piézocéram at 1400°C at 1 atm in a Pt crucible. Two melting cycles (3 hours the each) were done with crushing in between. The resulting glass was embedded in epoxy resin and analyzed by Electron MicroProbe to check its absolute homogeneity (15-20 analysis were sufficient).
3.1.2 Experimental containers
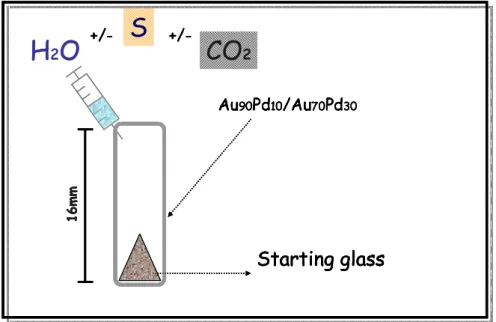
One half of the glass was hand crushed (≈ 20-50- µm size) and 30 mg of resulting powder were loaded in capsules (16mm length, 2.5 mm Øinternal, 0.2 mm wall thickness) Au90Pd10 for
experiment at lower temperature (Tfusion of this alloy at 1 bar ≈ 1230°C- Okamoto & Massalski
(1987)) - Au70Pd30 for higher temperature experiments (Tfusion at 1 bar ≈ 1400°C). One
experiment was performed in a AgPd capsule, in order to compare Fe-loss in the different capsule materials. According to Kawamoto & Hirose (1994) the degree of iron-loss to Au-Pd alloy is sensitive to the oxygen fugacity.
3.1.3 Experimental charge preparation
Variable amounts of distilled water was loaded with a microsyringe at the bottom of the capsule before the sample. Others volatiles were loaded Ag2C2O4 for CO2 and metallic S for
S-added experiments. The initial fluid composition, for the mixed fluid experiments, varied as
constant were used (1 wt %) (fig 3.1).
fig. 3.1: simple sketch of experimental charge
Capsules were arc welded, keeping them in a liquid nitrogen bath, in order to prevent water loss. After welding the capsules were weighted, left in an oven overnight and then weighted again to check for leaks.
3.1.4 Experimental equipment
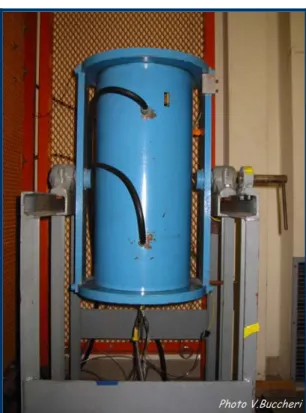
All experiments were of “subliquidus or crystallisation type” and were carried out in an Internally Heated Pressure Vessel (IHPV), “Gros Bleu”, working vertically (to minimise the thermal convection) and pressurized with Ar-H2 mixture (fig 3.2).
The use of Ar-H2 mixtures with known partial pressure of hydrogen allows to impose variably
reducing atmosphere of variable XH2 enables fH2 and hence fO2 to be controlled. Oxygen
fugacity has a strong effect on the stability of mineralogical phases. In hydrous systems the reaction H2OÙH2+½ O2 controls the redox state of the system self. The equilibrium constant
(Kw) of this reaction, at given temperature and pressure, permits to fix fO2, depending on the
H2 loaded with Ar.
H
2O
+/-S
+/-CO
2 Au90Pd10/Au70Pd30 Starting glass 16mmH
2O
+/-S
+/-CO
2H
2O
+/-S
+/-CO
2 Au90Pd10/Au70Pd30 Starting glass 16mm Au90Pd10/Au70Pd30 Starting glass 16mm Au90Pd10/Au70Pd30 Starting glass 16mman inner furnace, consisting of a double parallel winding of a Mo or kanthal wire, not concentric.
Pressure is recorded by a transducer calibrated against a Heise-Bourdon tube gauge (precision 15-20 bar). Three chromel-alumel thermocouples (higher limit: 1300°C) allowed a continuous control of the temperature in the top, middle and bottom part of the hot spot (i.e. for a length of 4 cm).
fig. 3.2: front vision of Internally Heated Pressure Vessel working vertically (Gros Bleu),
equipped with a fast quench device. The two black rubber pipes ensure water circulation for the cooling of the furnace. Thermocouples exit wires are visible in the lower part of the vessel. CNRS-ISTO, Orléans- France.
The experimental protocol consists of seven basic steps: loading of the capsules (several capsules can be loaded at the same time), tight closure of the vessel, evacuation of the air, pressurization with H2 (according to the required fO2; e.g. for a 4 kbar total pressure, 1 bar of
H ensures fO ~ NNO+1), pressurization with Ar, heating up to experimental temperature of Photo V.Buccheri
Lefevre (1992) was systematically used. It consists in a alumina tube (Ø 10 mm), in which the samples are placed, hung in the hot spot by two thin (Ø 0.2 mm) Pt wires. At the end of the experiments, Pt wires are melted by with an electric current and the sample drops in the cold part of the vessel. Quench rate is around 100°C/s. This device insures a nearly isobaric quench.
3.1.5 Control and monitoring of oxygen fugacity
The pressurizing medium is a mixture of H2 and Ar. The noble metal of the capsules behaves
as an ideal semipermeable membrane to H2 (Chou, 1986). H2 diffuses fastly across the
membrane to attain equilibrium between chemical potential of hydrogen in the capsule and in the pressurizing medium (Ar-H2 medium).
Inside each capsule, H2O is present and the following equilibrium is established:
H2+1/2 O2 Ù H2O
This reaction links the fH2 with fO2 and fH2O as follows
Kw = fH2O/(fH2*½fO2) (eq 3.1)
log Kw = log fH2O – log fH2 - ½ log fO2 (eq 3.2)
log fH2 = log fH2O - log Kw - ½ log fO2 (eq 3.3)
To measure the fH2 during each experiment, the H-sensor technique (Taylor et al. 1992) was
used.
The sensor is based on previously calibrated nickel-nickel oxide buffer equilibrium Ni+½ O2Ù NiO
log K (P,T) = log (aNiO)-[log (aNi)+ ½ log fO2] (eq 3.4)
and O’Neill, 1994).
For pure phases a = 1, hence:
log K (P,T) = -½ log fO2 (eq 3.5)
If Ni metal is diluted by the presence of another divalent metal in solution in the alloy, the activity of Ni is lowered and the 3.5 becomes:
log K (P,T) = -[log (aNi)+ ½ log fO2] (eq 3.6)
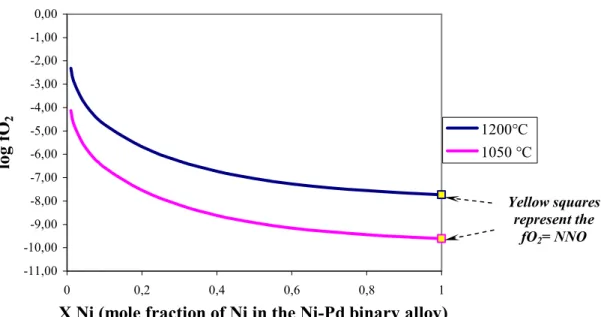
The effect of adding an additional metal component is to shift the end member buffer reaction toward higher fO2 at any given T and P (fig.3.3).
-11,00 -10,00 -9,00 -8,00 -7,00 -6,00 -5,00 -4,00 -3,00 -2,00 -1,00 0,00 0 0,2 0,4 0,6 0,8 1
X Ni (mole fraction of Ni in the Ni-Pd binary alloy)
log fO
2
1200°C 1050 °C
fig. 3.3: variation of fO2 with X Ni(= Ni/(Ni+Pd)) at 1050 and 1200°C for the NiPd-NiO
sensor. Lines are drawn from eq. 3.7
During each experiment a sensor capsule was inserted. This sensor contains two pellets of two different mixtures of NiPd-NiO, separated by ZrO that acts as an insulating medium (to
Yellow squares represent the
fO2= NNO
3.4). For our experimental conditions, we choose these compositions of solid mixtures: Ni0.15Pd0.85-NiO and Ni0.5Pd0.5-NiO. The calibration expression for H-sensor is:
log fO2(Ni,Pd)= -2log XNi-1/(2.3025RT)[(480104-244.700T+21.1078logT)+{2(1-XNi)2
[-8.93T+7647(4XNi-1)]}] (eq 3.7)
fig.3.4: the assemblage of the capsule containing the solid sensor used to monitor fH2.
After the run, the metal of the sensor was analysed. If proved to be homogeneous, then alloy composition was a record a fO2, calculated from eq.3.7. Given the fO2, can be calculated fH2
according to eq.3.3.
In the eq.3.3, log Kw is given from Robie, Hemingway, Fisher (1979). The fugacity of pure
H2O at the P and T of the experiment (fH2O°) is calculated by considering the fluid as non
ideal gas. The most used equation of state is that of Redlich-Kwong (1949)modified by Holloway et al.(1977) and later by Flowers (1979), hereafter MRK
) ( * V2 Vb T a b V RT P + − − = (eq.3.8)
where a refers to attractive forces among the molecules and is considered to be independent of the pressure, but temperature-dependent. The relation with temperature is
ZrO
2Ni
0.15Pd
0.85- NiO
Ni
0.5Pd
0.5- NiO
H
2
O
f
H
2solid-sensor
ZrO
2Ni
0.15Pd
0.85- NiO
Ni
0.5Pd
0.5- NiO
H
2
O
f
H
2solid-sensor
aH2O (T)=[166.8-0.19308(°C)+0.1864*10-3T-2(°C)-0.71288*10-7T3(°C)]*103 (eq.3.9)
b refers to the volume occupied by molecules. a°=35.0*106 and is in units of atm*cm6°K1/2/mole2 b=14.6. and is in units of cm3/mole.
The MRK equation allows to assess the thermodynamic variables needed to describe the properties of the system.
From this we can obtain the fugacity coefficient (γi) considering
RT PV b V b V b V b RT ab V b V b RT a X b V b b V V i i ik k m i k 2 ln ln ln ln ln 13/2 3/2 2 − + − + + + Σ − − + − = = γ (eq.3.10)
and finally the fugacity (ln fi=lnγi*XiP).
Obviously the fH2 of the sensor equals the fH2 of the sample and this allows us to calculate
fO2 for each capsule according to:
log fO2 = 2[log fH2O-log fH2 - log Kw] (eq.3.11)
where log Kw is from Robie, Hemingway, Fisher (1979), log fH2 is calculated from above and
log fH2O is calculated from a model thermodynamic (Burnham, 1975 and Burnham, 1994),
that yields aH2O (and consequently fH2O which is equal to aH2O * fH2O°) if are known P,T
and the H2O concentration for the melt. 3.2 Analytical techniques and methodology
3.2.1 Scanning Electron Microscope and Electron Microprobe
A combination of reflected light microscopy, Scanning Electron Microscope (SEM-EDS) and Electron MicroProbe (EPMA) was used for phase identification.
Natural sample and fragments of experimental charges were imbedded in epoxy resin (Epoxy), polished and preliminarily studied by combining scanning electron microscopy and EDS analysis (SEM-EDS) at Dipartimento di Chimica e Fisica della Terra of Palermo and at
with 20 keV electron energy and 600pA beam current were employed for the analysis.
The quantitative major elements analyses of silicate phases were performed with either a Cameca Camebax or a Cameca SX50, hosted at BRGM-CNRS (Bureau des Recherches Geologiques et Minieres - Centre National de la Recherche Scientifique) in Orléans. Natural minerals were used as standards. Analytical conditions were: acceleration voltage 15 kV, current 6 nA, counting time 10 s for peak for all the elements. For mineral phases a beam 1-2 µm in size was used. For glasses was defocused (8 µm) (these conditions tend to minimize the migration of alkalies in glasses). No Na-loss was detected for this composition.
Glasses show a systematic deficiency in the total sum of oxides to 100%. This difference is due to the presence of water and of other volatiles. Three standard crystal-free glasses, of known water content determined by Karl Ficher Titration (KFT) and Infrared Spectroscopy (FTIR) analysis (see figg. 3.6a and 3.6b), were analysed in each analytical section together with other crystal-bearing, crystal-free glasses.
This routine allows to estimate the water content in the other glasses using the"by-difference" method (Devine et al.1995)(see appendix for calibration, fig.A.1).
Sulfur content in the glasses was directly obtained by microprobe analysis. Analytical conditions were: acceleration voltage 15 kV, beam current 50 nA, beam size 1 µm, counting time 60s for peak and 60 sec for background.
The procedure for sulfur determination (Clemente,1998) is performed to optimize the detection limit of microprobe. Each spectometer is placed in the position of Kα for S-2 (as
determined on synthetic pyrrohtite) and after 60 s counting we shift the position to measure the background. The measure takes into consideration Kα for S+6 because λ for that is in the
error limit of Kα for S-2. To determine the S concentration in the glass we analysed three
standard S-bearing glasses of known S content well known (Clemente, 1998) with 750,1400 and 1900 ppm of S. The S amount of our glasses were determined by either inter- or extrapolating the S count versus S content linear dependence constituted from the three standard glasses (see appendix fig.A.2)
voltage 15 kV, beam current 20 nA, beam size 1 µm, counting time 10 s for peak and 10 s for background. The elements analysed were Ni, Pd, Fe and metals from the capsules (i.e. Au and Ag). Standards were pure metal, except for Fe (FeS2).
3.2.2 Karl Fischer Titration generalities
The Karl Fischer titration method is a very rapid and useful method to determine microamounts of water in small amount (less than 10mg) of crystal–free glasses (Behrens et al.1996).
The apparatus consists of two parts: the furnace area, where the water is carried out from the sample and the titration cell where water is determined (Turek et al., 1976).
The method is based on the reaction between H2O + I2 Ù 2HI+½O2. The water is released
upon heating the sample by electrochemical method (fig.3.5).
fig.3.5: typical Karl Ficher Titration result of first step of heating. Wt1: weight of sample;
wt2:tare; net: net weight; result: bulk of titrated water; %: water amount in wt%; BG: noise; Anode and Cathode: used reagents; Meas.Time: analysis time.
during pyrolisis) (Westrich,1987) were weighted, put in Pt crucibles and preheated at 100°C to obtain stable background. Afterwards, temperature was increased in 40°C/min till 1250/1300°C, then was instantaneously quenched and immediately re-heated at 1200°C, to facilitate disappearance of eventual bubbles trapped in the glass. The sum of two stages of heating and extractions give the total amount of dissolved water. Total analysis time for was typically less than 40 min.
Reproducibility was checked from repeated analysis (at least three times for each sample). Three near liquidus glasses were selected for analysis and used as standard glasses for crystal the estimation of H2O “by difference” method in the other glasses. The data are given in
tab.3.1
Charge Pressure (kb) Temperature (°C) Phase assemblage H2O wt % (KFT)
# 4-1 4 1175 glass 4.62
# 4-2 4 1175 glass 3.20
# 3-1 4 1150 glass 5.14
tab.3.1: Karl Fisher Titration results of three crystal-free glasses. Glasses # 4-1, # 4-2 and
# 3-1 were used as standard glasses for the estimation of H2O with “by difference” method.
3.2.3 Infrared Spectroscopy
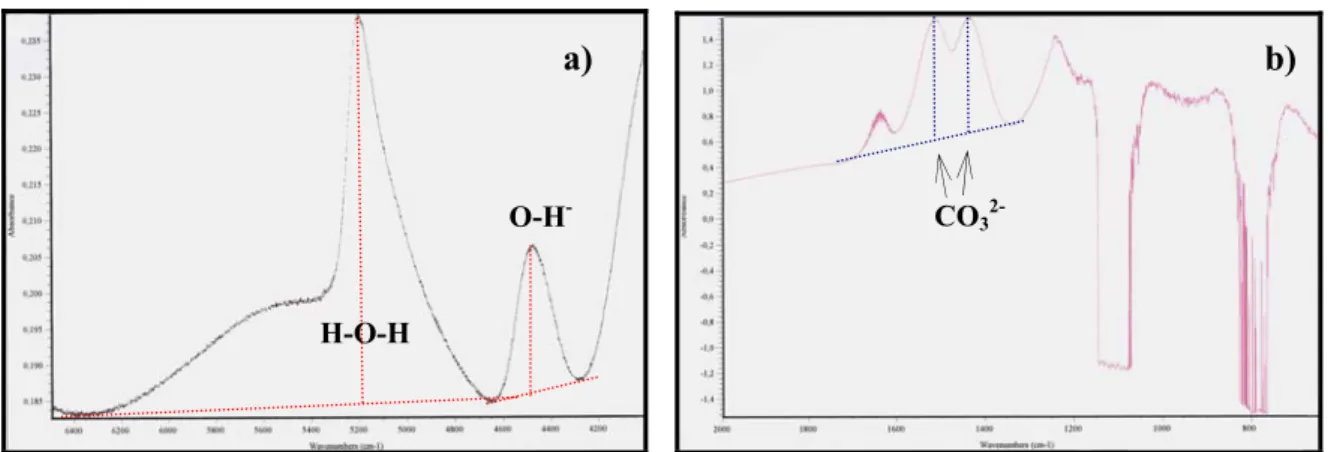
Water and CO2 dissolved in experimental glasses were measured by infrared spectrometry. In
fig.3.6 are reported infrared spectra from H2O- and CO2- bearing glasses.
fig. 3.6: a) the near-IR transmission spectrum (displayed in absorbance units) of hydrous
experimental glass (sample #3-15), and b) infrared transmission spectrum of doubly polished chips of experimental glass containing carbon species (sample #17-2).
a) b)
H-O-H
O-H- CO
3
The infrared radiations are able to induce and enhance vibrations and rotations in molecules and in atomic groups in glasses, at characteristic frequencies. Systematic quantitative infrared studies of Stolper (1982a,b) and Silver & Stolper (1989) focused on water determination in natural glasses demonstrated the presence of vibration band at 5200 cm-1 (i.e. wave number) for molecular water (H-O-H), 4500 cm-1 for hydroxyl group (X-O-H) and 7100 cm-1 for total water. In our study we took in account the 5200 cm-1 and 4500 cm-1 lines.
The spectra were taken on double polished chips of the glasses preliminarily analysed with KFT, using a Nicolet 760 Magna FTIR instrument with attached optical microscope and equipped with a liquid N2 cooled MCT/A detector (mercury cadmium telluride detector).
Resolution was set to 2 cm-1. A W source and a CF2 were employed in the near-IR region
(4000-8000 cm-1). Spectra were accumulated always in the range 2000-8000 cm-1 and 512 scans for peak and 512 for background were necessary to obtain good spectra (see table 3.3 for details about IR calculation).
Sample ρ (g/cm3) * d (µm) ** Abs. 5200 (cm-1) ε 5200 Abs. 4500 (cm-1) ε 4500 H2O tot (wt%)
#3-15 2.69 119 0.0468 0.81 0.0225 0.64 5.13
#3-18 2.69 78 0.0151 0.81 0.0086 0.64 4.30
#4-1 2.69 110 0.0764 0.81 0.0269 0.64 10.11
#4-2 2.69 165 0.0382 0.81 0.0192 0.64 4.90
* = density; ** = sample thickness.
tab.3.3: Water concentration in crystal-free glasses analysed by FTIR.
The small size of the samples limited the analyzed areas (≈ 100µm spot) to 3-5 for each sample and the results were averaged.
The water content measured by FTIR was calculated by Beer-Lambert law (Stolper,1982):
CH2O= + OH O H O H E E d M ε ε ρ 4500 2 5200 2 * * (eq.3.12)
where M H2O: 18.02g (molecular weight of water); d: thickness of the sample (µm); r: density
(g/cm); E5200 and E4500: absorbance; εH2O and εOH molar absorptivity coefficients (l/mol/cm).
standard density of 2.69±0.02 g/cm3 (from Metrich et al.2001). Moreover we assume εH2O:0.81and εOH: 0.64 (from Metrich et al.2001). Because of difficulties in measurements
sample thickness and of uncertainties on absorption coefficients and glass density, the accuracy of our FTIR analysis is estimated to be ± 20% for total H2O. We consider more
accurate the KFT estimated of water content.
The carbon species CO2 molecule and CO3-2 carbonate group (Blank & Brooker, 1994)
dissolved in the melts are strongly dependent on the melt structure (Fine & Stolper, 1986). We measured three samples (experiments with two volatiles: H2O+CO2): #17-1, #17-3 and
#17-3. In our samples we found peak for CO3-2 group (1525 cm-1 and 1430 cm-1 absorption
bands).
A Globar source and a KBr beam splitter were used in the IR region (1000-4000 cm-1). Spectra were collected for 512 scans in the 650-8000 cm-1 range. We were able to measure 4-5 areas (100µm diameter)for each sample. For background determination and to minimize the influence of 1600 band of water, we subtracted from the spectrum in our samples a spectrum obtained in a H2O-bearing CO2-free glass. The carbon amount was determinate from the
eq.3.13:
(
/)
*44 /( *( /10 )) % 6 1525 1525 2 H d CO = ε ρ (eq.3.13)ε1525 is calculated from the eq.3.14 (Dixon & Pan, 1986):
)) /( ( * 342 451 1525= − Na Na+Ca ε (eq.3.14)
modified for our composition (fig.3.7).
Details for CO2 calculation are reported in tab. 3.4
200 250 300 350 400 450 0 0,2 0,4 0,6 0,8 1 Na/(Na+Ca) (molar) ε 15 25 Diopside Tholeiite Leucitite Basanite Albite
experimental glasses of this study
fig.3.7: plot of ε1525 (absorbance coefficient) vs molar Na/(Na+Ca) for our experimental
glasses. We used for our experimental glass compositions, a value extrapolated from the principal correlation array. For comparison are reported data for tholeiite, leucitite and basanite (from Fine & Stolper, 1986).
Sample ρ (g/cm3) * d (µm) ** Abs. 1515 (cm-1) ε 1515 CO2 tot (ppm)
#17-1 2.69 113 0.646 401 2332
#17-2 2.69 156 0.944 401 2468
#17-3 2.69 97 0.953 399 4028
* = density; ** = sample thickness.
tab.3.4: CO2 concentration in glasses analysed by FTIR
In this chapter, we address the following results: (i) simulation of the crystallization conditions of yellow pumice magma in a defined T-P- fO2-H2O-CO2 space in phase equilibria
at great depth, (ii) definition of the kind of source that last equilibrate with YP before its ascent, (iii) determination of the effect of variable (H2O)melt on phase equilibria during the
ascent of yellow pumice, (iv) to infer how volatiles exsolution can play a role in the rapid ascent of yellow pumice and on triggering the major explosions, (v) evaluation of the effect of pressure influence on the crystallization process and consequently we will interpretate the relationships between black scoria and yellow pumice.
Our experimental results are presented in two phase-diagram sections:
an isobaric section at 4 kb at T = 1050-1175 oC in order to reconstruct the crystallization process at high depth of the Stromboli system
an isothermal section at 1100°C and pressures of 0.5-4.0 kb to simulate the ascent path of yellow pumice magma.
4.1 Attainment of equilibrium, quench crystallization and iron-loss
As already said in a previous section, we used glass as a starting material rather than crushed rock powder because the latter is more difficult to equilibrate.
Attainment of equilibrium. Attainment of equilibrium has not been stated by reversal
experiments, but several textural and chemical criteria have been used to assess vicinity to equilibrium.
In the presence of water we have considered 17 hours of run duration (on average) as sufficient to closely approach the equilibrium conditions.
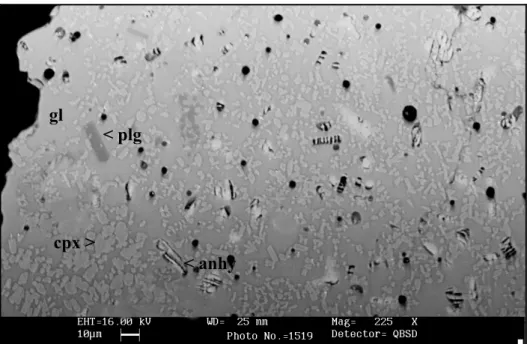
Euhedral, faceted and tabular crystals of plagioclase are recognized in low-T, P or low H2O
charges and this indicates growth at small degrees of undercooling (Lofgren, 1974, Muncill & Lasaga, 1987) , but also the femic phases (pyroxenes and olivines) as also euhedral in their habit.
deviation of microprobe analyses (tabb. 4.7 and 4.8) is in the same range as the analytical error. The only exception is clinopyroxene in which the standard deviation is higher for SiO2
and Al2O3 and sometimes for FeOtot and MgO and olivine in charge #15-2, where st.dev. is >
1 wt. % for SiO2 and MgO.
The distribution coefficients (KdFe-Mg=(Fe/Mg)xtal / (Fe/Mg) liq for clinopyroxene and olivine; KdCa-Na= (Ca/Na)xtal / (Ca/Na) liq for plagioclase) are known to represent equilibrium if in the
range 0.27-0.33 for olivine, 0.23-.0.27 for clinopyroxene while plagioclase is strongly dependent on H2O content: 1.7 for melt with H2O = 2 wt%, 5.5 for melt with H2O = 6 wt%.
Kd of our experimental phases are in agreement with results from literature in similar P-T conditions (Sisson & Grove, 1993/a ). Based on these petrographical and chemical criteria, we consider our experimental results as closely representing the equilibrium conditions. To summarize, we retain our experimental data close to equilibrium condition considering morphological and chemical criteria.
Quench crystallization. Our experimental basaltic liquid, that is a low silica medium MgO
medium is intrinsically a difficult composition to quench in presence of water in ordinary experimental apparati. However, the use of the fast quench device allows to nearly completely avoid nucleation and growth of crystals quench; they are undesired phases occurring because of low viscosity of the glass, during the final phase of the experiment. Nevertheless, in few runs (see table 4.3 and 4.6) thin needles of quench phlogopite (fig. 4.1a, b) were recognized. Equilibrium phlogopite crystals were never produced during experiments. We have evaluated the influence of the quench-phase crystallization by mass balance calculations and only in four experiments the sum of square residuals (ΣR2) is high enough to deduce the presence of
mica crystallization.