Beyond Differential Expression: Methods and
Tools for Mining the Transcriptomic Landscape of
Human Tissue and Disease
by
Patrick Raphael Schmid
Submitted to the Department of Electrical Engineering and Computer
Science
in partial fulfillment of the requirements for the degree of
Doctor of Philosophy
at the
MASSACHUSETTS INSTITUTE OF TECHNOLOGY
February 2012
c
Massachusetts Institute of Technology 2012. All rights reserved.
Author . . . .
Department of Electrical Engineering and Computer Science
February 3, 2012
Certified by . . . .
Dr. Bonnie Berger
Professor of Applied Mathematics and Computer Science
Thesis Supervisor
Accepted by . . . .
Professor Leslie A. Kolodziejski
Chair of the Committee on Graduate Students
Beyond Differential Expression: Methods and Tools for
Mining the Transcriptomic Landscape of Human Tissue and
Disease
by
Patrick Raphael Schmid
Submitted to the Department of Electrical Engineering and Computer Science on February 3, 2012, in partial fulfillment of the
requirements for the degree of Doctor of Philosophy
Abstract
Although there are a variety of high-throughput technologies used to perform bio-logical experiments, DNA microarrays have become a standard tool in the modern biologist’s arsenal. Microarray experiments provide measurements of thousands of genes simultaneously, and offer a snapshot view of transcriptomic activity. With the rapid growth of public availability of transcriptomic data, there is increasing recog-nition that large sets of such data can be mined to better understand disease states and mechanisms. Unfortunately, several challenges arise when attempting to perform such large-scale analyses. For instance, public repositories to which the data is being submitted to were designed around the simple task of storage rather than that of data mining. As such, the seemingly simple task of obtaining all data relating to a particular disease becomes an arduous task. Furthermore, prior gene expression anal-yses, both large and small, have been dichotomous in nature, in which phenotypes are compared using clearly defined controls. Such approaches may require arbitrary decisions about what are considered “normal” phenotypes, and what each phenotype should be compared to.
Addressing these issues, we introduce methods for creating a large curated gene expression database geared towards data mining, and explore methods for efficiently expanding this database using active learning. Leveraging our curated expression database, we adopt a holistic approach in which we characterize phenotypes in the context of a myriad of tissues and diseases. We introduce scalable methods that associate expression patterns to phenotypes in order to assign phenotype labels to new expression samples and to select phenotypically meaningful gene signatures. By using a nonparametric statistical approach, we identify signatures that are more precise than those from existing approaches and accurately reveal biological processes that are hidden in case vs. control studies. We conclude the work by exploring the applicability of the heterogeneous expression database in analyzing clinical drugs for the purpose of drug repurposing.
Thesis Supervisor: Dr. Bonnie Berger
Acknowledgments
I would like to thank Dr. Bonnie Berger and Dr. Isaac Kohane for many years of guidance and support. In addition, I would like to thank my close collaborator and friend, Dr. Nathan Palmer, for his time and effort in tackling shared research problems over countless cups of coffee. I would also like to thank my family and friends who have always provided me with a great deal of support. Last, but definitely not least, I would like to thank my loving wife, Candice, for her continued love, patience, and support. Without all of these people, none of this work would have been possible.
Contents
1 Introduction 19
1.1 Biology and terminology . . . 21
1.1.1 Basic biology . . . 21
1.1.2 Transciptional biology . . . 23
1.1.3 Gene expression experiments . . . 24
2 Concordia: The system and its application to GEO 29 2.1 The Concordia framework . . . 31
2.1.1 Why use an ontology? What ontology should we use? . . . 33
2.1.2 Software infrastructure . . . 37
2.2 Concordification of GEO . . . 40
2.2.1 GEO in a nutshell . . . 40
2.2.2 Normalizing the gene expression samples . . . 41
2.2.3 Concordification of GEO . . . 42
2.2.4 UMLS noise filtering . . . 43
2.2.5 Ontology based browsing of GEO . . . 44
3 Beyond differential expression: Localizing expression samples in a heterogeneous transcriptomic landscape 47 3.1 Sample correlation as a distance metric . . . 49
3.2 Making sense of the transcriptomic landscape . . . 51
3.2.1 The transcriptomic landscape . . . 51
3.3 Phenotypic concept enrichment . . . 55
3.3.1 Enrichment score calculation . . . 56
3.3.2 Quantifying performance . . . 58
3.3.3 Performance results . . . 60
3.3.4 Quantification of the “batch” effect . . . 61
3.3.5 Scalability . . . 65
3.3.6 Specificity of the conventional classification of tissue and disease 67 3.3.7 Concept enrichment web interface . . . 68
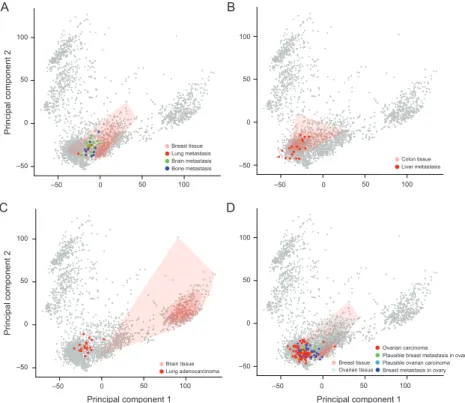
3.4 Tissue specific signal of tumor metastases . . . 70
3.5 Conclusion . . . 72
4 Beyond differential expression: Marker genes in a non-dichotomous world 75 4.1 Marker gene finding: Finite impulse response filter . . . 76
4.1.1 Specificity of marker genes . . . 79
4.2 Phenotype marker gene sets . . . 80
4.2.1 Generating phenotype specific gene sets . . . 81
4.2.2 Breast cancer gene set . . . 84
4.3 Tissue specific signal of tumor metastases revisited . . . 88
4.4 Stem cell marker genes . . . 89
4.4.1 Creating the stem cell marker gene set . . . 91
4.4.2 Stem-like signature stratifies a diverse expression database by pluripotentiality and malignancy . . . 93
4.4.3 Functional diversity of the stem cell gene set . . . 96
4.4.4 Grading of tumors . . . 97
4.4.5 Biological implications . . . 98
5 Data begets data: Efficiently expanding an existing curated expres-sion database 101 5.1 Seeing is believing: Active learning . . . 102
5.3 Expanding the database using only text . . . 110
5.3.1 Brief introduction to na¨ıve Bayes classifiers . . . 111
5.3.2 Learning from text . . . 112
5.3.3 Scoring strategies . . . 113
5.3.4 Quantifying performance . . . 115
5.3.5 Performance . . . 115
5.4 Expanding the database using text & expression data . . . 120
5.4.1 Scoring strategies . . . 121
5.4.2 Quantifying performance . . . 123
5.4.3 Performance . . . 124
6 Drug similarity: A transcriptomic view 127 6.1 Types of drug data . . . 128
6.1.1 Connectivity Map . . . 128
6.1.2 DrugBank . . . 134
6.2 Drug similarity networks . . . 137
6.2.1 Similarity measures . . . 138
6.2.2 Comparing the similarity networks . . . 140
6.2.3 Consensus similarity network . . . 141
6.2.4 Potential applications . . . 144
6.3 Leveraging Concordia stem cell marker genes . . . 145
6.3.1 Stem cell genes as a CMAP query . . . 145
6.3.2 Stem cell marker genes as a lens into cell-cycle and cancer drug space . . . 147
6.4 Drug target genes and Concordia expression . . . 149
6.4.1 Concordia marker gene scores to examine drug target genes . . 150
6.4.2 Drug target gene expression correlation . . . 152
7 Concluding remarks 163 7.1 Future work . . . 164
7.1.2 Expanding the expression database . . . 165
7.1.3 Concept enrichment using marker genes . . . 165
7.1.4 Targeted drug therapeutics . . . 166
A Data in Concordia 167 A.1 GEO data in Concordia . . . 167
A.1.1 GEO series . . . 167
A.1.2 GEO samples . . . 168
A.2 UMLS concepts in Concordia . . . 178
A.2.1 Direct concept hits for the text associated with the 3030 GEO samples . . . 178
B Transcriptomic landscape: Differentially expressed genes in brain, blood, and soft tissue 183 B.1 Over-expressed genes in soft tissue . . . 183
B.2 Over-expressed genes in blood . . . 186
B.3 Over-expressed genes in brain . . . 189
C Concordia performance 191 C.1 Cross-validation performance of Concordia . . . 191
C.2 Concept enrichment of metastasis samples . . . 217
D Marker genes their and over-enriched GO concepts 301 D.1 Over-enriched GO concepts for breast tissue marker genes . . . 301
D.2 Over-enriched GO concepts for breast cancer marker genes . . . 309
D.3 Stem cell marker genes . . . 313
D.3.1 Genes in the DNA replication / cell cycle module . . . 313
D.3.2 Stem cell genes in the RNA transcription / protein synthesis module . . . 315
D.3.3 Genes in the metabolism / hormone signaling / protein synthe-sis module . . . 317
D.3.4 Genes in the multicellular signaling / immune signaling / cell
identity module . . . 318
D.3.5 GO terms associated with the DNA replication / cell cycle module319 D.3.6 GO terms associated with the RNA transcription / protein
syn-thesis module . . . 325
D.3.7 GO terms associated with the metabolism / hormone signaling
module . . . 328
D.3.8 GO terms associated with the signaling / cellular identity module331
E Transcriptomic analysis of drugs 337
E.1 CMAP sample breakdown . . . 337
List of Figures
1-1 DNA Double Helix . . . 22
1-2 The basics of microarray technology . . . 25
1-3 The relationship of a dataset, an experiment, and a platform . . . 27
2-1 Growth of GEO . . . 30
2-2 Mapping source documents and free-text queries to perform searches 32 2-3 Mapping gene expression samples onto the UMLS ontology . . . 34
2-4 The Concordia framework . . . 38
2-5 Scalability of the Concordia system architecture . . . 39
2-6 The relationship of GEO data files . . . 41
2-7 Building the Concordia database using GEO expression data . . . 42
2-8 Screen shot of the application that was used to perform manual cura-tion of UMLS concepts . . . 44
2-9 Screen shot depicting a web application built in front of the Concor-diafied gene expression data from GEO . . . 45
3-1 Comprehensive vs. dichotomous expression analysis . . . 48
3-2 Correlation clustering of various phenotypes . . . 50
3-3 Human gene expression landscape . . . 52
3-4 Tissue similarity network . . . 54
3-5 Performing concept enrichment . . . 56
3-6 Example enrichment score plots . . . 58
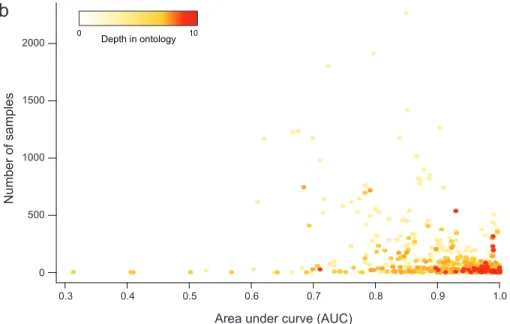
3-7 Depth in UMLS ontology vs. AUC . . . 62
3-9 Scalability of the Concordification of GEO . . . 66
3-10 Specificity of the conventional classification of tissue and disease . . . 68
3-11 Concept enrichment web interface . . . 69
3-12 Metastasized samples mapped into trascriptomic landscape . . . 71
4-1 Example good and bad marker genes for brain tissue . . . 78
4-2 Histogram of the number of genes that are below a 0.001 p-value cutoff across 1489 UML concepts . . . 80
4-3 Breast tissue hit and miss AUC plots . . . 84
4-4 Breast tissue hit and miss AUC heatmap . . . 85
4-5 Metastasized breast cancer samples mapped into trascriptomic landscape 89 4-6 Stem cell marker gene set ANOVA analysis . . . 92
4-7 Stem cell marker genes stratify expression database by pluripotentiality and malignancy . . . 94
4-8 Expression modules of stem cell marker genes . . . 96
4-9 Tumor grading with stem cell marker gene set . . . 98
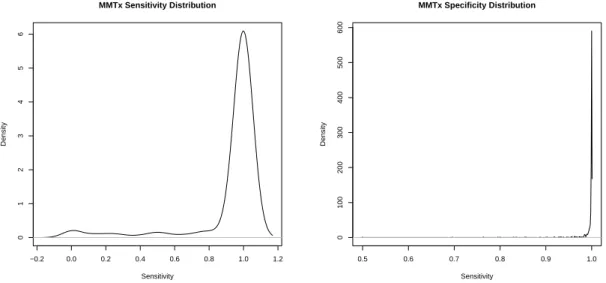
5-1 Sensitivity and specificity of MMTx annotation . . . 106
5-2 Precision and recall of MMTx annotation . . . 107
5-3 MMTx sensitivity vs. specificity . . . 107
5-4 Na¨ıve Bayes classifier performance for blood . . . 117
5-5 Database labeling performance for blood when using only information from text . . . 118
5-6 Database labeling performance for blood when viewed on the tran-scriptomic landscape . . . 119
5-7 Active learning cross validation method . . . 123
5-8 Database labeling performance for blood samples when using text and gene expression information . . . 124
5-9 Database labeling performance for liver samples when using text and gene expression information . . . 125
5-10 Database labeling performance for lung samples when using text and
gene expression information . . . 125
6-1 CMAP in the transcriptomic landscape . . . 131
6-2 Principal component analysis of CMAP MCF7 cell line samples per-formed on high throughput HG-U133A array . . . 132
6-3 PCA analysis of CMAP MCF7 difference profiles . . . 133
6-4 PCA analysis of CMAP PC3 difference profiles . . . 133
6-5 Drug target gene relationship network . . . 135
6-6 The overlap of drugs in the DrugBank database and those in CMAP. 136 6-7 The distribution of differential expression ranks in CMAP for the genes deemed to be the target genes according to DrugBank. . . 136
6-8 Drug similarity network pairwise network comparison . . . 141
6-9 Consensus drug similarity network . . . 142
6-10 Stem cell PCA analysis of four cell-cycle affecting drugs . . . 147
6-11 Drug target genes marker gene score heatmap . . . 151
6-12 Tissue specific drug target gene expression correlation similarity . . . 153
6-13 Drug target gene correlation distribution CDFs . . . 154
6-14 Drugs similar to haloperidol when using only the target genes’ expres-sion correlation . . . 157
6-15 Drugs similar to haloperidol when using the target genes and PPI neighbor’s expression correlation . . . 158
6-16 Drugs similar to haloperidol when using the Jaccard index of target genes that overlap . . . 160
6-17 Drug target gene tissue specific accuracy . . . 161
6-18 Drug target gene tissue and PPI neighbor specific accuracy . . . 162
B-1 Expression intensity distribution of the top 20 over-expressed soft tis-sue genes in the transcriptomic landscape . . . 185
B-2 Expression intensity distribution of the top 20 over-expressed blood genes in the transcriptomic landscape . . . 186
B-3 Expression intensity distribution of the top 20 over-expressed brain
List of Tables
3.1 Selected concept enrichment performance results . . . 61
3.2 Quantification of dataset effect . . . 64
4.1 Breast and breast cancer marker genes . . . 87
5.1 Low MMTx sensitivity UMLS concepts . . . 109
5.2 Example MMTx concepts for a phrase . . . 110
5.3 Example input for a na¨ıve Bayes classifier parameter . . . 112
5.4 Concept indicator vector . . . 112
6.1 Cross-tab of the number of CMAP samples that were performed on the various gene expression platforms and the corresponding cell lines. 129 6.2 Cross-tab of the number of CMAP samples that were performed for the top 30 most frequent treatments and their corresponding cell lines. 130 6.3 The set of related drugs when we enforce that the drugs be similar using all five similarity metrics. . . 143
6.4 The top 30 treatments (by percentage) of the treatments found in the upper left neighborhood of Figure 6-10(b) . . . 149
B.1 Over enriched GO concepts in transcriptomic lanscape soft tissue cluster183 B.2 Over enriched GO concepts in transcriptomic lanscape blood cluster . 187 B.3 Over enriched GO concepts in transcriptomic lanscape brain cluster . 190 C.1 Cross-validation performance of Concordia . . . 191
D.1 Over-enriched GO concepts for breast tissue marker genes . . . 301
D.2 Over-enriched GO concepts for breast cancer marker genes . . . 309
D.3 Stem cell genes in the DNA replication / cell cycle module . . . 313
D.4 Genes in the RNA transcription / protein synthesis module . . . 315
D.5 Stem cell genes in the metabolism / hormone signaling / protein syn-thesis module . . . 317
D.6 Stem cell genes in the multicellular signaling / immune signaling / cell identity module . . . 318
D.7 GO terms associated with the DNA replication / cell cycle module in stem cell gene set . . . 319
D.8 GO terms associated with the RNA transcription / protein synthesis module in stem cell gene set . . . 325
D.9 GO terms associated with the metabolism / hormone signaling module in stem cell gene set . . . 328
D.10 GO terms associated with the signaling / cellular identity module in stem cell gene set . . . 331
E.1 Cross-tab of the number of CMAP samples that were controls and treatments and the corresponding cell lines. . . 337
E.2 Cross-tab of the number of CMAP samples that were performed on the various gene expression platforms and the corresponding cell lines. 337 E.3 Cross-tab of the number of CMAP samples that were performed on the various gene expression platforms and the corresponding treatment mediums. . . 338
E.4 Cross-tab of the number of CMAP samples that were performed using the various treatment mediums and the corresponding cell lines. . . . 338
Chapter 1
Introduction
The science-fiction film GATTACA depicts a world in which a person’s susceptibility to different diseases is known at birth based on an analysis of the newborn’s genetic code. Although the bleak outlook of the future presented in this film is plagued by the detrimental use of genetic information to form social castes, imagine a rosier view in which a person’s genetic information can be used not only to prevent certain dis-eases, but also to provide personalized treatment that is attuned to an individual’s exact biological and environmental properties. For example, imagine the amount of pain and suffering that can be avoided if a surgeon where to be able to conclusively determine the origin and exact subtype of a tumor and compare the treatment out-comes of patients with similar biological and clinical properties such that the most efficacious treatment can be implemented. This will become the norm in the near future. In order for this to become a reality, however, a vast amount of data needs to be leveraged and combined to produce accurate predictors for the wide array of clinical outcomes.
While there are many types of biological data that can be used to aid in answering the question of what makes a certain tissue different from another, or a certain disease similar to some other seemingly dissimilar disease, gene expression analyses have become standard in high-throughput analyses of tissues and diseases. Simply stated, a gene expression experiment (also known as a microarray experiment) provides a snapshot view of thousands of genes and denotes whether they are turned “on” and
“off” (see Section 1.1.3 for more details). Such snapshots can be used to compare different types of tissue (e.g. lung vs. brain tissue) or different states of a tissue (e.g. normal vs. diseased). For example, Alizadeh et al. [6] performed an analysis of a large B-cell lymphoma, a malignancy of the lymphatic system, by analyzing which genes were turned “on” and “off” in the resected lymphatic tissue of patients. Based solely on the gene expression patterns, they were able to find two distinct clusters of patients. What made these two sub-populations different? A dramatic difference in mortality rate. By “merely” looking at the genes that were expressed in lymphatic tissue they were able to generate a diagnosis with great clinical relevance. Imagine if we could perform such analyses for all types of diseases.
To make these sorts of analyses and potential subsequent clinical applications routine, however, we require a large curated database of thousands, or even hundreds of thousands, of samples across multiple phenotypes. Leveraging the data in such a database, we can then not only examine the outcomes of a single disease, but rather, begin to understand the biological underpinnings of hundreds of diseases and their subtypes. Furthermore, it becomes imperative not to perform these analyses in isolation, but rather in the context of other tissues and diseases from various types of patients. For instance, the treatment course for the same disease may be markedly different for two individuals based on other diseases they may also have. With rapidly growing repositories of public microarray data (see Figure 2-1), the notion of using hundreds of samples spanning various tissues and diseases to perform detailed gene expression based analyses has become feasible. Similarly, with the constant decrease in price and complexity of performing microarray experiments, the clinical application of microarrays is within reach. Unfortunately, without a so-called “black box” that a clinician can use to test a given patient’s gene expression data against, gene expression data cannot be used as a diagnostic tool.
Other recent work utilizing large disparate datasets by Butte et al. [19] and Segal et al. [116] show that it is possible to find genes and gene modules that are significantly associated with various phenotypes. Alternatively, Dudley et al. [28] recently showed how the genes that are expressed in various diseases can be used for repurposing drugs.
Commercial ventures such as NextBio [67] and Oncomine [103] have also begun to take the results from disparate biological experiments to elucidate novel insights. Building upon the foundation of the ideas and insights of these large-scale analyses, we show how we can build a large, curated gene expression database (Chapter 2) and then how it can be used to accurately label previously unseen expression samples with their phenotypic labels (Chapter 3), elucidate sets of phenotype specific “marker genes” (Chapter 4), expand an expression database through active learning (Chapter 5), and how it can be applied to analyze drugs (Chapter 6).
1.1
Biology and terminology
Before delving deeper, let us review (or, for some, learn for the first time) some introductory biology. For those of you who are familiar with transcriptional biology and the workings of microarray technology, feel free to skip to the next chapter.
1.1.1
Basic biology
At the most basic level, living organisms are made up of individual cells. Some
very simple organisms, such as bacteria, are unicellular and are called prokaryotes1.
Humans, on the other hand, are eukaryotic organsism and are not only multicellular, but are comprised of cells that have a nucleus. Although there are many different types of cells in complex multicellular organisms (liver cells, brain cells, blood cells, etc.), each cell contains the entire blueprint, or genetic code, for that particular organism. As such, it could theoretically be possible to make a whole new organism by taking any cell from that organism and copying it (just like they did in the book, and later movie, Jurassic Park ). This genetic information is stored in the form of
DNA (deoxyribonucleic acid) and is primarily found in the nucleus of the cell2. When
one refers to an organism’s “genetic code,” one generally means the arrangement of
1More accurately, organisms that are comprised of cells that lack a cell nucleus are called
prokary-otes. Eukaryotes are organisms that are made up of cells that have a cell nucleus.
2There is also a small amount of mitochondrial DNA (mtDNA) in the energy producing structures
the four chemical bases (also called nucleotides) adenine (A), guanine (G), cytosine (C), and thymine (T) that make up the DNA (Figure 1-1). While all humans share about 99% of the 3 billion bases, the differences in the arrangement of the A, C, T, and Gs for the remaining 1% is what differentiates you from me [84]. Importantly, in the double helix of DNA, adenine always pairs with thymine, and guanine always pairs with cytosine. Although outside the scope of this introduction, it is vital that these pairings remain constant, as during cell replication, it is imperative that each daughter cell can make a full double helix of DNA from just one strand of DNA.
Figure 1-1: Adenine pairs with Thymine, and Guanine pairs with Cytosine to make the familiar double helix of DNA [84].
If the DNA is considered the blueprint document of an organism, the genes that are encoded in this DNA can be considered to be the individual specifications for the rooms, stairwells, and so forth. The 3 billion bases of DNA are subdivided into smaller regions known as genes. Currently it is estimated that humans have between 20,000 and 25,000 genes [84]. Each of these genes, which can be as short as a few
hundred DNA bases to over 2 million bases, are the instructions for building molecules known as proteins. Proteins are the workhorses of the cells and are required for the function, structure, and regulation of the tissues and organs in the body.
1.1.2
Transciptional biology
As the contents of this work deals with gene expression of humans3, let us explore the
process of how proteins are synthesized from DNA. As aforementioned, the DNA of a eukaryotic cell is located in the nucleus. Most of the work that is performed by the cell, however is undertaken by proteins in the cytoplasm outside of the nucleus. The
genetic code of the gene4 located on the DNA is not directly converted into protein in
the nucleus, but first converted to RNA (ribonucleic acid) that then moves out of the nucleus and is used as a “carbon copy” of the DNA blueprint to create the protein. Just like DNA, RNA is comprised of four nucleotides. Unlike DNA, however, uracil is used in the place of thymine (the RNA alphabet is A, C, U, and G). This process of converting DNA to RNA is called transcription and the specific type of RNA that
is produced is called messenger RNA (mRNA)5.
Once the mRNA has been exported out of the nucleus into the cytoplasm, it makes its way to the ribosomes, the protein factories of the cell. Here, the protein is built as a chain (polymer) of amino acids where the sequence of amino acids is determined by the template provided by the mRNA. Unlike the one-to-one translation of DNA to RNA (except for the T that becomes a U), the nucleotides of the RNA are processed
3The data that we use for this work is all human data, but it could just as easily be applied to
any other organism.
4Although colloquially one says that genes are what become proteins, it is actually the open
reading frame (ORF) within the gene that is transcribed to RNA. As a gene is any heritable piece of DNA it also includes other information, such as promoter regions, that are not directly used in the creation of a protein. Thus, the mRNA that is produced starts from the 5’ (read five-prime) region of the ORF that begins with a start codon, and goes until a stop codon is reached in the 3’ area. Bits of DNA before the start codon are considered “upstream” of the ORF and are known to be located in the 5’ untranslated region (UTR). Similarly, DNA past the stop codon are in the downstream 3’ UTR. It is well known that there are many proteins (known as transcription factors) that bind to specific promotor regions in the UTR and activate or deactivate the transcription of the downstream ORF.
5Other types of RNA include transfer RNA (tRNA) that bring amino acids to the site of protein
in groups of three. Although there are 64 possible combinations of of trinucleotides (commonly known as codons) there are only 20 common, naturally occurring amino
acids. Thus, there are several codons that code for the same nucleotide6. Also, a
few of these codons do not represent amino acids, but rather the start (or initiation) and stop (or termination) codons that aptly describe the location to start and stop converting the mRNA into the protein. This entire process of using mRNA as a blueprint for generating a new protein molecule is called translation.
Both programmed events within the cell and external events can cause the initi-ation of transcription and transliniti-ation. For example, the genetic machinery for cir-cadian rhythm includes transcriptional events that happen approximately every 24 hours without any external stimuli. The model of rhythm generation in Drosophila is detailed in the work of Wilsbacher and Takahashi [139]. Alternatively, pathological events within the cell can start transcriptional activity. For instance, self-destruction (apoptosis) can be triggered by self-repair or damage-detection programs internal to the cell when something “breaks” the DNA within the nucleus. On the other hand,
the external piezoelectric forces7 generated in the bones caused by walking can
grad-ually cause bone remodeling by stimulating transcriptional activity of certain bone
cells8. An “in-between” example is where hormones secreted from distant organs bind
to the receptors on the cell, triggering the transcriptional process.
1.1.3
Gene expression experiments
The term gene expression experiment (also known as a microarray experiment ) has been previously used but never clearly defined. In essence, a microarray experiment is a snapshot view that simultaneously measures the expression levels of thousands of genes in a sample. The higher the expression level, the more “turned on” the gene, and the lower the expression level, the more “turned off.” Although they are called “gene” expression experiments, they actually measure the quantity of mRNA that is
6A biological instance of the famed “pigeonhole principle.”
7Piezoelectricity is the charge that builds up in bone and DNA (and other solid materials) caused
by the application of mechanical pressure or stress.
present (expressed) in the sample. The assumption is that if more mRNA is present, more proteins corresponding to that mRNA will be generated in the cell. In this manner, we can compare the quantity of mRNA corresponding to thousands of genes across different phenotypes. By analyzing what genes are “turned on” and “turned off” (i.e. which genes are being transcribed and translated into proteins) in different phenotypic conditions, we can hope to identify what causes brain tissue to be brain tissue and not skin tissue. It is important to note that microarray technology is not special because it can uniquely measure gene expression, but rather because it can do it in a high-throughput manner. Instead of measuring the expression of one gene at a time, microarrays allow researchers to analyze the expression of thousands of genes simultaneously.
Figure 1-2: The basics of microarray technology. Fluorescence-tagged cDNA sample probes for a tissue or system of interest are hybridized to a microarray chip containing cDNA probes. After the hybridization process, the chip is scanned using a laser, and the intensity levels at each probe location are measured to determine the expression level for a particular gene.
tis-sue or system of interest (e.g. brain) and creates a fluorescence-tagged complimentary
DNA (cDNA) copy of this mRNA9 (Figure 1-2). These sample probes are then
hy-bridized to a microarray chip (also known as a platform)) that have cDNA probes attached to the surface in a predetermined grid pattern. The underlying idea behind this process is that a sample probe will only bind to its complementary probe, thus allowing a scientist to measure the quantity of the sample probe present. After leav-ing the microarray chip submerged in the solution containleav-ing the sample probes for several hours, any excess unhybridized sample probes are washed off. The microarray is then scanned using laser light and a digital image scanner records the brightness level at each probe location. The brightness at a particular spot is correlated with the RNA level in the original tissue or system of interest [112] and is thus used as the expression level for that gene. Since the probes that are on the sample chip are the same for the different conditions being tested (i.e. exact duplicates of the chip are used) in a single “dataset” generated by a researcher, the differences in the expression levels for the genes can be attributed to the biological differences and not technical differences (Figure 1-3).
Throughout this work, the following definitions will be used unless explicitly stated otherwise. A microarray dataset (series) will be a set of microarray experiments (sam-ples) that were conducted by a specific lab for a specific purpose. For example, if a group of scientists were studying lung cancer and performed ten microarray exper-iments, five disease state experiments and five control experexper-iments, then the set of these ten experiments is a dataset. Each experiment will also have associated with it a sample chip (platform or array). The platform is the actual chip that the mi-croarray experiment was conducted on, for example the Affymetrix HGU-133A chip. Figure 1-3 shows a pictorial representation.
There are multiple different forms of microarray technologies, the two major ones being spotted cDNA arrays and oligonucliotide arrays. While both of them measure gene intensity levels, the approach of how they are created and the way in which the
9Recall that adenine always pairs with thymine, and guanine always pairs with cytosine. Because
this always is true, we can create the complementary DNA (i.e. if it was an A it becomes a T, if it was a T it becomes an A).
Figure 1-3: The relationship of a dataset, an experiment, and a platform. For a single dataset there are multiple different samples produced (in this case 6), all of which are performed on a single chip (platform) type (in this case the Affymetrix HGU-133A).
intensities are measured differ. The former was introduced by Mark Shena et al. [112] in 1995 and is also known as a cDNA microarray. Typically, a robotic spotter picks up cDNA that has been amplified using Polymerase chain reaction (PCR) and places it on a glass slide. When performing the experiment, two conditions are actually tested simultaneously, each with a different fluorescent color. The intensity levels are then measured as a ratio of the two conditions. On the other hand, oligonucleotide arrays are generated by a photolithographic masking technique first described by Stephen Fodor et al. [37] and made popular by Affymetrix. Unlike the cDNA arrays, oligonu-cleotide arrays only measure one condition at a time. One therefore needs to perform multiple experiments in order to compare multiple conditions. A more in-depth ex-planation about microarray technology and the various types of microarrays can be found in Microarrays for an Integrative Genomics [65]. Our work will exclusively deal with oligonucleotide array data performed on the Affymetric HG-U133 Plus 2.0 array.
Difficulties in dealing with microarrays
Although microarray technology enables one to get a genome-wide snapshot of the quantity of RNA levels in a sample, there are many factors that make this data difficult to deal with. Simply put, the data is noisy. For example, a replicate experiment that uses exactly the same experimental setup can, and often does, report different
expression levels. While this may seem disconcerting, this irreproducibility of data is not limited to microarray technology, but also occurs in most types of experiments in which miniscule quantities are measured with a highly sensitive device. The standard approach to dealing with this problem is to make many replicates and hope that the intensity values of the repeats converge to the true measure (this is one of the reasons why generating a large curated database of expression data is useful). Unfortunately, not only are microarray experiments very expensive, but these sort of repeats tend to eliminate noise caused by measurement errors and not the biological variation inherent in the samples being studied.
Another major obstacle in dealing with microarray technology is the lack of cross platform reproducibility. As detailed in [65], high intensity levels in a cDNA experi-ment did not correspond well with high levels in oligonucleotide experiexperi-ments. In light of these findings, the current work only uses single channel data. Furthermore Hwang et al. [57] performed a study where they compared two human muscle biopsy datasets that used two generations of the Affymetrix arrays (HG-U95Av2 and HG-U113A) and showed that they obtained differences in both cluster analysis and the differentially expressed genes. While this is an unfortunate conclusion, this sort of noise is in-evitable and cannot be countered. For this reason, we only use gene expression data from a single gene expression platform (Affymetrix HG-U133 Plus 2.0).
Chapter 2
Concordia: The system and its
application to GEO
The widespread adoption of electronic storage media throughout the medical and biomedical research communities presents significant new challenges and opportuni-ties. The American Recovery and Reinvestment Act of 2009 will invest $19 billion in a program to promote the adoption of information technology throughout the American health care infrastructure in the coming years. In particular, the Act em-phasizes widespread implementation of electronic health record (EHR) systems. By recent estimates, only 17% of doctors and 10% of hospitals are currently utilizing such systems [16]. The financial incentive schedule included in the program, valued at approximately $17 billion, is intended to motivate doctors and hospitals to adopt technologies that interoperate with other parts of the healthcare system by 2015, or face financial penalty in subsequent years [16]. The volume of data generated by this mandate over the coming years will be tremendous.
In addition to the imminent proliferation of electronic medical records, a variety of high-throughput biomedical assays have been refined over the past decade, and more continue to be developed today. It is expected that the data derived from these assays will eventually be brought to bear on clinical diagnostics as well as therapeutic drug design. The volume of data available from some of these sources (e.g., NCBIs Gene Expression Omnibus repository [31, 13], the European Bioinformatics Institute’s
Ar-rayExpress [97]) has already outstripped our ability to perform large-scale, automated discovery of relevant patterns among records with shared phenotype. Moreover, at present, there exist no systems capable of associating these assay records in a stan-dardized and meaningful way with relevant EHRs or other clinical narrative. Such cross-pollination would enable sophisticated quantitative clinical diagnostic systems, as well as accelerate the pace of therapeutic innovation.
Year Samples In Database 2000 2002 2004 2006 2008 2010 2011 (May) 10 670 2645 10386 28262 63661 109443 187544 272475 383743 510235 0 150000 300000 450000 600000 2000 2002 2004 2006 2008 2010 Samples in GEO Samples In Database
Figure 2-1: The number of gene ex-pression samples has been growing at a dramatic rate since the inception of NCBI’s Gene Expression Omnibus 10 years ago.
In addition, there are no open, scalable, standardized systems for cataloging and searching large vol-umes of medical data that leverages
existing expert knowledge. Many
institutions have developed propri-etary in-house solutions that tend to be ad hoc, lack portability between problem domains (e.g., systems de-signed for retrieving medical records cannot be easily adapted to the task of retrieving medical literature) and require a major technical undertak-ing. The applications that consume such services must interact with sev-eral different systems that cannot
in-teroperate with one another in any natural, meaningful way.
To this end, we have developed a scalable, standards-based infrastructure for searching multiple disparate databases by mapping their corresponding textual con-tents onto a structured medical ontology. Although we only present several targeted use cases for this system, the framework can be leveraged against any database where free-text attributes are used to describe the constituent records (for example, medi-cal images might be associated with a short description, or clinimedi-cal lab results with doctor’s notes). Similar to the spirit in which a traditional search engine allows one
free text-query to search for multiple content types (web pages, images, maps, etc.) through an open API, the system likewise provides a platform built to open stan-dards, able to support a diverse suite of applications that need to query a variety of clinically relevant content (EHRs, biomedical assays, journal publications) using Web 2.0 methodologies. Such a system would form the cornerstone backend search tool required to build portable applications that leverage the wide variety of data-rich resources that are becoming available, thus addressing one of the core challenges in personalized healthcare practice: identifying clinically distinct subgroups to which a particular patient belongs [64].
We envision the utility of such a query tool to increase over time as the volume of biological assay data and “traditional” medical information converted to electronic form grows. Rather than simply providing persistent storage of such documents (as is the case microarray databases such as GEO and ArrayExpress), a unified, generic search and retrieval tool will give the practitioner of medical, biological, or information sciences the ability to query a wide variety of document sources, and navigate the results in an intuitive and meaningful way. As previous endeavors to mine narrative text associated with biological experiments [19] and medical records [109, 108] have shown, there is a substantial amount of useful information that is readily available. In a clinical setting, applications of data mining projects include identification of populations for recruitment and for sample acquisition, observational studies married to sophisticated time-series analysis for pharmacovigilance, quality improvement and biosurveillance [72]. Furthermore, deeper understanding of the systems biological processes can be gleaned by incorporating the vast amount of publicly available data. For example, Lukk, et al. used gene expression experiments of various phenotypes from ArrayExpress and depicted a map of human gene expression [77].
NLP Ontology Free-Text Queries Source Documents [1] [2]
Figure 2-2: Both the text from the source documents [1] and the free-text queries [2] get mapped to UMLS con-cepts. Querying for the parent concept [2] will return all documents relating to child concepts as they relate to the more specific concepts.
Concordia is a framework for map-ping both queries and source doc-uments onto a structured ontology. This enables users to leverage both the textual information inherent in the document and the ontological as-sociations among the relevant
key-words. More concretely, we take
the free-text associated with a given record (the description of the con-tents of a medical image, for exam-ple) and use a natural language pro-cessing (NLP) program (see 2.1.1) that maps this free-text to the pre-defined concepts in the ontological vocabulary. For instance, the text associated with an x-ray of broken bone may read, “Compound trans-verse fracture of tibia caused by ski-ing accident.” We then insert this record in an ontological index such that a query for all of the concepts that it directly was mapped to (e.g.
“tibia” and “compound transverse fracture”) by the NLP program and any of the ancestor concepts (e.g. “leg” or “fracture”) would return the record. Queries to this system can either be performed using one or more of the concepts in the ontological vocabulary or via free-text that is then converted to a set of keywords automatically. When the query is in the form of free-text, the same NLP program used to index the documents is used to obtain the concepts for the provided input. Using this frame-work, therefore, it is possible to perform arbitrarily specific queries for uses such as
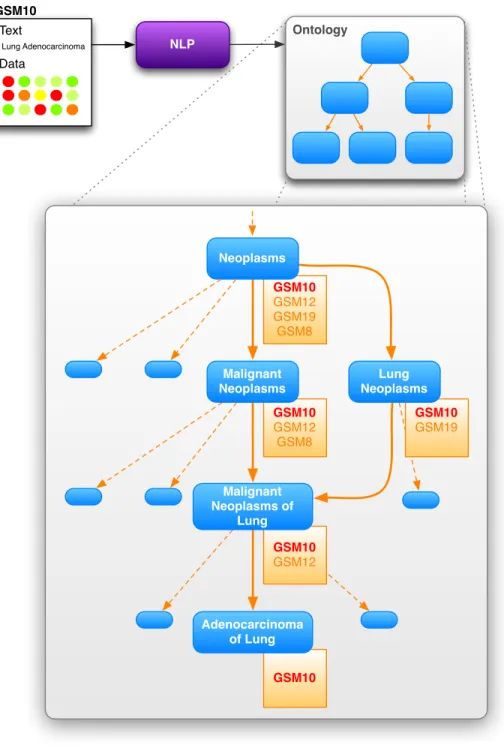
data mining or patient recruitment for a particular study. For a further example that depicts the mapping of a “Lung adenocarcinoma” gene expression sample into a structured medical ontology see Figure 2-3.
In addition to simple queries based on single concepts, the system can efficiently aggregate documents that match arbitrarily complex logical combinations of concepts. This has been implemented as a standard stack-based algorithm [91] for evaluating in-fix set logic expressions. Here, the operands will be set operators (union, intersection, difference) and the arguments will be UMLS concepts. Conceptually, the algorithm works by replacing the stack entry for each UMLS concept in the expression with the set of database records that reference it, then proceeding with the logical evalua-tion as usual. This will enable the user to perform free-text queries such as “anemia and cancer” or “lung cancer and metastasis but not smoking” against the library of documents.
2.1.1
Why use an ontology? What ontology should we use?
With the growing argument for letting the data drive the associations between related concepts [51], why are we relying on a manually curated ontology to drive the associ-ations between concepts? First, and foremost, unlike traditional text-based domains such as web-search or document retrieval, the aim of the Concordia framework is not only to query for documents related to concepts, but also to enable the integration of various sources of possibly non-textual data. As others have previously noted, the conceptual representation of data using an ontology allows such disparate databases to be linked in a transparent way to facilitate data analysis [136]. Furthermore, there are two major challenges that arise when searching free-text medical literature as it appears in electronic medical records, medical reference volumes or other relevant doc-uments: resolving synonyms and identifying conceptual relationships between medical terms.
Multiple synonymous phrases are often used to describe one common medical or biological concept. For example, the terms “malignant neoplasm of the lung” and “lung cancer” both describe the same medical concept, but there is no agreement
GSM10 GSM12 GSM19 GSM8 Neoplasms GSM10 GSM12 GSM8 Malignant Neoplasms GSM10 GSM12 Malignant Neoplasms of Lung GSM10 GSM19 Lung Neoplasms GSM10 Adenocarcinoma of Lung NLP Ontology Text Data Lung Adenocarcinoma GSM10
Figure 2-3: The free-text associated with a record is analyzed using a natural lan-guage processing program that maps the free-text to the predefined concepts in the ontological vocabulary. Using this model, we can combine existing expert knowl-edge (in the form of the associations in the ontology) and the information inherent in the text of the records. In this example, therefore, we can associate the data of GSM10 with the concept “Adenocarcinoma of the lung,” and all of its ancestors in the hierarchy.
on which term should be used to describe the one underlying concept, a malignant cancerous growth appearing in the lung. To see where this becomes a challenge, consider searching a database for the phrase “lung cancer” where all of the constituent documents refer to “malignant neoplasm of the lung.” Searching the database by simple string matching will fail to find the documents related to the query. The use of a controlled vocabulary, however, mitigates this issue as there is one “correct” concept for “lung cancer.”
As for the case of potentially complex associations between various concepts, the relationships between concepts are clearly defined by the ontological structure of the controlled vocabulary. As depicted in Figure 2-3, for example, we see the clear relationship between the concept “Neoplasm” and “Adenocarcinoma of Lung.” While this link may be relatively trivial as both terms reference a word related to “cancer,” the relationship between “Inflammatory disorder” and “Asthma” is more opaque. Furthermore, the expert associations provided by an ontology allow queries to be made for concepts that may not have been directly mentioned in any of the source text of the corresponding data records. Continuing with the previous example, it may be the case that there are only records for “Asthma” and “Arthritis” in the database. Due to the hierarchic relationships in the ontology, however, we can return all records associated with “Asthma” and “Arthritis” when a user queries for “Inflammatory disorder.” Thus, this hierarchical index allows us to efficiently traverse the ontology and retrieve records related to a particular concept and its descendants (or ancestors). Although it may be possible to generate a de novo taxonomization of the medi-cal vocabulary with a large enough corpus of medimedi-cal data, both of these challenges can be addressed by employing the cumulative expert knowledge that is represented in well-established ontologies of a controlled vocabulary. While countless ontologies exist, and the Concordia framework can employ any one of them, the National Li-brary of Medicines Unified Medical Language System (UMLS) [87] provides the ideal hierarchically structured controlled vocabulary for generating a database that allows users to insert and query documents along the lines of medically relevant concepts. Using the MetaMorphosys tool provided by the National Library of Medicine, we
created a custom ontology, known as a Metathesaurus, built from the expert curated thesauri of UMLS, SNOMED and MeSH.
Mapping documents and queries onto UMLS Metathesaurus
In order to be able to use the UMLS medical ontology, the Metathesaurus, we first have to map the free-text associated with each record to the set of standardized concepts. To do this, we employ the the MetaMap [7] tool that matches syntactic noun phrases from an input text to UMLS concepts, effectively “standardizing” the text to a set of unique concepts. The method is comprised of the five following steps:
1. Parsing: The text is parsed into noun phrases using the SPECIALIST minimal commitment parser [83].
2. Variant Generation: Variants are generated for each phrase using the SPE-CIALIST lexicon and a database of synonyms.
3. Candidate Retrieval: The “candidate set” of all strings in the Metathesaurus that match at least one of the variants is generated.
4. Candidate Evaluation: Each of the candidates in the candidate set is evalu-ated against the input text.
5. Mapping Construction: Candidates from disjoint parts of each input phrase are combined and are then scored. The combined candidate mappings with the highest scores correspond to MetaMap’s best interpretation of the input text.
In our setting, the application of MetaMap to the textual portions of data records allows us to resolve the problems of synonyms. One of the major benefits of this approach is that when we later query the database, we can apply the same stan-dardization to the input query as was used to transform the original source text. In this manner, we can search for database entities matching the query in the struc-tured space of standardized UMLS concepts rather than free-text. In addition, when a practitioner later wishes to perform large-scale data mining on such a database,
we can treat the UMLS concepts associated with the database entities as a discrete labeling thereof, without applying ad-hoc text searches to identify groups of related records.
MetaMap, however, only provides the direct mappings from the free-text to the exact UMLS concepts that are referenced in that text. To leverage the full potential of the UMLS ontology, we map each of the directly hit concepts (the concepts that MMTx actually labeled the free-text with) up the hierarchy in order to provide the aforementioned functionality of returning records referencing “Asthma” and “Arthri-tis” when a user queries for “Inflammatory disorder.” The downside of performing this mapping is that nodes high up in the hierarchy can become severely bloated as they contain record IDs for all records that its descendant nodes contain. However, empirical testing showed that the dramatic speed increase obtained from not having to recursively traverse descendants of a node to obtain all record IDs made this a worthwhile tradeoff.
2.1.2
Software infrastructure
As depicted in Figure 2-4, the Concordia framework acts as a piece of middle-ware between user interfaces and the underlying data repositories. All communications to, from, and within the framework are via standards based protocols. Open to the public are a set of Simple Object Access Protocol (SOAP) methods that allow a user to query for information such as all record IDs in the database, the set of record IDs corresponding to a given concept, the set of record IDs corresponding to an arbitrary logical combination of concepts, the set of ancestor (or descendant) concepts for a given concept, and so forth. For a detailed user-interface example, see Section 2.2. The current implementation has this SOAP service implemented in Microsoft’s C#
and is running on a Windows 2000 Server1.
1This server has been virtualized and currently is merely a virtual Windows 2000 Server running
NLP Engine API
GEO RecordsPatient
Other Data with Free-Text Web Ontological Index XML RPC Concordia External Databases User Interface Plug-In Custom Application SOAP XML RPC XML RPC XML RPC
Figure 2-4: The Concordia framework acts as a piece of standards based middleware between user interfaces and traditional data repositories to provide the functionality of querying the data along the lines of concepts (and their relationships) as defined by some arbitrary ontology. To allow for maximum portability and scalability, Inter-actions from the user interface(s) are sent to the framework via SOAP which then interacts with Concordia over XML-RPC. Once the record indicies have been iden-tified in the ontology, XML-RPC requests are sent to the underlying databases that contain the source documents.
Head Client W orkers XML RPC SOAP
Figure 2-5: Scalability of the
Con-cordia system architecture. Due to
the use of XML-RPC calls between all parts of the system, the system can be extended to include multiple worker nodes that fulfill the request of a head node.
The SOAP interface interacts with the Concordia framework via XML Remote Procedure Calls (RPC). Within the framework itself, we also employ XML RPCs for the commu-nication between NLP engine and
the ontological index. If the user
wishes to obtain the actual data records, the system will then com-municate with the underlying source database(s) to obtain the records. Although the system allows for mak-ing queries to the underlymak-ing source databases (which may be located on different servers of different organi-zations) via XML RPCs, it is also capable of directly communicating to underlying databases without the use of XML RPCs. If only the record
IDs are requested, they are simply returned without interacting with any (possibly) outside database. These results, regardless of whether they are just the IDs or the full records, will be passed back to the user via the SOAP interface.
The persistent hierarchical database in the Concordia framework is written in Java and utilizes the Oracles’s BerkeleyDB JE package. Although there is a longstanding debate [89, 79, 59] as to whether hierarchic database models (e.g. the IBM Informa-tion Management System, the Microsoft Windows Registry, and XML) offer better performance than relational databases (e.g. MySQL, Microsoft SQL Server, Postgres, etc.) we find that the ability to efficiently store and retrieve large blocks of data outweigh the benefits of the flexibility provided by a traditional relational database. Furthermore, the in-core nature of the BerkeleyDB allows us to easily serialize the
data structures manipulated by our search algorithms without the communication overhead incurred when interacting with an out-of-core database service.
The use of XML RPC based communication between the various parts of the framework allows for a scalable, federated system. Similar in spirit to Googles MapRe-duce methodology [24], queries can be processed by a head node which in turn requests that multiple worker nodes perform the database search in parallel (see Figure 2-5). Each of these worker nodes will be capable of searching a separate portion of the database. Results can then be returned to the head node, aggregated, and returned to the client. In addition, this infrastructure enables us to scale to meet future needs by simply adding additional worker nodes. Although the example federated structure in Figure 2-5 only depicts a single layer of worker nodes, it is entirely possible to have worker nodes make XML-RPC requests to other worker nodes that are responsible for different parts of the database. Furthermore, this system can be made fault tol-erant in a mission-critical environment by replicating worker nodes or dynamically reassigning the responsibilities of a failed node.
An example browser interface for gene expression data that has been processed using the Concordia framework is detailed in Section 2.2.5.
2.2
Concordification of GEO
2.2.1
GEO in a nutshell
Although there are a large variety of biological and medical data sources that could be indexed using Concordia, we limited the scope of this work to the gene expression samples from the Gene Expression Omnibus (GEO) [13]. GEO is a public database containing gene expression and molecular abundance provided by the National Center for Biotechnology Information (NCBI). GEO data is divided into GEO Data Sets (GDS), GEO Series (GSE), GEO Samples (GSM), and GEO Platforms (GPL) files (Figure 2-6). GDS and GSE files are datasets, GSM files are individual samples, and GPL files are the microarray platforms (arrays) on which the samples were prepared.
The difference between a GDS and GSE file is that a GDS file contains additional meta information that the curators of GEO added to the original GSE file that was uploaded. For example, GDS files contain subset information about each experiment such that one can see what condition a given experiment has in the dataset. The dataset with the identifier GDS1, for instance, was an experiment conducted to find genes related to reproductive tissue in Drosophila melanogaster. The various subset information provided includes information such as gender of the fly for the given sample and the tissue the sample was created from. Another important difference between GDS and GSE files is that a GDS may only contain experiments that were conducted on a single GPL platform. It is possible for a GSE to contain experiments with multiple platforms because there are instances when an experimenter compared multiple microarray platform technologies or performed a cross-species study. It is important to note that there are many more GSE files in GEO than GDS files, as there are many datasets which have yet to be manually annotated. Due to the large size of the GEO database, we only downloaded the human microarray data performed on the Affymetrix HG-U133 Plus 2.0 array. A complete list of the 192 series and 3030 samples that were downloaded can be found in Appendix A.
Figure 2-6: The relationship of GEO files as represented by a UML diagram.
2.2.2
Normalizing the gene expression samples
Our database is comprised of 3030 gene expression samples belonging to 192 distinct series performed on the Affymetrix HG-U133 Plus 2.0 arrays that were obtained from GEO (Appendix A). The original CEL files were downloaded from GEO and
MAS 5.0 normalization was performed on each sample before summarizing all probe specific values to gene specific values using a trimmed mean. MAS 5.0 was chosen over other more “aggressive” normalization methods because it can be performed on a per sample basis unlike other methods that require the entire dataset (or in our case entire database) to be used for normalization.
2.2.3
Concordification of GEO
! " #$%&'(()*+,-./.0.(' 1*+2'%/,*+/*3*45,-./.0.(' 6./.0.(' 7#8,(.9%3' :&'',/'$/ -'(2&)%/)*+ ;.%,2*+2'%/( <%,*+/*3*45 !++*/./',=)/>, 2*+2'%/(,<()+4 ;'/.;.% 1? 1@ 1A 1B 1C 1D E.+F,+*&9.3)G',.+-,)+('&/ 1A 1B 1D 1? 1@ 1A 1B 1C 1D H+('&/,(.9%3' H6,./,9.%%'-2*+2'%/( 1? 1@ 1A 1B 1C 1D 1I 1J 1K 1?L #$%&'(()*+,-./.0.(' 1*+2'%/,*+/*3*45,-./.0.(' 6./.0.(' 1? 1@ 1A 1B 1C 1D 1I 1J 1K 1?L #$%&'(()*+ M'2/*& HNOPQ 1*9%</' ()9)3.&)/5 R*&/,05,()9)3.&)/5 8M'&3.5,2*+2'%/ >)/S9)((,%&*T)3' 6./.0.(',(.9%3'(,(*&/'-,05,()9)3.&)/5 7'+'&./',>)/S9)(( %&*T)3'( 1?,>)/S9)((,%&*T)3' 1A,>)/S9)((,%&*T)3' 1J,>)/S9)((,%&*T)3' 1?L,>)/S9)((,%&*T)3' R*&/'-2*+2'%/( 8PQOPQ 1*9%</' U*39*4*&*MVR9*&+*M (/./)(/)2 ".-,#R,(2*&' 7**-,#R,R2*&' #R,(2*&' #R,(2*&' R*&/,2*+2'%/( 05,#R,(2*&' 1J 1?L 1C 1D 1@ 1? 1A 1K O&*T)3',U*39*4*&*MVR9*&+*M,(/./)(/)2(Figure 2-7: The Concordia database for GEO is comprised of a database of gene expression samples mapped to Unified Medical Language System (UMLS) concepts that is used to classify new input microarray samples. The free-text associated with each sample is processed using the National Library of Medicines MetaMap program to map each sample to a set of UMLS concepts. These concepts are then mapped up the ontology so that all ancestor concepts of the ones deemed relevant by MetaMap are also included as correct annotations for each respective sample. The gene expression values for these samples are then normalized and inserted into the Concordia database. Unlike previous endeavors, new data can be added to this system continually, without causing any interruption to the classification engine.
As aforementioned, a major obstacle to recovering signal from biological data (in this case transcriptional signals from microarray array samples) lies in the inconsistent ways in which the samples are described through their associated free-text metadata. Furthermore, there is no easy way to download a large set of disparate experiments and perform large-scale analysis without substantial effort. We follow the lead of
Butte, et al. [19] and extracted the title, description, and source fields from each of the 3030 expression samples and annotated them using the Java implementation of the National Library of Medicines (NLM) MetaMap program, MMTx [7]. A custom Unified Medical Language System [17] (UMLS) thesaurus was generated using NLMs MetaMorphosys program that only contained the concepts from the UMLS, MeSH, and SNOMED ontologies. These automated annotations were then verified by hand (see 2.2.4) such that we were left with 672 distinct UMLS concepts. Since these con-cepts only represented the most detailed level of annotation, we mapped the concon-cepts back up the ontology such that a sample labeled with a very specific concept also received labels corresponding to all of its ancestor concepts. Due to the domain of the data, we filtered the concepts down to only those that are descendants of either “Disease” or “Anatomy,” resulting in a total of 1489 unique concepts. The full list of UMLS concepts that were used can be found in Appendix A.
2.2.4
UMLS noise filtering
A major shortcoming of the approach of indexing biological and medical literature with concepts from the Metathesaurus using MetaMap (and many other natural lan-guage processing techniques), is the overabundance of false-positive results. This problem has been cited in the literature over the past several years [87]. Butte et al. [19] point out that poor text formatting, poor choice of identifiers, irrelevant text, and spelling errors all contributed to mis-annotations. For example, running MetaMap on the series description of GEO series 2230 (GSE2230), the abbreviation “PD” er-roneously maps to the concept “Parkinson’s Disease.” When we examine the original text we see that the author intended no association with the concept “Parkinson’s Disease”:
Analysis of gene expression by Affymetrix microarray in a CD4+ T lym-phocyte clone transduced with hTERT-GFP vector after after 44 and 80 population doublings (PDs). The untransduced (32 PDs) and GFP-control vector transduced (47 PDs) T cell clone populations served as
controls.
The MetaMap method simply operates on syntactic fragments and cannot discern the context from which the abbreviation was taken, and hence cannot infer the mean-ing of the “PD” abbreviation. To overcome such problems of over-sensitivity, we per-formed manual validation of the annotations automatically generated by MetaMap. We developed a simple C# based application that obtained the raw annotation results from MetaMap, and then allowed us to manually indicate the correct set of concepts for each record (Figure 2-8). In Chapter 5 we delve into more detail about how to efficiently curate a large database using the results from the NLP software along with leveraging the expression signal provided by each sample.
Figure 2-8: A screen shot of the application that was used to perform manual curation of UMLS concepts. Through this application one can select the concept(s) that are relevant to a given GEO series, dataset, and sample. It is also possible to add concepts manually that were missed by the NLP program.
2.2.5
Ontology based browsing of GEO
We also developed a sample front-end to the Concordia framework in an AJAX based web application that allows a user to browse the UMLS hierarchy and view the gene
expression samples that have been mapped to the concepts (Figure 2-9). The top panel allows the user to navigate through the library of experiments based on the
hierarchical organization of UMLS concepts. The lower panel allows the user to
view and interact with the data for experiments that were labeled at or below any particular location in the concept hierarchy. The user can select the experiments of interest and then download a large matrix of the expression intensity values for all of the experiments along with their respective UMLS concepts.
Figure 2-9: A screen shot of a web application built in front of a the Concordiafied gene expression data from GEO. The top panel allows the user to navigate through the library of experiments based on the hierarchical organization of UMLS concepts. The lower panel allows the user to view and interact with the data for experiments that were labeled at or below any particular location in the concept hierarchy.
Having data available in this format, it becomes easy for a researcher to quickly download various types of phenotypic data and perform analyses. Examples of the types of analyses that can be performed with a curated database of gene expression data will be the topic of the remaining chapters.
Chapter 3
Beyond differential expression:
Localizing expression samples in a
heterogeneous transcriptomic
landscape
Although gene expression microarrays have been a standard, widely-utilized biological assay for many years, we still lack a comprehensive understanding of the transcrip-tional relationships between various tissues and disease states. When microarray technology first became available, the high cost of performing these gene expression experiments was a likely cause for the small number of samples in early microarray studies. However, today, even with the hundreds of thousands of expression array data sets available through public repositories such as NCBIs Gene Expression Om-nibus (GEO) [13], the lack of standardized nomenclature and annotation methods has made large-scale, multi-phenotype analyses difficult. Furthermore, it is often chal-lenging to obtain the appropriate number of tissue samples from humans [65], and thus new studies are limited in the number of replicates for a given tissue or in the number of types of tissues. Thus, expression analyses have typically used the decade old approach of comparing expression levels across two states (e.g., case vs.
con-trol) or a limited number of phenotype classes [30, 48, 133]. Even recent large-scale gene expression investigations, whether they have attempted to elucidate phenotypic signals [73, 93, 103] or applied those signals for downstream analyses such as drug repurposing [68, 122], involved comparisons between two states or classes.
Comparative analyses, where transcriptional differences are directly measured be-tween two phenotypes, inherently impose subjective decisions about what constitutes an appropriate control population. Importantly, such analyses are fundamentally lim-ited in scope and cannot differentiate between biological processes that are unique to a particular phenotype or part of a larger process that is common to multiple pheno-types (e.g. a generic “cancer pathway”). Moreover, the results of such comparative analyses can be limited in generalizability as they make assumptions about the phe-notypes being compared [102]. Alternatively, in a data-rich environment, we can take a holistic view of gene expression analyses.
Dichotomous Comprehensive
“Cancer” signal dominates Breast Cancer
Tissue Normal BreastTissue
“Breast Cancer” signal dominates Breast Cancer
Tissue
Figure 3-1: A comprehensive perspective on expression analysis enables the elucida-tion of biological signals that are thematically coherent but provide an alternative view to traditional dichotomous approaches. For example, the gene-signature for “breast cancer” is enriched for breast specific development and carbohydrate and lipid metabolism in our comprehensive approach, as opposed to being dominated by a more general “cancer” signal.
We introduce a scalable and robust statistical approach that leverages the full expression space of a large diverse set of tissue and disease phenotypes to accurately perform and glean biological insights. By viewing a given phenotype in the context of this comprehensive transcriptomic landscape, we circumvent the need for predefined
![Figure 1-1: Adenine pairs with Thymine, and Guanine pairs with Cytosine to make the familiar double helix of DNA [84].](https://thumb-eu.123doks.com/thumbv2/123doknet/14155661.472484/22.918.290.631.400.811/figure-adenine-pairs-thymine-guanine-cytosine-familiar-double.webp)