Publisher’s version / Version de l'éditeur:
Proceedings Confederation Bridge Engineering Summit, pp. 195-209, 2007-08-19
READ THESE TERMS AND CONDITIONS CAREFULLY BEFORE USING THIS WEBSITE. https://nrc-publications.canada.ca/eng/copyright
Vous avez des questions? Nous pouvons vous aider. Pour communiquer directement avec un auteur, consultez la première page de la revue dans laquelle son article a été publié afin de trouver ses coordonnées. Si vous n’arrivez pas à les repérer, communiquez avec nous à [email protected].
Questions? Contact the NRC Publications Archive team at
[email protected]. If you wish to email the authors directly, please see the first page of the publication for their contact information.
NRC Publications Archive
Archives des publications du CNRC
This publication could be one of several versions: author’s original, accepted manuscript or the publisher’s version. / La version de cette publication peut être l’une des suivantes : la version prépublication de l’auteur, la version acceptée du manuscrit ou la version de l’éditeur.
Access and use of this website and the material on it are subject to the Terms and Conditions set forth at
Ice Interaction with Confederation Bridge – Review of NRC Program
Frederking, Robert; Kubat, Ivana; Prinsenberg, S.
https://publications-cnrc.canada.ca/fra/droits
L’accès à ce site Web et l’utilisation de son contenu sont assujettis aux conditions présentées dans le site LISEZ CES CONDITIONS ATTENTIVEMENT AVANT D’UTILISER CE SITE WEB.
NRC Publications Record / Notice d'Archives des publications de CNRC:
https://nrc-publications.canada.ca/eng/view/object/?id=7c312632-a946-4acb-bb4f-6447818c92b6 https://publications-cnrc.canada.ca/fra/voir/objet/?id=7c312632-a946-4acb-bb4f-6447818c92b6
ICE INTERACTION WITH CONFEDERATION BRIDGE – REVIEW OF
NRC PROGRAM
R. Frederking1, I Kubat1 and S. Prinsenberg2
1 National Research Council – Canadian Hydraulics Centre, Ottawa, Ontario, Canada
2 Department of Fisheries and Oceans, Bedford Institute of Oceanography, Dartmouth, Nova Scotia, Canada
Abstract: The Confederation Bridge is a unique structure located in an area with temperate but very
dynamic ice conditions. An extensive monitoring and research program including ice force measurements was carried out under the auspices of an NSERC Collaborative R&D Grant. In addition, the National Research Council carried out a complimentary program to measure the response to pack ice of two bridge piers adjacent to the navigation span. There were two objectives of the work. One was on the effect the bridge might have on ice conditions and winter navigation, and the other was on the ice loading on the two piers. The largest force measured over 8 winters was 2.4 MN. Interpreted pack ice pressure was estimated to be in the range of 1 kN/m to 10 kN/m.
1. Introduction
The forces which floating ice can exert on bridges in rivers have been an area of active research over the past several decades. Starting in the 1960s, field measurement programs have been carried out to measure ice forces on bridge piers. The Arctic has also been an area of active measurements of ice forces on the large offshore drilling platforms used for petroleum exploration. These measurements provided data on ice forces on smaller structures in more temperate river environments and large structures in the extreme ice conditions of the Arctic. When it comes to temperate marine ice environments, there is much less information. The Confederation Bridge, which is in a temperate but very dynamic marine ice environment, provided a new site for investigation of ice forces. Because of a number of unique features a Natural Sciences and Engineering Research Council (NSERC) collaborative R&D program was started in 1997 to assess the performance of the Bridge in response to environmental factors such as wind, seismicity, traffic and temperature, in addition to ice (Cheung et al. 1997).
Early in 1999 the National Research Council – Canadian Hydraulics Centre (NRC-CHC) initiated a complimentary program of measurements and observations of ice interaction with two piers. This program involved an extensive collaboration with the Department of Fisheries and Oceans through the Bedford Institute of Oceanography (BIO), and Public Works and Government Services Canada (PWGSC). BIO carried out a program investigating ice conditions in Northumberland Strait. PWGSC provided liaison with the Ottawa Carleton Bridge Research Institute, who managed the NSERC collaborative R&D project. The presence of the Confederation Bridge across Northumberland Strait has had an effect on the ice conditions in the area. The multiple piers and the strong tides, which move the ice back and forth, drive the ice against the piers, either breaking it or lodging it against the piers. The ice forces on the piers are a
Confederation Bridge Engineering Summit
Summit de ingéniée du pont de la confédération
Charlottetown, PEI, Canada August 19-22, 2007 / 19-22 Aout 2007
function of the ice thickness, size of floes and the forces driving the ice floes. Generally, the ice is broken up into smaller pieces as a result of failing against the bridge piers. Ice movements are also affected by the Bridge; the concentration upstream of the Bridge is greater than that downstream (Peterson et al. 1998). Note that this was predicted in a study prior to the Bridge being constructed (Brown, et el., 1994). The Bridge has also had an effect on winter navigation through the Strait. Before the Bridge, ships could select areas with the least ice, often following a shore lead. Now, with the Bridge, navigation is restricted to the navigation span in the center of the Strait. The channel in the navigation span is 172 m wide and all marine traffic must pass through it. The presence of ice and particularly pressure in the ice could have a serious affect on the ability to navigate safely through this narrow channel. Knowledge on the magnitude, frequency and circumstances of pressured ice and ice forces on the piers was of interest for winter navigation.
This paper will summarize the measurements of the response of the two instrumented piers to ice action, estimates of ice forces on the piers, estimates of pressure in the ice, and observations of ice conditions adjacent to the piers. It will also outline what was learned in carrying out the program and what was learned from it.
2. Data collection
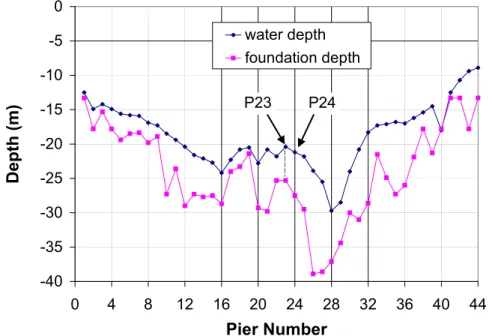
The main section of the Bridge (11 km) consists of 43 spans each 250 m long and 44 piers numbered P1 to P44 starting at the PEI end. The average water depth is about 20 m and a typical pier shaft extends 25 m above the water. A profile of water and foundation depth for each pier along the bridge alignment is shown in Figure 1. -40 -35 -30 -25 -20 -15 -10 -5 0 0 4 8 12 16 20 24 28 32 36 40 44 Pier Number Depth (m) water depth foundation depth P24 P23
Figure 1. Profile of water and foundation depth for piers across Northumberland Strait.
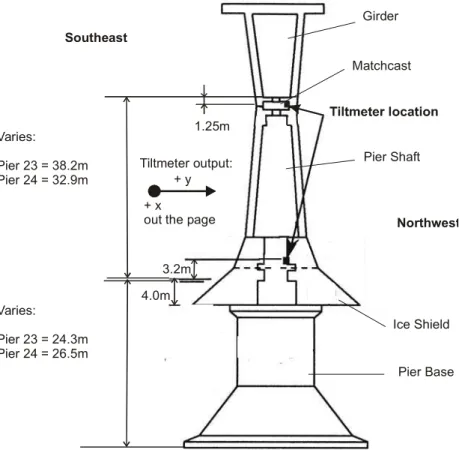
The navigation channel is between piers P21 and P22. To ensure the resistance of these piers to possible ship collision, they were filled with concrete, and consequently they were not accessible for instrumentation. Thus the two piers adjacent to the navigation span, P23 and P24, were selected in the NRC program for measuring ice loading. Each of the two piers has a different height and foundation stiffness. The foundation of pier P23 is 24.3 m below the water line (GML) and the top of the pier (base of girder) is 38.2 m above GML. The foundation of pier P24 is 26.5 m below the waterline and its top is 32.9 m above the water. Pier P24 has about a 50% softer foundation compared to pier P23 (Ross Gilmour, personal communication). The cross section of the pier is shown in Figure 2. Note that the height of these piers above the water line was greater than the 24.6 m for P31 and P32, which were instrumented to measure ice forces in the NSERC program (Brown, 2001). The response of the piers to ice loading was
quantified by measuring change in tilt at two levels in the pier. Applied Geomechanics 700-Series tiltmeters were selected for their high-sensitivity, low power consumption, durability, and reliability under rugged field conditions. They have an operational temperature range of –30°C to +70°C, a resolution of 0.1 µ rad, and have a full-scale range of ± 7500 µ rad. Two tiltmeters were installed inside each pier on the upstream side (northwest); one at the bottom of the pier inside the ice shield, 3.2 m above the water level (7.2 m from the ice shield’s bottom edge) and one at the top of the pier inside the match cast, 1.25 m below the bottom edge of the girder, as shown in Figure 2. The sign convention for tiltmeter output is illustrated in Figure 2. Remembering that the tiltmeter is on the upstream (northwest) side of the pier, ice impact from that direction would result in a decrease of the output. The X-axis tilts are in the longitudinal direction of the bridge (northeast - southwest), and are primarily in response to thermal expansion or contraction of the spans. Y-axis tilts are perpendicular to the longitudinal axis of the Bridge and are in response to ice and wind loading. A more complete description of the tiltmeter and data logging system may be found in Kubat et al. (2000).
Girder Matchcast Pier Shaft Ice Shield Pier Base Varies: Pier 23 = 38.2m Pier 24 = 32.9m Varies: Pier 23 = 24.3m Pier 24 = 26.5m 4.0m 3.2m 1.25m Northwest Southeast + x
out the page + y Tiltmeter output:
Figure 2. Cross section of the piers, observed from PEI end, showing tiltmeter locations.
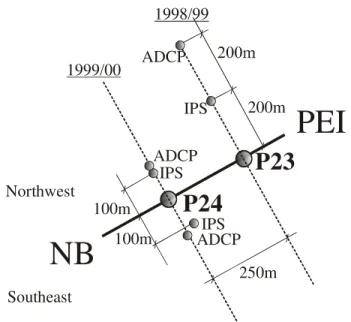
The Bedford Institute of Oceanography (BIO) carried out a program investigating ice conditions in Northumberland St. and the affect of the Bridge on them. As part of this study, they conducted helicopter surveys of ice conditions and installed instrumentation to measure ice thickness and ice drift velocity. The helicopter surveys acquired video imagery of the ice conditions as well as profiled ice thickness using an airborne electro-magnetic (EM) profiler (see Prinsenberg and Peterson, 2001). It provided very detailed information on ice thickness over distances of several kilometers and the results were processed into distributions of ice thickness. An example of an ice thickness profile taken just to the west of the Bridge on February 27, 2003 is shown in Figure 3. The EM profiler averages ice thickness over about a 25 m diameter footprint, so thicknesses over 2 m in Figure 3 represent substantial ice features. An Ice Profiling Sonar (IPS) and Acoustic Doppler Current Profiler (ADCP) were deployed on the sea bottom for several winters adjacent to piers P23 and P24. A description of the instrumentation and analysis of results is given by Belliveau et al. (2001). The IPS looks upwards to measure the distance to the bottom of the ice cover. It has a narrow beam so measures ice draft over a small area. The ADCP measures current velocity at
various depths in the water column and also velocity of the ice. By combining ice draft and velocity the spatial profile of ridges can be obtained. The location of these instruments in 1999 and 2000 is shown in Figure 4. PWGSC measured meteorological data, which was very important in the analysis of the tiltmeter results. Through the courtesy of Strait Crossing Bridge Inc., time lapse video of one of the traffic monitoring cameras was also recorded. The field of view of this camera is quite large so in 2005 a digital video camera was installed between P23 and P24 to observe ice behaviour on P24 in greater detail.
Figure 3. Ice thickness profile just to west of Bridge (green line).
PEI
NB
P24
P23
Northwest Southeast 200m 100m 100m 250m 1998/99 1999/00 ADCP IPS ADCP ADCP IPS IPSFigure 4. Ice Profiling Sonar and Acoustic Doppler Current Profiler Locations in 1999 and 2000. A summary of all types of data collected during the program is presented in Table 1. The tilt data were recorded in digital format and are archived at NRC-CHC. The ice draft from the IPS, velocities from ADCP and helicopter EM profiling are in digital format, and are archived at BIO.
Table 1. Data collected during the complimentary NRC program.
Year Tilt IPS ADCP Helicopter Bridge Digital scan rate and axis EM profiling Video Video 1999 1 Hz scan 20 s average; X and Y 1 1 yes -- --2000 1 Hz scan 20 s average; X and Y 2 2 yes yes --2001 1 Hz scan 20 s average; X and Y 1 1 yes yes --2002 1 Hz scan 20 s average; X and Y 1 1 yes yes --2003 1 Hz scan 1 s record; Y only 1 1 yes yes --2004 1 Hz scan 1 s record; Y only -- -- yes yes --2005 1 Hz scan 1 s record; Y only -- -- yes yes yes 2006 1 Hz scan 1 s record; Y only -- -- yes yes yes 2007 1 Hz scan 1 s record; Y only -- -- yes yes yes
3. Interpretation of Tiltmeter Results
Tiltmeters offer a relatively simple and inexpensive means of determining global ice forces by measuring the tilt response of a structure. The key to doing this is calibrating the tilt of the structure against a known force, since the amount of tilt is a function of the foundation stiffness as well as the stiffness of the structure. The Applied Geomechanics tiltmeter works on the bubble level principle, using a conductive fluid in a glass tube. A change in tilt produces a change in conductivity. The instrument is referenced to gravity, so, the instrument senses both changes in tilt and horizontal accelerations. The instrument has two single-pole RC low-pass filters that are switch selectable. With the filter switch off the time constant is 0.05 s and with the switch on the time constant is 7.5 s. The time constant is one third of the time it takes the output signal to settle to 90% of its final value, in response to a step change in tilt. The dynamic response of the tiltmeter and its sensitivity to lateral accelerations was recognized when the Applied Geomechanics tiltmeters were procured for the NSERC program. A simulator was constructed at NRC and a series of calibration tests were conducted which indicated for frequencies up to 1 Hz the response of the tilt meter was within ± 20% of the actual tilt. In 2002 an opportunity was presented to apply the tiltmeters to the Norströmsgrund lighthouse in the Gulf of Bothnia and compare forces derived from tilts with directly measured forces. The conclusion of those measurements was that the tiltmeter response was satisfactory for ice loading frequencies of up to 0.5 Hz (Frederking, 2005). There are three factors which are needed to correct the measured tilt to an ice force; (i) a calibration factor to relate the tilt to force, (ii) a baseline correction to establish tilt values for no load, and (iii) a correction for the tilt induced by wind action.
3.1. Calibration
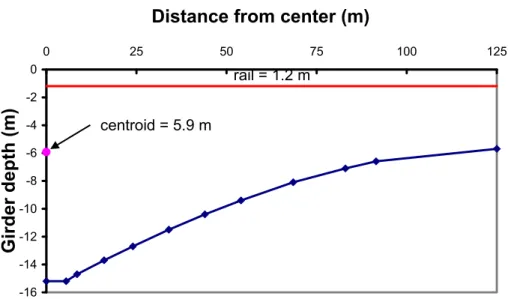
To convert the measured tilts to forces requires a knowledge of the stiffness of the foundation material underlying the pier bases. In the case of pier P31, an actual calibration test was done using an icebreaker to pull on the pier with a known force (Bruce et al, 2001). It was not possible to do such calibrations at P23 and P24. An alternative approach was to use the wind force as a means of determining foundation stiffness. Because of the long spans of the bridge the girder is necessarily deep, presenting a large area of the bridge girder to wind action. The girder is 14 m deep at the pier and reduces to a depth of 4.5 m at mid span (see Figure 5).
Estimating the guard rail to be 1.2 m high, the cross sectional area of the girder plus rail is calculated to be 2340 m2. Wind force is given by the following equation
[1] Fw = A CDρa V2/2
where A = cross-sectional area, CD = drag coefficient (assumed = 1), ρa = density of air (1.3 kg/m
3 ) and
-16 -14 -12 -10 -8 -6 -4 -2 0 0 25 50 75 100 125
Distance from center (m)
Girder depth (m)
centroid = 5.9 m
rail = 1.2 m
Figure 5. Girder Cross Section.
The wind force acts on the centroid of the girder area (9.3 m above the base of the girder) producing a lateral force and moment on the top of the pier, causing the pier shaft and pier base to bend, as well as tilting of the pier on the foundation. The relative bending of the pier shaft and base and tilt about the foundation is a function of the length and diameter of the shaft and base. These relative tilts can be calculated, knowing the dimensions of the piers. The complexity of that calculation, however, is beyond the scope of this paper. As a first order approximation, the amount of tilt measured at the lower tiltmeter will be taken to be a function of the moment applied to the pier.
[2] θlower = k M
where k is calibration factor and M is the moment about the base of the pier from wind and ice actions. For the case of only wind acting on the pier
[3] M = H Fw
where H is the distance from the pier base to the point of wind load application and Fwis the wind load as determined from Equation [1]. A wind loading event with no ice loading on piers P23 and P24 can be used to determine the calibration factor, k, for each pier. For the case of only ice acting on the pier, moment M
is a function of the ice force, Fi, and its moment arm, a (distance from pier base to waterline). Substituting the moment due to ice action into Equation [2] the ice force is given by the following expression
[4] FI = θlower / k a
A wind loading event on March 16, 2000 was used to obtain a calibration of pier foundation stiffness. Figure 6 is a plot of the normal wind velocity (m/s) and the tilt measured by the lower tiltmeters on piers P23 and P24. Note that the tilt of P24 is about twice that of P23, indicating the foundation under P23 is much stiffer.
-35 -30 -25 -20 -15 -10 -5 0 5 21:00 21:05 21:10 21:15 21:20 21:25 21:30 21:35 21:40
Time, March 16, 2000 ( UTC, hr:min)
Tilt (
μ
Rad)
-14 -12 -10 -8 -6 -4 -2 0Wind Velocity (m/s)
P23 - Bottom Y P24 - Bottom Y Wind normal to bridge alignmentFigure 6. Wind Velocity and Tilt measured at the Bottom of Piers P23 and P24.
The average maximum wind speed during the event is taken to be 12 m/s and when substituted into Equation [1] gives a force of 0.22 MN. The corresponding average tilts on piers P23 and P24 are 16 and 30 μrad, respectively. Taking into account level of wind action, H, and level of ice load action, a, factors for converting measured tilts at the lower level to ice force can be determined, as presented in Table 2.
Table 2. Calibration factors for converting ice induced pier tilt to ice force
tiltwind a H k, 1/(k a), [μrad] [m] [m] [μrad /MN-m] [MN/μrad]
P23 16 24.3 73.4 1 0.04
P24 30 26.5 70.4 1.9 0.02
Pier
Cheung et al (1997) indicated that an approximate calibration factor for converting tilts measured at the lower level for piers P31 and P32 was 0.03 MN/μrad, which is in a general agreement with calibration factors derived for P23 and P24.
3.2. Baseline correction
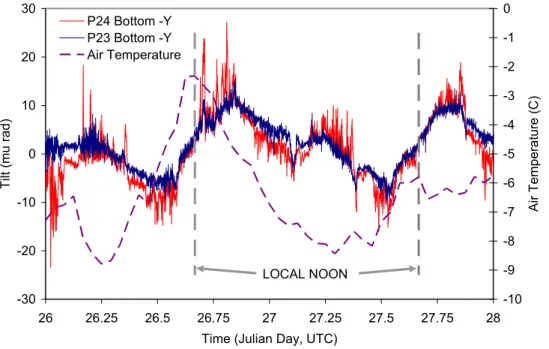
Establishing a baseline is another requirement for interpreting ice loading since a tilt change is the actual response to ice loading, or wind for that matter. To illustrate this, a time record of tilt measured at the lower levels of P23 and P24 over two days in 2001 (January 26 and 27) has been plotted in Figure 7, together with air temperature. The time basis for the plots is UTC so local noon ( 4 hours later) has been indicated on the plots. Note that the plots have been zero adjusted to the start of the record period. The trend in tilts from both instruments is comparable, suggesting they are responding to some common external factor. Air temperature is common to both piers but it does not seem to be the primary cause of the changes. It is most likely solar radiation. It would act on the piers for about 5 hours to either side of local noon. Wind was also examined, but the wind velocity component normal to the bridge was always less than 4 m/s, and as will be pointed out in the next section, that magnitude of wind would cause about a 4 μrad variation. The other factor that could influence baseline tilt would be tidal current, however the current velocity is relatively low, less than 1 m/s, which would produce a tilt of 1 to 2 μrad and it would show two reversals per day. Thus it can be seen that a baseline shift of up to ±10 μrad over a day could be expected due to solar radiation. When examined over the whole 2001 season, P23 remained stable within this band,
however P24, while fluctuating within this band, had a long term drift of about 20 μrad from the beginning of January to early April.
-30 -20 -10 0 10 20 30 26 26.25 26.5 26.75 27 27.25 27.5 27.75 28
Time (Julian Day, UTC)
Ti lt (mu ra d) -10 -9 -8 -7 -6 -5 -4 -3 -2 -1 0 A ir T em pe rat ur e ( C ) P24 Bottom -Y P23 Bottom -Y Air Temperature LOCAL NOON
Figure 7. Tilt of P23 and P24 at lower level in January 2001.
3.3. Correction for wind-induced tilt
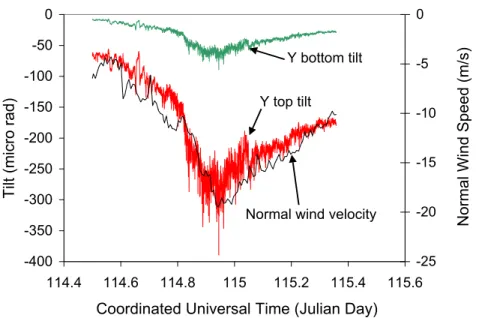
Both wind and ice loading can cause the pier to tilt. If only ice loading is acting on the pier, the Y-axis tilt measured at the lower level is a function of rotation of the pier on its foundation and bending of the lower pier shaft. In the case of no wind loading, the tilt at the upper level should be the same as at the lower level. It was observed that wind had a significant effect on the measured tilt. This is not surprising, given the large depth and length of the girder. The centre of action of the wind is some distance above the top of the pier shaft, as shown in Figure 5. The pier shaft above the ice shield was relatively slender, compared to the cross-section of the pier below the ice shield. Thus when only wind loading was acting on the pier, Y-axis tilt at the upper level would be significantly larger than tilt at the level just above the water line. To illustrate this point, Y-axis tilt at two levels of pier P23 plus wind velocity normal to the Bridge is plotted in Figure 8. Tilt at the upper level is about 5 times greater than at the lower level. The lower tilt increased by about 50 μrad for a wind velocity of 20 m/s and the upper tilt about 250 μrad.
-400 -350 -300 -250 -200 -150 -100 -50 0 114.4 114.6 114.8 115 115.2 115.4 115.6 Coordinated Universal Time (Julian Day)
Tilt (micro rad)
-25 -20 -15 -10 -5 0
Normal Wind Speed (m/s)
Y bottom tilt
Y top tilt
Normal wind velocity
Figure 8. Tiltmeter output of wind loading only at the upper and lower level of pier P23, 1999. Therefore wind effect had to be accounted for in order to identify the part of the pier response due to ice loading alone. The wind correction was based on selecting a period with no ice present so as to determine the pier response to wind effect alone. Reviewing wind data and pier tilt, a period starting at 12:00 UTC on Julian day 114 (April 24, 1999) was identified. Based on Equation [1] drag forces, due to wind may be assumed to be proportional to the velocity squared. The measured wind tilt change from the lower tiltmeter of pier P23 was smoothed and then plotted against the square of the normal component of velocity, Figure 9. y = -0.1489x - 9.6753 R2 = 0.8773 y = -0.1918x R2 = 0.7777 -70 -60 -50 -40 -30 -20 -10 0 0 100 200 300 400
Normal velocity squared (m/s)²
Smoothed tilt change (µ rad)
start end
load
unload
Figure 9. Wind tilt change plotted against normal component of velocity squared, pier P23, 1999. It can be seen that there is a general linear trend. The regression line in Figure 9 was forced to intercept the origin since tilt should be zero for zero wind velocity. The slope of this curve yields a coefficient C which relates pier tilt (Tw) to velocity squared (V²),
[5] Tw = C V² .
For the lower tiltmeter on pier P23 the value of C was 0.19 μrad/(m/s)2, where Tw is in units of µ rad and V is velocity normal to the Bridge in m/s. In a similar manner correction factor for wind tilt effects for the
lower tiltmeter at pier P24 gave a value of 0.30 μrad/(m/s)2 for C. These correction factors were used to determine corrected values for tilt, which reflected response only to ice effects. One of the shortcomings for measurements at P23 and P24 was that wind velocity measurements by PWGSC were only recorded at 10-minute intervals.
The approach for correcting for wind assumed a simple linear relation between tilt and velocity squared. A much more thorough analysis of wind effects was carried out by Luu et al. (2003) who suggested that a nonlinear relation provided a better description of the slope of the wind tilt versus velocity squared. For P23 in 2001 they found 0.18 μrad/(m/s)2 for velocity 0 to 6 m/s, 0.16 μrad/(m/s)2 for velocity 6 to 10 m/s and 0.11 μrad/(m/s)2, for velocities above 10 m/s. The value of 0.18 μrad/(m/s)2 for velocity 0 to 6 m/s, is very similar to the value of 0.19 μrad/(m/s)2 for P23 in the earlier study. These values suggest a softening of the foundation as the wind velocity increases. Thus a step-wise wind velocity correction should be applied.
3.4. Ice loads in 2003
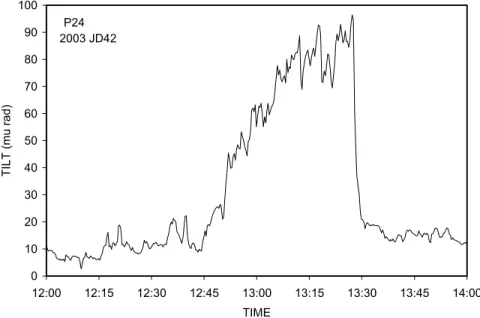
For most years the ice loads which were interpreted from the tilt measurements were low, less than 1 MN (Kubat et al. 2000; Kubat and Frederking, 2001). 2003 was more of a normal winter in terms of number of freezing degree days. During the winter the highest load measured was on February 11 on P24. The time trace of the event is presented in Figure 10. Wind speed was steady at about 10 m/s during the event. Both the upper and lower tiltmeters on P24 gave a very similar output, so wind effect was not a factor. A tilt change of 90 μrad would correspond to a force of 1.8 MN. Visual observations during a helicopter borne survey on February 12 indicated pack ice with ridges up to 4 m thick on average in the Strait. Thus ice was present which could generate such a load. At the beginning of April, 2003 a large floe of land-fast ice that had recently come out of Egmont Bay impacted the bridge and generated forces of 1.8 MN on P23 and 2.4 MN on P24 (Frederking et al. 2006). These are the highest ice forces that have been measured on Piers P23 and P24 of the Bridge.
0 10 20 30 40 50 60 70 80 90 100 12:00 12:15 12:30 12:45 13:00 13:15 13:30 13:45 14:00 TIME TILT ( m u r ad) P24 2003 JD42
Figure 10. Ice loading event on February 11, 2003; pier P24.
4. Pack Ice Pressures
Pack ice pressure events were identified where the bridge piers experienced ice loading while the ice cover was not moving. Two such events that occurred on March 11, 1999 (Julian Day 70.0 to 70.5) have been selected for illustration. Figure 11 presents the tilts measured at the lower level of piers P23 and P24. Note that these tilt values have been corrected for wind effects. The tilt record for pier P23 shows two events noted on Figure 11 where the pier tilt (ice load) increases, remains relatively stable for some time
and then decreases. During these events the ice was relatively stationary. Events #1 and #2 on P23, of duration about 1 and 2 hours, respectively, are representative of pack ice pressure event.
-40 -35 -30 -25 -20 -15 -10 -5 0 70 70.1 70.2 70.3 70.4 70.5
Julian Day
Tilt of Bottom Y (µ rad)
0 1 2 3 4 5 6 7 8
Normal Wind Velocity (m/s)
Wind Event #1 Event #2 Pier 23 Pier 24 A B C D E F D H I
Figure 11. Ice loading events on piers P23 and P24.
The trajectory of ice movement around pier P23 is shown in Figure 12 starting at JD 70.0. This plot is constructed from half-hourly average ice velocity measurements made with the ADCP. The x-axis in Figure 12 is parallel to the alignment of the Bridge. The plot showed that the ice moved to the northwest until JD 70.07 when it stopped and changed direction to the southeast. At JD 70.16, the direction of ice movement changed to east and continued until JD 70.28 when it stopped. At JD 70.30 it started moving towards the west. These ice movements are the result of mean tidal current and wind acting on the ice.
-500 0 500 1000 1500 2000 2500 3000 3500 4000 4500 -4500 -4000 -3500 -3000 -2500 -2000 -1500 -1000 -500 0 500 Southeast (m) Southwest (m) P23 P24 North Start, JD 70.0 Stopped, JD 70.07 Stopped, JD 70.28 End, JD 70.5
The upper part of Figure 13 plots current, ice, and wind velocity vectors before, during, and after these two events. The length of the arrows is representative of the magnitude and the orientation, the direction with respect to the alignment of the Bridge. This figure also indicates the two time periods when pier P23 was considered to respond to pack ice pressure, as already mentioned. The ice drift is influenced by both wind and current forces. These forces are derived from the drag equation where shear stress (τ) is proportional to the density (ρ) times velocity squared (V²) times the drag coefficient (Cd),
[6]
τ
=
ρ
C
dV
2/
2
.The current drag is higher as a result of higher water density (ρw= 1000 kg/m
3
) compared to density of air (ρa= 1.29 kg/m
3
), and a higher water drag coefficient (25 x10-3) than air drag coefficient (2 x10⁻³). In fact, the wind velocity would have to be about 30 times higher than current velocity to have a comparable influence on ice drift, which is possible at times.
Ic e 6 0 c m /s W in d 1 5 m /s 7 0 .0 7 0 .1 7 0 .2 7 0 .3 7 0 .4 7 0 .5 C u rre n t 6 0 c m /s 0 1 0 2 0 3 0 4 0 5 0 6 0 7 0 7 0 7 0 . 1 7 0 . 2 7 0 . 3 7 0 . 4 7 0 . 5 J u l i a n D a y 0 2 4 6 8 1 0 1 2 1 4 C u r r e n t I c e W i n d E v e n t # 1 E v e n t # 2
Figure 13. Current, ice, and wind velocity vectors and magnitude of speed, 1999.
The magnitude of the ice, wind, and current speed is shown more clearly in the lower part of Figure 13. The average wind speed during Event #1 is 6 m/s, the current speed decreases from 0.33 m/s to 0.17 m/s. Using Equation [6] wind shear and current shear are calculated. Their values are 0.046 N/m2 for the wind shear and 0.95 N/m2 for the current shear, assuming a mean current of 0.275 m/s. The shear components are then used to determine the shear resultant, which is 0.94 N/m2 and acts towards the southeast, normal to the axis of the Bridge. The force generated by shear components and the reaction force from the pier cause pack ice pressure in the ice on the upstream side (northwest side). The forces acting on the ice and pier P23 for Event #1 are shown in the left-hand side of Figure 14. The average magnitude of the force on P23 is 240 kN (6 µ rad tilt change), and when distributed over a span of 250 m gives pack ice pressure of 960 N/m immediately upstream of the pier. This pack ice pressure is due to the presence of the Bridge. The spatial relation between pack ice pressure due to the Bridge (Pi), force on the Bridge (Fi), and resultant of current and wind shear (τres) is given by the following equation,
[7]
P
F
i resL
i
(
)
250
+
τ
=
where L in Equation [7] is the distance upstream over which the resultant shear is assumed to act. Note that the sign on the resultant shear depends on whether it acts in the same direction as Fi. From Equation
[7] it can be seen that the pack ice pressure (Pi) varies linearly with L. For Event #1, Equation [7] indicates that the pack ice pressure due to the Bridge decreased from 960 N/m close to the Bridge to zero at a distance about 1 km upstream of the Bridge. Note that this assumes the pack ice pressure is generated over a span of 250 m. If a smaller width were chosen, the pressure would be higher close to the Bridge and extend further away form the Bridge. If the span of action was reduced to 25 m the maximum pack ice pressure close to the Bridge would be increased from 1 kN/m to 10 kN/m.
P23 P24 Current = 0.275 m/s Ice drift = 0.075 m/s Wind = 5.9 m/s
Event #1
JulDay 70.2 P23 P24 Current = 0.2 m/s Ice drift = 0.52 m/s Wind = 8 m/sEvent #2
JulDay 70.37Figure 14. Forces acting on P23 during Event #1 and Event #2, 1999
The average wind speed during Event #2 is 8 m/s, the current speed increases from 0.12 m/s to 0.27 m/s. Equation [6] was again used to calculate wind shear and current shear, and their resultant was determined. The values are 0.10 N/m2, 0.5 N/m2, and 0.51 N/m2, respectively. The wind shear and current shear act at right angles to each other, but the resultant is normal to the bridge axis, to the northwest. The ice was observed to move mostly parallel to the alignment of the Bridge, towards the southwest (see Figures 13 and 14). Note that the ADCP that was used to measure ice drift was located 400 m northwest of pier P23 and was therefore in the lee of the pier. The ice drift velocity in this case was high, ∼ 0.5 m/s, and in a similar direction to the wind. The resultant shear generated a force on the pier from the southeast side, which caused a maximum tilt during this event of 5 µ rad, equivalent to 200 kN. Note from Figure 11, and the right-hand side of Figure 14, that the direction of the force has changed to correspond to the reversal in the tidal current direction. For Event #2 the equivalent pack ice pressure was 800 N/m near the Bridge. From measurement with the IPS, the average ice thickness during these events was about 0.6 m, and the maximum keel depth was about 5 m.
Anecdotal information (Barb O’Connell, personal communication) indicated that in the winter of 2003 a Canadian Coast Guard ship encountered difficulty passing through the navigation span due to pressure in the ice. This confirms that the concern about Bridge induced ice pressure affecting winter navigation was realized in at least one occasion.
Another affect of the Bridge pointed out by Peterson et al. (1998) was that the Bridge provides an additional obstruction in the already narrowest point of the Northumberland Strait, causing a higher concentration of ice to the west or upstream of the Bridge than there would be otherwise. On the other hand it results in a lower concentration of ice to the east of the Bridge. This enhances ice melt in spring as there is more open water and smaller floes due to the piers breaking up the ice. Radiant heat enters the water and accelerates the melt. Overall it is possible that the Bridge has advanced the end of the ice season in the Strait, however interannual variability is so large that this change is difficult to quantify.
5. Lessons Learned
Following are some of the lessons learned
• The Applied Geomechanics tiltmeters have proven to be reliable instruments for measuring the tilt response of the two piers adjacent to the navigation span. The response characteristics of the tiltmeters are such that they are most suitable for static or quasi-static ice loads – load periods of 2 s and longer.
• A simple low-cost battery-powered data acquisition system has performed well in recording tilt data over a winter season.
• Wind loading on the girder has provided a means of calibrating the foundation stiffness and hence converting measured tilt to ice force. The accuracy of this calibration factor is about ± 30%.
• Establishing a baseline of tilt is necessary in order to establish the magnitude of ice forces. This proved to be difficult to do on any sort of automated basis. Visual review of the tilt records proved to be the only reliable manner to verify baselines.
• Wind induced tilt on the piers is significant, particularly for P23 and P24 which are taller because of their proximity to the navigation span. Calibration of wind induced tilt demonstrated a non-linear relation between tilt and velocity squared.
• Ice loading on piers 23 and P24 has been surprisingly low; the highest load measured being 2.4 MN on April 4, 2003.
• The presence of the Bridge has marginally increased the amount of ice west (upstream) of the Bridge, but may have shortened the ice season.
• On at least one occasion in the past 10 years pressured ice has been an impediment to ships transiting through the navigation span of the Bridge.
• Interpretation of ice loading and pack ice pressure events is greatly aided by video records.
6. Acknowledgements
Interaction with Tom Brown, leader of the ice force measurement portion of the NSERC program, has been most valuable. The assistance of Murray Scotney of the Bedford Institute of Oceanography for the recovery of tilt data from the bridge is greatly appreciated. The collaboration of Strait Crossing Bridge Inc. over the years in making copies of traffic video to monitor ice presence is gratefully acknowledged. The support of the Public Works and Government Services Canada in making available meteorological data is gratefully acknowledged. Funding support from the Program of Energy Research and Development facilitated this work
7. References
Belliveau, D.J., Hayden, H., and Prinsenberg, S. 2001. Ice Drift and Draft Measurement from Moorings at the Confederation Bridge, Proceeding of the 16th International Conference on Port and Ocean Polar Engineering under Arctic Conditions, Ottawa, Ontario, August 12-17, Vol. 1, 349-358.
Brown, T.G., G. Barry, T. Carstens, K.R. Croasdale and R.M.W. Frederking. 1994. The Potential Influences of the Prince Edward Island Bridge on the Ice Environment. Proceedings of the 12th IAHR International Symposium on Ice, August 23-26, 1994, Trondheim, Norway, pp. 838-846.
Brown, T.G. 2001. Four Years of Ice Force Observation on the Confederation Bridge, Proceeding of the
16th International Conference on Port and Ocean Polar Engineering under Arctic Conditions, Ottawa,
Ontario, August 12-17, Vol. 1, 285-298.
Bruce J.R., and Brown, T.G. 2001. Operating an Ice Force Monitoring System on the Confederation Bridge, Proceedings of the 16th International Conference on Port and Ocean Polar Engineering under Arctic Conditions, Ottawa, Ontario, August 12-17, Vol. 1, 299-308.
Cheung, M.S., Tadros, G.S., Brown, T., Dilger, W.H., Ghali, A. and Lau, D.T. 1997. Field monitoring and research on performance of the Confederation Bridge, Canadian Journal of Civil Engineering, NRC, 24: 951-962.
Frederking, R. 2005. Tiltmeter Application at Norströmsgrund Lighthouse - STRICE Project, Proceeding of
the 18th International Conference on Port and Ocean Polar Engineering under Arctic Conditions, Potsdam,
Frederking, R. Kubat, I and Prinsenberg, S. 2006. Response of two piers on Confederation Bridge to Ice Loading Event of April 4, 2003, Proceedings 18th International Symposium on Ice, IAHR’06, Sapporo, Japan, August 28-September 1, 2006, Vol. 1, pp 231-238.
Kubat, I., Frederking R., and Hayakawa, T. 2000. Response of the Confederation Bridge to Ice Action, CSCE 2000 Conference, London, Ontario, Canada, June 7-10, 2000, 434-441.
Kubat, I. and Frederking R. 2001. Response of Confederation Bridge to Ice Forces: 2000 Winter Season, Proceedings of the 16th International Conference on Port and Ocean Polar Engineering under Arctic Conditions, Ottawa, Ontario, August 12-17, Vol. 1, 319-328.
Luu, T., Lau, D.T. and Frederking, R., 2003, Wind Tilt Response of the Confederation Bridge and its Influence on its Ice Tilt Behaviour, Proceedings of International Conference on Response of Structures to Extreme Loading 2003, Toronto, Canada, August 3-6, 2003, 10p.
Peterson, I.K., Prinsenberg, S.J. and Maillet, A. 1998. 1997 Pack ice properties in Northumberland Strait,
Proceedings of the 8th (1998) International Offshore and Polar Engineering Conference, Montreal,
Quebec, Canada, Vol. 2, 513-518.
Prinsenberg, S. and Peterson, I.K. 2001. Pack Ice Thickness and Concentration Measurements from the Area around the Confederation Bridge (Canada) Using Helicopter-Borne Sensors, Proceeding of the 16th International Conference on Port and Ocean Polar Engineering under Arctic Conditions, Ottawa, Ontario, August 12-17, Vol. 1, 339-348.