Annual Surveillance Report 2017 HIV, viral hepatitis and sexually transmissible infections in Australia
0246810 02468
10
02
46810 02
46
810
024
6810
0
2
4
6
8
10 0246
8
10 0
24
6
810 02468 10
02468
10
0246810
0246810
0246810
0246810 0246810 0
2
4
6
8
10 024
68
10 0
2
4
6
8
10
0 2 4 6 8 10
0 2 4 6 8 10
0 2
4 6
8 10
0 2
4 6
8 10
0 2 4 6 8 10
0 2 4 6 8
10 0
2
4
6
8
10 0
2
4
6
8
10 0 2 4 6 8 10
02
46
810
0 2 4 6 8 10
0 2 4 6 8 10
0 2 4 6 8 10
2016201520142013201220112010
200920082007
2016201520142013201220112010 200920082007
2016
20152014
2013
20122011 20102009
2008
2007
2016
201520142013201220112010
200920082007 20162015
2014
20132012
2011
20102009
2008
2007
2016
2015 201420132012201120102009
2008 2007 2016201520142013
2012
20112010200920082007
2016 2015
2014
2013
2012
2011 2010
2009
2008
2007
2016 2015 2014 2013 2012 2011 2010 2009 2008 2007
2016 2015 2014 2013 2012 2011 2010 2009 2008 2007
2016
2015
2014
2013
2012
2011 2010 2009 2008 2007
2016201520142013201220112010200920082007
2016 2015
2014 2013
2012 2011
2010 2009
2008 2007
2016 2015
2014 2013
2012 2011
2010 2009
2008 2007 2016
2015 2014
2013 2012
2011 2010
2009 2008
2007 2016
2015 2014
2013 2012
2011 2010
2009 2008
2007 2016201520142013201220112010200920082007
2016
2015
2014
2013
2012
2011
2010
2009
2008
2007
2016 2015 2014 2013 2012 2011 2010 2009 2008 2007
2015 2016 2013 2014 2011 2012 2009 2010 2007 2008
2016 2015 2014 2013 2012 2011 2010 2009 2008 2007
2016 2015 2014 2013 2012 2011 2010 2009 2008 2007
2016201520142013201220112010200920082007 2016
2015 2014
2013 2012
2011 2010
2009 2008
2007
2016 2015
2014 2013
2012 2011
2010 2009
2008 2007 2016
2015 2014
2013 2012
2011 2010
2009 2008
2007 2016
2015
2014
2013
2012
2011
2010
2009
2008
2007 2016
2015
2014
2013
2012
2011
2010
2009
2008
2007
2016
2015
2014
2013
2012
2011
2010
2009
2008
2007
2016 2015 2014 2013 2012 2011 2010 2009 2008 2007
2016 2015
2014 2013
2012 2011
2010 2009
2008 2007
© The Kirby Institute for infection and immunity in society 2017
ISSN 2206–1630 (Online)
This publication and associated data are available at internet address kirby.unsw.edu.au Suggested citation:
Kirby Institute. HIV, viral hepatitis and sexually transmissible infections in Australia:
annual surveillance report 2017. Sydney: Kirby Institute, UNSW Sydney; 2017.
Copy editor Juliet Richters, www.julietrichters.com.au Design il Razzo, Email: admin@ilrazzo.com.au The Kirby Institute for infection and immunity in society UNSW Sydney, Sydney, NSW 2052
Telephone: 02 9385 0900 (International +61 2 9385 0900)
Email: recpt@kirby.unsw.edu.au
HIV, viral hepatitis and sexually transmissible infections in Australia Annual Surveillance Report 2017
The Kirby Institute
Prepared by:
Muhammad Shahid Jamil Praveena Gunaratnam Hamish McManus Richard Gray Rebecca Guy Other contributors:
• Office of Health Protection, Australian Government Department of Health
• State/territory health departments
• Aditi Dey, Frank Beard, National Centre for Immunisation Research and Surveillance
• Amy Kwon, Angie Pinto, Denton Callander, Gregory Dore, Jana Sisnowski, Jane Costello, Jennifer Iversen, Kate Whitford, Melanie Simpson, Rainer Puhr, The Kirby Institute, UNSW Sydney
• Benjamin Cowie, Jennifer MacLachlan, WHO Collaborating Centre for Viral Hepatitis, Victorian Infectious Diseases Reference Laboratory, The Doherty Institute
• Campbell Aitken, Clarissa Moreira, Jason Asselin, Margaret Hellard, Burnet Institute
• Chris Estes, Homie Razavi, Center for Disease Analysis
• Glenda Balderson, Australia and New Zealand Liver Transplant Registry
• Julia Brotherton, Lisette Bicknell, National HPV Vaccination Program Register
• Karen Chronister, Phillip Read, Kirketon Road Centre
• Limin Mao, Centre for Social Research in Health, UNSW Sydney
• Monica Lahra, WHO Neisseria Reference Laboratory
in collaboration with networks in surveillance for HIV, viral hepatitis and sexually transmissible infections
Preface 1 Abbreviations 2 Medical and epidemiological terms 2
Summary data 4
HIV 4
Hepatitis C 6
Hepatitis B 8
Sexually transmissible infections other than HIV 10
1 HIV 14
1.1 New HIV diagnoses 14
1.2 HIV incidence 45
1.3 Number of people living with HIV and prevalence 46
1.4 HIV testing and care 53
1.5 HIV prevention 64
2 Viral hepatitis 68
2.1 Hepatitis C 68
2.2 Hepatitis B 98
3 Sexually transmissible infections
other than HIV 118
3.1 Chlamydia 118
3.2 Gonorrhoea 136
3.3 Syphilis 153
3.4 Comprehensive STI testing 167
3.5 Human papillomavirus infection 169
3.6 Donovanosis 175
Methodology 176 Acknowledgments 191
Contents
HIV
STIs
HCV
HBV
Preface
This report is the 21st annual review of available surveillance data pertaining to the occurrence of HIV, viral hepatitis and sexually transmissible infections in Australia. It is a reference document for organisations and individuals interested in the occurrence of these infectious diseases in Australia, drawing together relevant data from many sources into a single comprehensive report.
The report is available through the website kirby.unsw.edu.au together with the Australian HIV Public Access Dataset, holding records of cases of HIV diagnosed in Australia by 31 December 2016 and reported by 31 March 2017.
The main findings of the report are presented as text, supported by figures. The underlying data are available online in tables at kirby.unsw.edu.au. A methodological summary follows the commentary and figures, along with references to other documents and reports which provide further information.
The accompanying report Bloodborne viral and sexually transmissible infections in Aboriginal and Torres Strait Islander people: Annual Surveillance Report 2017 presents a detailed analysis of the occurrence of bloodborne viral and sexually transmissible infections for use by Aboriginal and Torres Strait Islander health services and communities, among others.
1The report is available at internet address kirby.unsw.edu.au.
Some of the information in this report regarding risk behaviour is also published, along with further behavioural data, in the Annual reports of trends in behaviour,
2prepared by the Centre for Social Research in Health. Other relevant information is also published in the following reports prepared by the Kirby Institute: Australian NSP survey: prevalence of HIV, HCV and injecting and sexual behaviour among NSP attendees national data report 2012–2016
3; Needle syringe program national minimum data collection national data report 2016
4; Australian NSP survey:
prevalence of HIV, HCV and injecting and sexual behaviour among needle and syringe program attendees 20 year national data report 1995–2014
5; and the National prison entrants’ bloodborne virus and risk behaviour survey report 2004, 2007, 2010, and 2013: prevalence of HIV,
hepatitis C, hepatitis B, sexually transmissible infections and risk behaviours among Australian prison entrants.
6Unless specifically stated otherwise, all data provided in the report are to the end of 2016, as reported by 31 March 2017. All data in this report are provisional and subject to future revision.
This report could not have been prepared without the collaboration of a large number of
organisations throughout Australia. The ongoing contribution to national surveillance for
HIV, viral hepatitis and sexually transmissible infections by these organisations, listed in the
Acknowledgments, is gratefully acknowledged.
Abbreviations
ABS Australian Bureau of Statistics
ACCESS Australian Collaboration for Coordinated Enhanced Sentinel Surveillance
AIDS acquired immunodeficiency syndrome BBV bloodborne virus
HBsAg hepatitis B surface antigen HIV human immunodeficiency virus
HPV human papillomavirus PEP post‑exposure prophylaxis PrEP pre‑exposure prophylaxis STI sexually transmissible infection UNAIDS Joint United Nations Programme
on HIV/AIDS
Medical and epidemiological terms
age‑standardised rate of infection: The proportion of infected people in a particular population, adjusted mathematically to account for the age structure of the population so that comparisons can be made between populations with different age structures (i.e. with more or fewer younger people).
AIDS: Acquired immunodeficiency syndrome, the spectrum of conditions caused by damage to the immune system in advanced HIV infection.
area of residence: Locations of residence, indicated by postcode, are classified into one of three categories: major cities, inner or outer regional areas, and remote or very remote areas (i.e. areas with relatively unrestricted, partially restricted and restricted access to goods and services).
bacterium: A type of single‑celled micro‑organism.
Some bacteria cause illness in humans, and most can be treated with antibiotics.
chlamydia: A sexually transmissible infection caused by a bacterium (Chlamydia trachomatis).
The infection causes no symptoms in about 80%
of cases. In people with symptoms, the infection causes inflammation of the urethra (the tube through which urine passes out of the body), leading to some pain and penile discharge in men, and to painful urination and bleeding between menstrual periods in women. Complications of chlamydia can be serious for women, including pelvic inflammatory disease, ectopic pregnancy and infertility. Throat and anal infections do not usually cause symptoms.
Chlamydia is curable by antibiotics.
congenital: An infection or other condition existing since the person’s birth. Congenital conditions are not necessarily genetically inherited; some are infections that are transmitted between mother and fetus or newborn.
diagnosis: A labelling or categorisation of a condition, usually by a doctor or other healthcare professional, on the basis of testing, observable signs and symptoms reported by the patient.
‘Newly diagnosed infection’ means that a person previously not known to have the infection has been tested and now found to have the infection.
donovanosis: A sexually transmissible infection caused by a bacterium, Klebsiella (or Calymmatobacterium) granulomatis. The most common symptom is the presence of one or more painless ulcers or lesions in the genital or anal regions. If not treated, the ulcers or lesions can progress and become complicated by other bacterial infections, ultimately resulting in damage to the affected part of the body. Donovanosis is curable by antibiotics. Donovanosis was once common in central and northern Australia, and is now very rare.
endemic: A disease is endemic if it is common in a region or local area, or in a group of people gonorrhoea: A sexually transmissible infection caused by a bacterium (Neisseria gonorrhoeae).
Gonorrhoea has no symptoms in about 80% of women and 50% of men. Symptoms are similar to those of chlamydia, as are the complications.
Most men with urethral gonorrhoea will eventually develop symptoms. Throat and anal infections do not usually cause symptoms. Gonorrhoea can be cured with antibiotics.
hepatitis B virus infection: A viral infection transmissible by blood and sexual contact, from mother to child at birth, and in institutional settings.
Most healthy adults will not have any symptoms
and are able to get rid of the virus without any
problems. Some adults are unable to get rid of the
virus, leading to chronic infection. The focus of
this report is chronic hepatitis B infection. ‘Newly
diagnosed’ hepatitis B infection means that a
person previously not known to have the infection has been tested and now found to have the infection. ‘Newly acquired’ infections are those that have been acquired within the past two years.
hepatitis C virus infection: A viral infection transmissible by blood contact as well as from mother to newborn. Most healthy adults will not have any symptoms and are able to get rid of the virus without any problems. Some adults are unable to get rid of the virus, leading to chronic infection. The focus of this report is chronic hepatitis C infection.
‘Newly diagnosed’ hepatitis C infection means that a person previously not known to have the infection has been tested and now found to have the infection. ‘Newly acquired’ infections are those that have been acquired within the past two years.
human immunodeficiency virus (HIV) infection:
HIV is transmissible by sexual and blood contact as well as from mother to child. If untreated, HIV infection can progress to AIDS. ‘Newly diagnosed’
HIV infection means that a person previously not known to have the infection has been tested and now found to have the infection. ‘Newly acquired’
HIV infection means the person has become infected within the past year. Primary HIV infection (or seroconversion illness) is a flu‑like illness soon after infection with HIV.
human papillomavirus (HPV) infection: Of over 140 types of HPV that infect humans, about 40 affect the anal and genital area, mostly without causing any disease. This subset of HPV types is sexually transmissible and is occasionally transmitted from mother to child. Two HPV types (6 and 11) cause most genital warts. Two other HPV types (16 and 18) cause most cervical and anal cancers, and an increasing proportion of mouth and throat cancers.
Many less common HPV types also occasionally cause cancers. Most people acquire at least one genital HPV infection through their lives, but the great majority clear the infection.
incidence: The rate at which a condition occurs in a population, usually expressed as the number of diagnoses (or pregnancies, injuries etc.) over a period of time during which people are exposed to risk (see person‑years).
infection: The condition of having bacteria or viruses multiplying in the body. Many infections
cause no symptoms, so the person may be unaware they have an infection unless they are tested.
notifiable disease: A disease is notifiable if doctors and/or laboratories are required to report cases to the authorities for disease surveillance, i.e.
monitoring of disease at population level.
person‑years: A measure of the incidence of a condition (e.g. a disease or pregnancy) over variable time periods. If 100 people are exposed to the risk of an infection for a year, or 50 people are exposed for two years, the number of infections can be reported ‘per 100 person‑years’.
prevalence: The number of cases of a condition at a single time, usually expressed as a proportion (percentage, or per 100 000 people) of the population. Prevalence decreases if people with the condition die or are cured, and increases as new cases occur.
symptom: A physical or mental indication of a disease or condition experienced by the patient.
syphilis, infectious: An infection caused by the bacterium Treponema pallidum. It is transmissible by sexual contact as well as from mother to child.
Congenital syphilis occurs when the fetus is infected during pregnancy. Infectious syphilis is defined as infection of less than two years’ duration. The main symptoms include a painless ulcer at the site of infection within the first few weeks of infection, followed by other symptoms (e.g. rash) a couple of months later. Often symptoms are not detected.
In the absence of treatment, there will then be a period of several years without any symptoms, with a chance of a range of complications over decades that can involve the skin, bone, central nervous system and cardiovascular system. Infectious syphilis is fully curable with a single injection of long‑acting penicillin.
virus: A very small microscopic infectious agent that multiplies inside living cells. Antibiotics are not effective against viral infections, so treatment requires antiviral drugs.
For more information on sexually transmissible
infections see the Australian STI management
guidelines for use in primary care.
7Summary data
HIV
New HIV diagnoses
• The number of new HIV diagnoses in Australia has remained stable over the past five years, with 1066 diagnoses in 2012, 1030 in 2013, 1084 in 2014, 1027 in 2015, and 1013 in 2016.
• Male‑to‑male sex continues to be the major HIV risk exposure in Australia, reported for 712 (70%) HIV diagnoses in 2016, with heterosexual sex reported for 209 (21%) diagnoses, both male‑to‑male sex and injecting drug use for 51 (5%) diagnoses, and injecting drug use for 14 (1%) diagnoses.
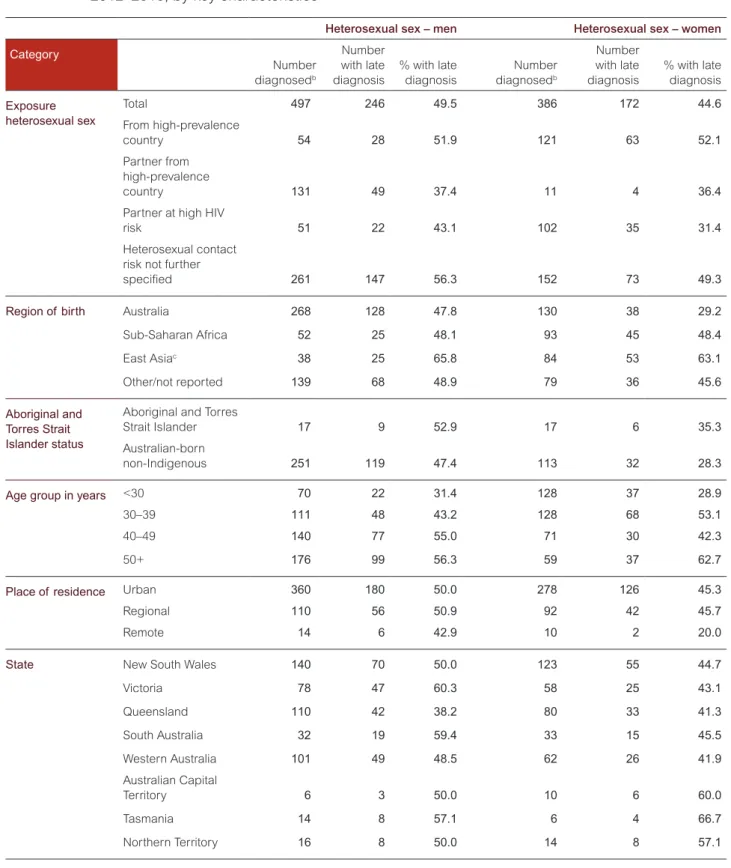
• Of 209 HIV diagnoses in 2016 that were attributed to heterosexual sex, 17% were in people born in a
high‑prevalence country (recognised by UNAIDS as having 1% or higher adult national HIV prevalence), and a further 17% were in people who reported heterosexual contact with a person from a high‑prevalence country.
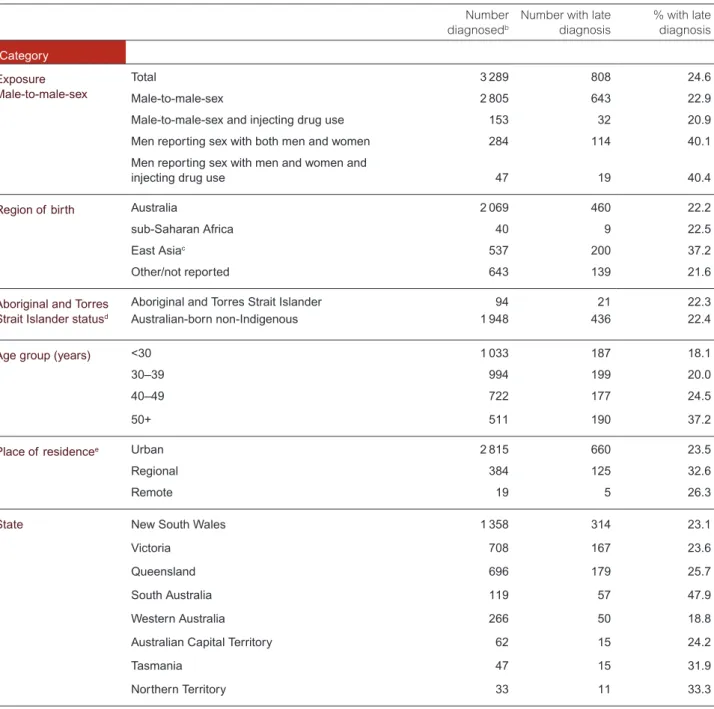
• Based on the test for immune function (CD4+ cell count), a third (33%) of new HIV diagnoses in 2016 were classified as late diagnoses (CD4+ cell count of less than 350 cells/μL). These diagnoses are likely to have been in people who had acquired HIV at least four years before diagnosis without being tested.
• Over the past five years (2012–2016) the proportion with late diagnoses was higher in people born in Central America (45%), sub‑Saharan Africa (43%) and Southeast Asia (43%). The proportion with late diagnoses was also higher in people with heterosexual sex as their HIV risk exposure (47%), men with bisexual sex as their HIV risk exposure (40%), and men aged over 50 years with male‑to‑male sex as their HIV risk exposure (37%).
• In 2016, there were 46 new HIV diagnoses among Aboriginal and Torres Strait Islander people. The age‑standardised rate of HIV notifications among Aboriginal and Torres Strait Islander people increased by 33% from 4.8 per 100 000 in 2012 to 6.4 per 100 000 in 2016, compared to a 22% decline in the Australian‑born non‑Indigenous population; in 2016 the notification rate was 2.2 times as high as in the Australian‑born
non‑Indigenous population (2.9 per 100 000).
• Over the years 2012–2016, a higher proportion of HIV notifications in the Aboriginal and Torres Strait Islander population were attributed to heterosexual sex (20%) and injecting drug use (14%) than in the Australian‑born non‑Indigenous population (15% and 3%, respectively).
• In 2012–2016, among 223 babies born to women with HIV in Australia, 2% of newborns were diagnosed with HIV, compared to 28% in 1992–1996.
HIV incidence
• Among gay and bisexual men attending sexual health clinics in the ACCESS network, HIV incidence over the five years 2012–2016 fluctuated between 0.58 and 0.85 per 100 person‑years (0.85 per 100 person‑years in 2016).
• HIV incidence among female sex workers remained at or below 0.11 per 100 person‑years in the past five years (2012–2016), and was 0.07 per 100 person‑years in 2016.
HIV prevalence
• In 2016 HIV prevalence, or the proportion of all people in Australia who are living with HIV, was 0.13%, which is low compared to other high‑income countries and to countries in the Asia‑Pacific region.
• The self‑reported HIV prevalence among gay and bisexual men participating in the Gay Community Periodic Surveys was 7.3% in 2016.
• HIV prevalence among people who inject drugs attending needle and syringe programs was 1.4% in 2016, and
0.7% if gay and bisexual men are excluded.
Testing and care
• There were an estimated 26 444 people living with HIV in Australia in 2016. Of those, an estimated 23 648 (89%) were diagnosed, 22 465 (95% of those diagnosed) were retained in care (having had a viral load or CD4+ cell count in the past year), 20 440 (86% of those diagnosed) were receiving antiretroviral therapy, and 19 013 (93% of those on antiretroviral therapy) had suppressed viral load (less than 200 HIV‑1 RNA copies/mL). This corresponds to 72% of all people living with HIV having suppressed viral load in 2016.
• There were an estimated 2796 (11%) people living with HIV in Australia in 2016 who were unaware of their HIV status (undiagnosed). Compared to overall, the proportion with undiagnosed HIV was higher in people with heterosexual sex (17%) and injecting drug use (17%) as their HIV risk exposure and lower in men with male‑to‑male sex as their HIV risk exposure (9%). The proportion with undiagnosed HIV was also higher among people born in Southeast Asia (27%), Aboriginal and Torres Strait Islander people (20%) and women (13%).
• Among gay and bisexual men attending sexual health clinics in the ACCESS (Australian Collaboration for Coordinated Enhanced Sentinel Surveillance) network, the proportion who had had a repeat HIV test within six months of a previous test has risen by 35% within the past five years, from 37% in 2012 to 50% in 2016.
• During 2016, pre‑exposure prophylaxis (PrEP) implementation projects commenced in New South Wales, Queensland and Victoria. By the end of 2016, a total of 7266 gay and bisexual men at high risk of HIV were enrolled in PrEP implementation projects in these jurisdictions, which is equivalent to 6% of the estimated number of HIV‑negative gay and bisexual men in Australia.
Sexual behaviour
• In 2016, according to the Gay Community Periodic Surveys, 44% of gay and bisexual men who had casual partners in the past six months reported any condomless anal intercourse with casual partners, an increase from 38% in 2012.
Interpretation:
HIV diagnoses have remained stable in Australia during the past five years, and the epidemic remains concentrated among gay and bisexual men. The initiatives to promote and improve access to testing have led to higher levels of testing coverage and repeat testing among gay and bisexual men. However, some groups are still more likely to be diagnosed late. Treatment coverage among people diagnosed with HIV has increased considerably, with a corresponding increase in the proportion of people on treatment with suppressed viral load, which reduces the risk of onward transmission to zero.
State‑funded programs have provided PrEP to a low proportion of the gay and bisexual men at higher risk of HIV in Australia, with variations in coverage across jurisdictions; it is too early for these programs to have had an impact on HIV transmission nationally.
Consistent condom use with casual partners among gay and bisexual men has been declining over the past five years.
However, this should be viewed in the context of gay and bisexual men using non‑condom‑based strategies to reduce the risk of HIV transmission, such as serosorting, strategic positioning, undetectable (suppressed) viral load and in the past few years PrEP.
Harm reduction strategies to minimise HIV transmission among people who inject drugs have been highly successful and must be sustained. Extremely low rates of HIV transmission from mother to newborn have been observed in Australia, reflecting successful comprehensive medical interventions. The incidence of HIV among women involved in sex work is extremely low, among the lowest in the world, due to highly successful HIV prevention for this priority population which must also be sustained.
The trend in HIV notifications among Aboriginal and Torres Strait Islander people is very different from that in
non‑Indigenous people, with a steady increase in the annual HIV notification rate in Aboriginal and Torres Strait Islander
Hepatitis C
New hepatitis C diagnoses
• In 2016 there were 11 949 new hepatitis C diagnoses. About two‑thirds (67%, 7972) of new hepatitis C diagnoses in 2016 were in males.
• The overall notification rate of hepatitis C in Australia has remained stable between 2012 and 2015, but increased by 12% from 45 per 100 000 in 2015 to 50 per 100 000 in 2016.
• The age‑standardised rate of hepatitis C notification in the Aboriginal and Torres Strait Islander population in the Northern Territory, Queensland, South Australia, Tasmania and Western Australia increased by 25% over the five past years, from 138 per 100 000 in 2012 to 173 per 100 000 in 2016, compared to a stable notification rate in the non‑Indigenous population (43 per 100 000 in 2012 to 45 per 100 000 in 2016). The hepatitis C notification rate in the Aboriginal and Torres Strait Islander population was 3.8 times as high as in the non‑Indigenous population in 2016.
Incidence, prevalence and morbidity
• Among people aged under 25 years (likely to have acquired hepatitis C more recently), the rate of notifications has been stable during the past five years (16 per 100 000 in 2012 to 15 per 100 000 in 2016). The notification rate of newly acquired hepatitis C (evidence of hepatitis C acquisition in the two years prior to diagnosis) also remained stable in this age group during the past five years.
• In Aboriginal and Torres Strait Islander people aged under 25, the rate of hepatitis C notification was 6.3 times as high as in non‑Indigenous people in 2016 (89 vs 14 per 100 000), and increased by 50% from 59 per 100 000 in 2012, compared to a 14% decrease in non‑Indigenous people.
• The prevalence of hepatitis C among people who inject drugs attending needle and syringe programs was 51% in 2016, with stable annual rates (51%–57%) in the past five years (2012–2016).
• Between 2007 and 2015, there was a 61% increase in the estimated number of people living with chronic hepatitis C with severe fibrosis and a 79% increase in the estimated number of people with hepatitis C‑related cirrhosis, but from 2015 to 2016, there was a 10% decline in the number of people living with severe fibrosis (29 162 to 26 270) and a 38% decline in hepatitis C‑related cirrhosis (17 085 to 10 502), representing the first ever declines since 2007.
• The number of people receiving liver transplants due to chronic hepatitis C or hepatitis C‑related hepatocellular carcinoma has remained stable between 2012 (73, 41% of all transplants) and 2016 (73, 31% of all
transplants). The proportion of hepatitis C‑related transplants accounted for by hepatocellular carcinoma has increased from 18% in 2012 to 45% in 2016.
• The estimated number of deaths in people living with chronic hepatitis C increased by 89% from 439 in 2007 to 829 in 2015, then declined by 27% between 2015 and 2016 (605).
Testing and care
• An estimated 30 434 people were cured of hepatitis C in 2016 following the introduction of new direct‑acting antiviral treatment through the Pharmaceutical Benefits Scheme.
• At the start of 2016, there were an estimated 227 306 people living with chronic hepatitis C infection in Australia, reducing to an estimated 199 412 at the end of 2016.
• Of the 199 412 people living with chronic hepatitis C at the end of 2016, an estimated 161 509 (81%) had been diagnosed and 75 909 (47% of those diagnosed) had had a hepatitis C RNA test to confirm their chronic hepatitis C infection.
• Of the estimated 227 306 people living with chronic hepatitis C at the start of 2016, 32 550 (14%) received hepatitis C treatment during 2016 and 30 434 (93% of those treated) were cured during 2016.
• Access to new highly effective hepatitis C treatments led to a 12‑fold increase in the number of people receiving treatment between 2012 and 2016, with the greatest increase occurring between 2015 and 2016 (four fold increase).
• In 2016, a higher proportion of people living with hepatitis C‑related cirrhosis (49%) received treatment than of people with early to moderate fibrosis (10%) and severe fibrosis (17%).
• Among Australian Needle and Syringe Program Survey respondents in 2016 who self‑reported chronic hepatitis C, 22% had received treatment in the past 12 months, representing an 11‑fold increase from 2015, with a similar increase in Aboriginal and Torres Strait Islander respondents. According to the National Prison Entrants’
Bloodborne Virus Survey, 14% of respondents reported ever receiving hepatitis C treatment in 2016, increasing
from 0.6% in 2007, with increases in both males and females.
Injecting risk behaviour
• The reuse of needles and syringes that have been used by others (receptive syringe sharing) is a major risk factor for transmission of hepatitis C. The overall proportion of Australian Needle and Syringe Program Survey respondents who reported receptive syringe sharing in the past year was 19% in 2016. Receptive syringe sharing was higher among Aboriginal and Torres Strait Islander survey respondents (28%) than among non‑Indigenous respondents (17%).
Interpretation:
The increase in the rate of notification of hepatitis C diagnoses between 2015 and 2016, following stable rates between 2012 and 2015, is likely to relate to increased testing in the context of new hepatitis C treatments. The notification rate of newly acquired hepatitis C in people under 25 years has remained stable since 2012, suggesting hepatitis C transmission is stable at the population level. There has also been no decrease in the rates of receptive syringe sharing in the same period, highlighting the need for enhanced focus on prevention efforts.
The number of people receiving hepatitis C treatment increased dramatically in 2016, including among people who inject drugs who participated in the Australian Needle and Syringe Program Survey. This change reflects people accessing new direct‑acting antiviral regimens subsidised by the Pharmaceutical Benefits Scheme from March 2016.
Based on mathematical modelling estimates, the number of people living with hepatitis C who had severe fibrosis and hepatitis C‑related cirrhosis fell for the first time in 10 years, in line with the rise in treatment uptake particularly among people with more advanced liver disease (hepatitis C‑related cirrhosis). However, in 2016, 31% (73) of all liver transplants were attributable to chronic hepatitis C or hepatitis C related hepatocellular carcinoma and there were an estimated 605 deaths in people living with chronic hepatitis C, highlighting the importance of maintaining or increasing the current levels of treatment to virtually eliminate hepatitis C by 2030.
Trends in hepatitis C notifications among Aboriginal and Torres Strait Islander people are very different from those among non‑Indigenous people. There has been a 50% increase in the notification rate in Aboriginal and Torres Strait Islander people aged under 25 over the past five years, but a decrease in the rate in non‑Indigenous people in this age group. The difference in overall notification rates may reflect differences in injecting risk behaviours, with results from the Australian Needle and Syringe Program survey showing that Aboriginal and Torres Strait Islander people were almost twice as likely to report recent receptive syringe sharing in 2016. The difference could also be accounted for by disproportionate rates of Aboriginal and Torres Strait Islander people being in prison each year, a setting where hepatitis C screening is recommended on entry. There is a need for an increased focus on culturally appropriate harm reduction strategies for Aboriginal and Torres Strait Islander people in both community and prison settings.
Behavioural factors have complex social determinants, intertwined with poverty and discrimination faced by many
Aboriginal and Torres Strait Islander people. Similarly, health service access and utilisation are strongly influenced by
these factors.
Hepatitis B
New hepatitis B diagnoses
• There were a total of 6555 new hepatitis B diagnoses in Australia in 2016, with almost equal distribution among males (3539, 54%) and females (2989, 46%).
• The notification rate of hepatitis B in 2016 was highest in the 30–39 year age group (61 per 100 000) and 25–29 year age group (48 per 100 000).
• Over the five years 2012 to 2016, the annual notification rate of hepatitis B has remained stable in Australia (28 per 100 000 in 2012 and 27 per 100 000 in 2016). The hepatitis B notification rate has declined in younger age groups over the past five years (16% decline in people aged 15–19 years, 31% decline in those aged 20–24 and 25%
decline in those aged 25–29), in contrast to increases in older age groups (5% increase in those aged 30–39, and a 9% increase in people aged 40 and over), reflecting the impact of the infant and adolescent vaccination programs.
• There was also a decline in the notification rate of newly acquired hepatitis B (evidence of hepatitis B acquisition in the two years prior to diagnosis) in younger age groups over the past five years (75% decline in those aged 15–19 years, 80% decline in those aged 20–24, and a 59% decline in those aged 25–29).
• The notification rate of hepatitis B among the Aboriginal and Torres Strait Islander population in the Australian Capital Territory, Northern Territory, South Australia, Tasmania and Western Australia declined by 50% between 2012 and 2016 (from 62 to 31 per 100 000). Similar to the overall trend in Australia, the greatest declines were observed in the younger age groups. In 2016, the notification rate of hepatitis B in the Aboriginal and Torres Strait Islander population was 1.4 times as high as in the non‑Indigenous population (31 per 100 000 compared to 23 per 100 000).
Prevalence and morbidity
• There were an estimated 233 034 people living with chronic hepatitis B in Australia in 2016, of whom an estimated 49 696 (22%) were born in Northeast Asia, 39 482 (18%) were born in Southeast Asia, and 24 287 (11%) were Aboriginal and Torres Strait Islander people.
• The estimated chronic hepatitis B prevalence was 6.2% in people born in Northeast Asia, 4.5% in people born in Southeast Asia, 4.0% in people who inject drugs, 3.7% in Aboriginal and Torres Strait Islander people, and 3.0% in gay and bisexual men, with overlaps in some of these categories.
• An estimated 412 deaths attributable to chronic hepatitis B infection occurred in 2016.
Testing and care
• In 2016 an estimated 63% of the estimated number of people living with chronic hepatitis B in Australia had been diagnosed.
• Treatment for hepatitis B is recommended for people with elevated hepatitis B viral load, abnormal liver function tests, or those who have advanced liver disease (cirrhosis), and Australia’s Second National Hepatitis B Strategy (2014–2017) has a target of 15% of people living with chronic hepatitis B on treatment. In 2016 only 7% of people living with chronic hepatitis B were estimated to be receiving antiviral therapy.
Prevention
• In 2016 coverage of infant hepatitis B vaccination at 12 months of age was 94% in the non‑Indigenous population and 92% in the Aboriginal and Torres Strait Islander population, reaching 96% and 97% respectively by 24 months.
• Of 21 529 people attending sexual health clinics in 2016 for whom vaccination documentation or pathology details
were available, 22% were susceptible to hepatitis B. The proportion susceptible was highest in people aged 55
years or more (30%), 29% in those aged 50–54, and 20%–26% in people aged under 40.
Interpretation:
Hepatitis B in adolescents and adults in Australia is transmitted through a variety of pathways, including injecting drug use and sexual contact, unlike hepatitis C which is strongly associated with injecting risk behaviour. However, most people living with chronic hepatitis B in Australia were born overseas and acquired hepatitis B at birth or in early childhood. Age‑specific notification rates for both overall and newly acquired hepatitis B suggest a decline in the age groups (under 30 years) that are most likely to have benefited from the introduction of universal vaccination of infants in 2000 (1990 in the Northern Territory) and adolescent catch‑up programs from 1998 (with variations in when school‑based vaccination programs were introduced by jurisdiction). Maternal screening and vaccination of infants born to women with hepatitis B are also likely to have contributed to this decline. However, 22% of people attending sexual health clinics remain susceptible to hepatitis B acquisition, highlighting the need for increased vaccination coverage in people at risk of hepatitis B.
Overall, an estimated 63% of people living with chronic hepatitis B in Australia were diagnosed in 2016. Of those,
an estimated 17% were receiving care and 7% were receiving treatment. These data suggest an ongoing gap in
both the uptake of testing to diagnose chronic hepatitis B, and the uptake of treatment and monitoring to prevent
morbidity and mortality, and there is a need to strengthen strategies to bridge these gaps.
Sexually transmissible infections other than HIV
Chlamydia
New chlamydia diagnoses
• Chlamydia was the most frequently notified sexually transmissible infection (STI) in Australia, with a total of 71 751 notifications in 2016. Three‑quarters (75%) of these notifications were among people aged 15–29 years.
• Chlamydia notifications from Victoria in 2015 and 2016 were incomplete and have been excluded from the report.
Victorian notifications on average account for about a quarter (23%) of notifications nationally.
• The annual rate of chlamydia notifications remained stable between 2012 and 2015, and then increased by 8%
between 2015 and 2016 from 378 to 409 per 100 000. There was a larger increase in men (14%) than in women (4%) between 2015 and 2016, although the rate in women was higher than in men in 2016 (458 vs 364 per 100 000).
• In 2016, chlamydia notification rates were highest in the age groups 20–24 years (1970 per 100 000), 15–19 (1285 per 100 000) and 25–29 (1116 per 100 000). Over the past five years, there was a decline in the annual chlamydia notification rate among people aged 15–19 year (15% decline).
• The annual rate of notification of chlamydia in the Aboriginal and Torres Strait Islander population in the Northern Territory, Queensland, South Australia and Western Australia was 2.8 times that in the non‑Indigenous population in 2016 (1194 per 100 000 compared to 419 per 100 000).
Incidence
• In 2016, chlamydia incidence in HIV‑positive gay and bisexual men (38 per 100 person‑years) was 1.9 times as high as in HIV‑negative gay and bisexual men (20 per 100 person‑years), with a 17% increase in HIV‑positive gay and bisexual men and 6% increase in HIV‑negative gay and bisexual men since 2012.
• In female sex workers, chlamydia incidence increased by 35% between 2012 and 2016 (from 7.8 to 10.5 per 100 person‑years).
Testing and care
• In 2016, there were an estimated 258 139 (154 007 in men, 104 132 in women) new chlamydia infections in people aged 15–29 years. Of those, 28% were diagnosed (19% of men, 42% of women), 93% of those diagnosed received treatment (93% for both men and women) and 35% of those treated had a retest within six months (39%
of men, 32% of women).
• Between 2012 and 2016, the ratio of chlamydia notifications to Medicare‑rebated chlamydia tests decreased by 15% from 8.1 in 2012 to 6.9 in 2016, with a decline in both males (14% decline) and females (18% decline). The ratio was higher in males (10.2 in 2016) in each of the past five years than in females (5.4 in 2016).
• Between 2012 and 2016, there was a 16% increase in the proportion of people aged 15–29 attending general
practices who had a Medicare‑rebated chlamydia test, but the overall proportion tested remained low in 2016
(15%). The proportion tested in 2016 was higher in women (20%) than in men (9%).
Gonorrhoea
New gonorrhoea diagnoses
• There were 23 887 new diagnoses of gonorrhoea in 2016, with about three quarters of all diagnoses in males (17 325, 73%).
• Between 2012 and 2016, gonorrhoea notification rates increased by 63% (62 to 101 per 100 000), with an increase in both males (72%) and females (43%). The gonorrhoea notification rate in 2016 was higher in males (146 per 100 000) than in females (56 per 100 000).
• In males, the highest gonorrhoea notification rates were in the age groups 25–29 (438 per 100 000) and 20–24 years (383 per 100 000), and in females in the age groups 20–24 (199 per 100 000) and 15–19 years (177 per 100 000).
• Over the past five years (2012–2016), gonorrhoea notification rates increased in major cities (99% increase) and regional areas (15% increase) but declined in remote areas (8% decline).
• The rate of notification of gonorrhoea in the Aboriginal and Torres Strait Islander population was 6.9 times that in the non‑Indigenous population in 2016 (582 per 100 000 compared to 84 per 100 000). These data are from the Australian Capital Territory, the Northern Territory, Queensland, South Australia, Tasmania, Victoria and Western Australia. Over the past years 2012–2016, gonorrhoea annual notification rates decreased by 17% in the Aboriginal and Torres Strait Islander population.
• In 2016, the ratio of male to female notifications among Aboriginal and Torres Strait Islander people was 0.9:1 compared with 3:1 in the non‑Indigenous population. Also in 2016, almost a third (32%) of gonorrhoea notifications in Aboriginal and Torres Strait Islander people were in people aged 15–19 years, compared with 7% in the
non‑Indigenous population. The gonorrhoea notification rate in the Aboriginal and Torres Strait Islander population in 2016 was highest in remote and very remote areas (1444 per 100 000), which was 30 times as high as the non‑Indigenous population.
Incidence
• In 2016, gonorrhoea incidence was 34 per 100 person‑years in HIV‑positive gay and bisexual men, 1.5 times as high as in HIV‑negative gay and bisexual men (23 per 100 person‑years). In the past five years (2012–2016) gonorrhoea incidence increased in both HIV‑positive (29% increase) and HIV‑negative (30% increase) gay and bisexual men, but remained steady between 2015 and 2016.
• In female sex workers gonorrhoea incidence was 5.3 per 100 000 in 2016 but increased from 3.6 per 100 person‑years in 2012.
Testing and care
• Between 2012 and 2015, the ratio of gonorrhoea notifications to Medicare‑rebated gonorrhoea tests remained stable (1.3 to 1.4), but increased by 64% between 2015 and 2016 (from 1.4 to 2.3), with increase in both males (59%) and females (50%). The ratio was higher in males (5.4 in 2016) in each of the past five years than in females (0.9 in 2016).
• Results from the Gay Community Periodic Surveys show comprehensive STI testing (at least four samples from
separate sites collected for STI screening) in the past 12 months in gay and bisexual men increased from 37% in
2012 to 45% in 2016.
Syphilis
New syphilis diagnoses
• There were 3367 new notifications of infectious syphilis (infections of less than two years duration) in 2016, with the majority of notifications in males (2945, 87%).
• Over the past five years (2012–2016), the notification rate of infectious syphilis increased 107% from 6.9 per 100 000 in 2012 to 14.3 per 100 000 in 2016, with an increase in both males (103%) and females (157%). The notification rate was higher in males (25.0 per 100 000) than in females (3.6 per 100 000) in 2016.
• In 2016, infectious syphilis notification rates were highest in people aged 25–29 years (34 per 100 000), 30–39 (29 per 100 000) and 20–24 (25 per 100 000).
• In 2016, infectious syphilis notification rates were higher in remote and very remote areas (49 per 100 000) than in major cities (14 per 100 000) and regional areas (10 per 100 000). Over the past five years (2012–2016), notification rates increased in all areas, with the greatest increase in regional areas (209% increase) followed by remote areas (176% increase) and major cities (84% increase).
• The rate of notification of infectious syphilis in the Aboriginal and Torres Strait Islander population (67 per 100 000) in 2016 was 5.4 times as high as in the non‑Indigenous population (12 per 100 000). The rate of notification of infectious syphilis among the Aboriginal and Torres Strait Islander population increased by 193% from 23 per 100 000 in 2012 to 67 per 100 000 in 2016 compared to 100% increase in non‑Indigenous population (from 6.2 to 12.4 per 100 000).
• In 2016, just over half (54%) of notifications of infectious syphilis in the Aboriginal and Torres Strait Islander population were among males compared with a large majority (94%) of all notifications in males in the non‑Indigenous population. One in five (21%) infectious syphilis notifications in the Aboriginal and Torres Strait Islander population were in people aged 15–19 years, compared with only 2% in the non‑Indigenous population.
The infectious syphilis notification rate in the Aboriginal and Torres Strait Islander population in 2016 was highest in remote and very remote areas (135 per 100 000), which was 50 times as high as in the non‑Indigenous population.
• Over the last 10 years (2007–2016), more than half (24, 55%) of the 43 congenital syphilis notifications were in the Aboriginal and Torres Strait Islander population.
Incidence
• In 2016, the incidence of infectious syphilis incidence among HIV‑positive gay and bisexual men attending sexual health clinics was 5.6 per 100 person‑years, 2.2 times as high as the 2.5 per 100 person‑years in HIV‑negative gay and bisexual men. Between 2012 and 2016, infectious syphilis incidence fluctuated in both HIV‑negative (between 2.5 and 3.8 per 100 person‑years) and HIV‑positive (between 5.6 and 8.3 per 100 person‑years) gay and bisexual men.
• In 2016, infectious syphilis incidence in female sex workers was 0.4 per 100 person‑years, and fluctuated between 0.2 and 0.5 per 100 person‑years over the past five years (2012–2016).
Testing and care
• Among gay and bisexual men attending sexual health clinics in the ACCESS network, the average number of
syphilis tests per person increased by 15% from 1.3 in 2012 to 1.5 in 2016. In 2016, the average number of syphilis
tests in HIV‑positive gay and bisexual men was 1.8 compared with 1.4 in HIV‑negative gay and bisexual men.
Other sexually transmissible infections
Donovanosis, once a frequently diagnosed sexually transmissible infection among remote Aboriginal populations, is now close to elimination, with only two cases notified since 2011.
Following the introduction of vaccination against human papillomavirus in 2007 (introduced in 2007 for girls and in 2013 for boys aged 12 to 13 years), a high three‑dose coverage has been achieved nationally in both girls (79% in 2016) and boys (73% in 2016) turning 15 years of age. Indicators of the success of this program include the following:
• Among Australian‑born women under 21 years attending sexual health clinics for their first visit, the proportion diagnosed with genital warts has fallen since 2007 from 11.0% to 0.9%, a reduction of 92%.
• Among heterosexual men under 21 years attending sexual health clinics for their first visit, the proportion diagnosed with genital warts has also fallen from 9.3% in 2007 to 0.6% in 2016, a reduction of 94%, with a 63%
decline since 2013 when male vaccination was introduced.
• The rate of detection of high‑grade histological abnormalities has fallen from 13.2 per 1000 women aged under 20 years undergoing cervical cancer screening (Pap screening) in 2006 to 4.1 per 1000 in 2015 (69% decline), and from 19.9 per 1000 to 11.8 per 1000 (41% decline) in women aged 20‑24 years.
Interpretation:
Both testing and diagnoses of chlamydia have increased in the past five years. However, the vast majority of infections in young people (15–29 years) remain undiagnosed and untreated, highlighting the need for testing to be routinely offered to sexually active adolescents and young adults.
Gonorrhoea and infectious syphilis in Australia are diagnosed primarily in gay and bisexual men in urban settings, and in young heterosexual Aboriginal and Torres Strait Islander people in remote areas, though gonorrhoea notification rates among women in urban settings have increased steadily.
Gonorrhoea and infectious syphilis have been diagnosed more frequently in the past five years in gay and bisexual men, with the highest rates in younger men and in men with HIV. Explanations for these increases in gay and bisexual men include more comprehensive screening, a change to more sensitive gonorrhoea testing technology, an increasing trend in condomless anal sex, and greater availability and awareness of highly effective HIV prevention strategies.
Efforts to improve health promotion, testing and treatment in gay and bisexual men need to be strengthened.
The increase in the ratio of gonorrhoea notifications to Medicare‑rebated tests among both men and women between 2015 and 2016 suggests increasing transmission through heterosexual sex, highlighting the need for health promotion, enhanced testing and partner notification in heterosexual men and women. In female sex workers, the rise in chlamydia and gonorrhoea incidence in recent years highlights the need for enhanced focus on prevention strategies.
In the Aboriginal and Torres Strait Islander population, notification rates of sexually transmissible infections remain
higher than in the non‑Indigenous population: gonorrhoea (7 times as high), infectious syphilis (5 times as high) and
chlamydia (3 times as high). The resurgence of infectious syphilis in young Aboriginal people in remote communities
after years of declining rates, along with cases of congenital syphilis, emphasises the need to enhance culturally
appropriate health promotion, testing and treatment strategies in this population.
1 HIV
Details of HIV notifications are given in this chapter. Please see p. 4 for summary.
1.1 New HIV diagnoses
This section focuses on people diagnosed with HIV for the first time in Australia (‘new diagnoses’). In 2016 there were a total of 1013 new HIV diagnoses in Australia: 920 (91%) in males, 669 (66%) in people aged 30 years and above, and 46 (0.5%) among people reported to be Aboriginal and/or Torres Strait Islander (Table 1.1.1). Over a third (36%) of all diagnoses in 2016 were classified as newly acquired (evidence of HIV acquisition in the 12 months prior to diagnosis) (Table 1.1.1).
A total of 37 225 diagnoses of HIV have been notified since 1984, of which 33 972 were among males
and 2911 among females. The annual number of new HIV diagnoses has increased by 7% over the
past 10 years, from 947 in 2007 to 1066 in 2012, and remained stable since then, with 1013 cases in
2016 (Figure 1.1.1). Over the same period the number of diagnoses has increased by 9% in males
(from 841 in 2007 to 920 in 2016) but decreased by 16% in females (from 105 in 2007 to 88 in 2016)
(Figure 1.1.1, Table 1.1.1).
Table 1.1.1 Characteristics of cases of new HIV diagnoses, 2007–2016
Year of HIV diagnosis 2007 2008 2009 2010 2011 2012 2013 2014 2015 2016 2007–2016
aCharacteristic
Total
b947 901 945 908 980 1066 1030 1084 1027 1013 9901
Sex
Male 841 791 825 797 877 961 922 978 917 920 8 829
Female 105 110 118 108 102 104 105 104 108 88 1 052
Median age in years
Male 38 37 37 37 37 36 37 35 35 34 36
Female 32 31 32 31 32 31 34 35 36 34 33
Aboriginal and Torres Strait Islander status
Non‑Indigenous 919 868 911 875 952 1027 990 1036 970 961 9509
Aboriginal and Torres Strait
Islander 19 19 24 22 24 33 26 33 39 46 285
Not reported 9 14 10 11 4 6 14 15 18 6 107
Age group in years
0–14 7 7 10 6 8 1 6 3 3 5 56
15–19 9 13 13 13 17 22 23 18 29 14 171
20–29 215 240 253 231 263 319 270 328 308 325 2 752
30–39 320 296 305 286 305 322 291 337 292 305 3 059
40–49 248 219 220 230 237 225 244 216 205 193 2 236
50+ 148 126 144 142 150 177 196 182 190 171 1 626
Language spoken at home
cEnglish 727 688 717 679 778 797 527 835 735 735 7 218
Other language 60 55 94 79 83 102 87 116 154 149 979
Not reported 160 158 134 150 119 167 416 133 138 129 1704
Newly acquired 278 284 301 305 371 395 346 425 398 365 3 468
(% of new diagnoses) (29.4) (31.5) (31.9) (33.6) (37.9) (37.1) (33.6) (39.2) (38.8) (36.0) (35.0) Late and advanced HIV status at HIV diagnosis
dLate HIV diagnosis, % 31.8 31.6 35.0 35.0 28.9 31.5 32.1 28.5 29.0 32.7 31.5
Advanced HIV diagnosis, % 17.8 17.3 20.5 20 19.1 17.8 18.5 16.7 15.9 19.5 18.3
Median CD4+ cell count,
cells/µL 430 430 408 400 429 430 420 440 440 420 428
State/Territory
ACT 9 7 11 13 11 17 21 18 14 13 134
NSW 386 326 339 310 332 408 354 346 349 317 3 467
NT 6 10 12 5 9 20 13 9 9 23 116
QLD 167 174 182 209 196 208 181 246 203 195 1 961
SA 49 39 50 34 57 31 58 39 44 42 443
TAS 4 11 14 9 15 13 11 16 16 19 128
VIC 263 262 262 236 278 267 307 302 283 312 2 772
WA 63 72 75 92 82 102 85 108 109 92 880
HIV exposure risk category
Male‑to‑male sex
e626 586 598 589 685 743 678 761 700 712 6 678
Male‑to‑male sex and
injecting drug use 29 32 38 22 32 34 44 50 49 51 381
Injecting drug use 25 32 23 23 20 25 27 31 30 14 250
Heterosexual sex 200 207 231 208 192 207 218 201 206 209 2 079
Person from a
high‑prevalence country
f58 81 82 74 47 53 37 46 39 35 552
Partner from a
high‑prevalence country 24 13 20 24 28 24 28 33 35 35 264
Partner at high risk
g31 27 29 18 33 31 44 28 39 38 318
Not further specified 87 86 100 92 84 99 109 94 93 101 945
Receipt of blood/tissue
h1 0 1 0 0 4 3 0 8 1 18
Mother with/at risk of HIV 4 5 8 5 7 1 4 3 4 5 46
Other/undetermined 62 39 46 61 44 52 56 38 30 21 449
a Not adjusted for multiple reporting.
b Includes sex of ‘Other’ and ‘Not reported’.
c Language spoken at home was sought among cases of HIV newly diagnosed from 1 January 2004.
d Late HIV diagnosis was defined as newly diagnosed HIV with a CD4+ cell count of less than 350 cells/μL, and advanced HIV as newly diagnosed infection with a CD4+ cell count of less than 200 cells/μL. Newly acquired HIV was not categorised as late or advanced diagnosis, irrespective of
HIV
Figure 1.1.1 New HIV diagnoses in A ustralia, 1984–2016, b y se x Year Number of dia
gnoses
0 500
1000
1500
2000
2500
3000 2016 2014 2012 2010 2008 2006 2004 2002 2000 1998 1996 1994 1992 1990 1988 1986 1984
2412 1013 987
Women517196318202290172216961438139011581009951873838742669646687682756783779860849841791825797877961922978917920 Men14866574726682778666867273799273799688861189313610511011810810210410510410888 Totala539209119372412181117841556149012531089104594991682876572177078085087289995498794790194590898010661030108410271013 a Includes transgender people and people for whom data on sex was missing. Source: State and territory health authorities; see Methodology for detail.Demographics
In 2016 the largest number of notifications was in the age group 20–29 years (325), followed by those aged 30–39 (305) and 40–49 (193) (Figure 1.1.2, Table 1.1.1). Over the five years 2012–2016, the number of HIV diagnoses remained stable among those aged 20 years and over, except for the 40–49 age group, in whom there was a 14% decline. The number of diagnoses remained low in younger age groups, with 14 diagnoses in the 15–19 age group and five in the 0–14 age group in 2016; the number of diagnoses in both age groups fluctuated over the past five years.
Figure 1.1.2 New HIV diagnoses in Australia, 2007–2016, by age group
Rate per 100 000
0 3 6 9 12 15
2016 2015
2014 2013
2012 2011
2010 2009
2008
2007
Year0–14 7 7 10 6 8 1 6 3 3 5
15–19 9 13 13 13 17 22 23 18 29 14
20–29 215 240 253 231 263 319 270 328 308 325
30–39 320 296 305 286 305 322 291 337 292 305
40–49 248 219 220 230 237 225 244 215 205 193
50+ 148 126 144 142 150 177 196 182 190 171
Source: State and territory health authorities; see Methodology for detail.
HIV
The notification rate of HIV in 2016 was 4.2 per 100 000; this has been stable in the past 10 years (between 4.2 and 4.8 per 100 000) (Figure 1.1.3). Similarly, the notification rate of HIV in males has been stable in the past 10 years (between 7.4 and 8.6 per 100 000); it was 7.8 per 100 000 in 2016. The notification rate in females has also remained stable over the past 10 years (between 0.7 and 1.1 per 100 000), but is low compared to that in males (0.7 vs 7.8 per 100 000 in 2016).
Figure 1.1.3 New HIV diagnoses, rate per 100 000 population, 2007–2016, by sex
Age-standardised rate per 100 000
0 1 2 3 4 5 6 7 8 9 10
2016 2015
2014 2013
2012 2011
2010 2009
2008
2007
YearWomen 1.0 1.1 1.1 1.0 1.0 0.9 0.9 0.9 0.9 0.7
Men 8.3 7.6 7.8 7.4 8.0 8.6 8.1 8.4 7.8 7.8
Total 4.6 4.3 4.5 4.2 4.5 4.8 4.5 4.7 4.4 4.2
Source:
State and territory health authorities; see Methodology for detail.
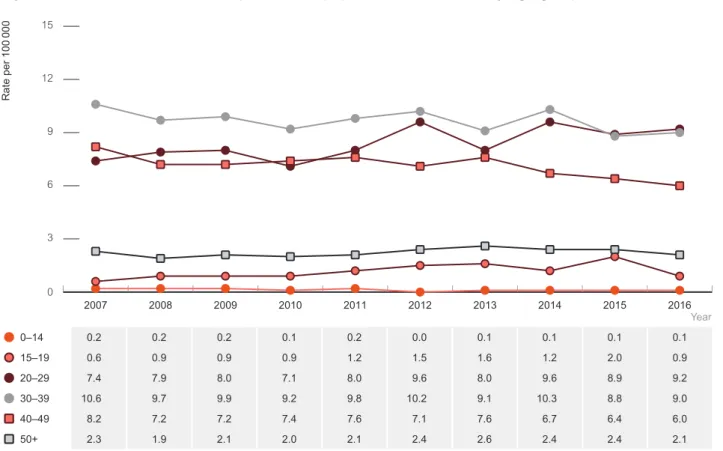
In 2016 HIV notification rates were highest in the age group 20–29 years (9.2 per 100 000), followed by the 30–39 age group (9.0 per 100 000) and the 40–49 age group (6.0 per 100 000), with a 24% increase since 2007 in the 20–29 age group, but rates declined in the 30–39 and 40–49 age groups (Figure 1.1.4). Similar trends were observed for males (Figure 1.1.5). HIV notification rates among females were lower than in males in all age groups over the past 10 years (2007–2016) (Figure 1.1.6). In 2016, HIV notification rates were highest among women aged 30–39 years (1.9 per 100 000), followed by those aged 20–29 (1.3 per 100 000).
Rates have declined by 46% in women aged 20–29 years since 2007 when the rate was 2.4 per 100 000.
Figure 1.1.4 HIV notification rate per 100 000 population, 2007–2016, by age group
Rate per 100 000
0 3 6 9 12 15
2016 2015
2014 2013
2012 2011
2010 2009
2008
2007
Year0–14 0.2 0.2 0.2 0.1 0.2 0.0 0.1 0.1 0.1 0.1
15–19 0.6 0.9 0.9 0.9 1.2 1.5 1.6 1.2 2.0 0.9
20–29 7.4 7.9 8.0 7.1 8.0 9.6 8.0 9.6 8.9 9.2
30–39 10.6 9.7 9.9 9.2 9.8 10.2 9.1 10.3 8.8 9.0
40–49 8.2 7.2 7.2 7.4 7.6 7.1 7.6 6.7 6.4 6.0
50+ 2.3 1.9 2.1 2.0 2.1 2.4 2.6 2.4 2.4 2.1
Source:
State and territory health authorities; see Methodology for detail.
Figure 1.1.5 HIV notification rate per 100 000 population, 2007–2016, by age group, males
Rate per 100 000
0 5 10 15 20 25
2016 2015
2014 2013
2012 2011
2010 2009
2008
2007
Year0–14 0.1 0.2 0.1 0.2 0.1 0.0 0.0 0.1 0.0 0.1
15–19 1.1 1.1 1.3 1.5 1.6 2.4 1.9 2.0 2.8 1.7
20–29 12.2 13.2 13.1 11.6 14.2 16.5 14.3 17.3 16.0 17.1
HIV
Figure 1.1.6 HIV notification rate per 100 000 population, 2007–2016, by age group, females
Rate per 100 000
0 1 2 3 4 5
2016 2015
2014 2013
2012 2011
2010 2009
2008
2007
Year0–14 0.2 0.2 0.3 0.1 0.3 0.0 0.2 0.0 0.1 0.1
15–19 0.1 0.7 0.4 0.3 0.7 0.6 1.3 0.4 1.1 0.1
20–29 2.4 2.5 2.7 2.5 1.7 2.4 1.5 1.7 1.5 1.3
30–39 2.2 2.8 2.5 2.7 2.3 2.4 1.7 2.7 2.0 1.9
40–49 1.2 1.0 1.2 0.8 1.3 0.9 1.2 1.1 1.0 0.9
50+ 0.4 0.2 0.3 0.2 0.2 0.2 0.5 0.3 0.5 0.4
Source: