Publisher’s version / Version de l'éditeur:
Journal of ASTM International, 6, 8, pp. 1-35, 2009-09-01
READ THESE TERMS AND CONDITIONS CAREFULLY BEFORE USING THIS WEBSITE. https://nrc-publications.canada.ca/eng/copyright
Vous avez des questions? Nous pouvons vous aider. Pour communiquer directement avec un auteur, consultez la
première page de la revue dans laquelle son article a été publié afin de trouver ses coordonnées. Si vous n’arrivez pas à les repérer, communiquez avec nous à [email protected].
Questions? Contact the NRC Publications Archive team at
[email protected]. If you wish to email the authors directly, please see the first page of the publication for their contact information.
NRC Publications Archive
Archives des publications du CNRC
This publication could be one of several versions: author’s original, accepted manuscript or the publisher’s version. / La version de cette publication peut être l’une des suivantes : la version prépublication de l’auteur, la version acceptée du manuscrit ou la version de l’éditeur.
For the publisher’s version, please access the DOI link below./ Pour consulter la version de l’éditeur, utilisez le lien DOI ci-dessous.
https://doi.org/10.1520/JAI101428
Access and use of this website and the material on it are subject to the Terms and Conditions set forth at
Laboratory tests of water penetration through wall-window interfaces
based on U.S. residential window installation practice
Lacasse, M. A.; Rousseau, M. Z.; Cornick, S. M.; Manning, M. M.;
Ganapathy, G.; Nicholls, M.; Williams, M. F.
https://publications-cnrc.canada.ca/fra/droits
L’accès à ce site Web et l’utilisation de son contenu sont assujettis aux conditions présentées dans le site LISEZ CES CONDITIONS ATTENTIVEMENT AVANT D’UTILISER CE SITE WEB.
NRC Publications Record / Notice d'Archives des publications de CNRC:
https://nrc-publications.canada.ca/eng/view/object/?id=3495390a-e159-4679-a9f3-d9fce774903b https://publications-cnrc.canada.ca/fra/voir/objet/?id=3495390a-e159-4679-a9f3-d9fce774903b
http://www.nrc-cnrc.gc.ca/irc
La bora t ory t e st s of w a t e r pe ne t ra t ion t hrough w a ll-w indow
int e rfa c e s ba se d on U .S. re side nt ia l w indow inst a lla t ion pra c t ic e
N R C C - 5 0 0 3 3
L a c a s s e , M . A . ; R o u s s e a u , M . Z . ; C o r n i c k , S . M . ;
M a n n i n g , M . M . ; G a n a p a t h y , G . ; N i c h o l l s , M . ;
W i l l i a m s , M . F .
F e b r u a r y 2 0 1 0
A version of this document is published in / Une version de ce document se trouve dans:
Journal of ASTM International, 6, (8), pp. 1-35, September 01, 2009, DOI:
10.1520/JAI101428
The material in this document is covered by the provisions of the Copyright Act, by Canadian laws, policies, regulations and international agreements. Such provisions serve to identify the information source and, in specific instances, to prohibit reproduction of materials without written permission. For more information visit http://laws.justice.gc.ca/en/showtdm/cs/C-42
Les renseignements dans ce document sont protégés par la Loi sur le droit d'auteur, par les lois, les politiques et les règlements du Canada et des accords internationaux. Ces dispositions permettent d'identifier la source de l'information et, dans certains cas, d'interdire la copie de documents sans permission écrite. Pour obtenir de plus amples renseignements : http://lois.justice.gc.ca/fr/showtdm/cs/C-42
M. A. Lacasse
1, M. Rousseau
1,
S. M. Cornick, M. Manning
1, G. Ganapathy
1, M. Nicholls
1and
M. F. Williams
2Laboratory Tests of Water Penetration Through Wall-Window Interfaces
Based on US Residential Window Installation Practice
REFERENCE:
M. A. Lacasse, M. Rousseau,
S. M. Cornick, M. Manning, G. Ganapathy,
M. Nicholls and M. F. Williams, “Laboratory Tests of Water Penetration Through
Wall-Window Interfaces Based on US Residential Wall-Window Installation Practice
”
Journal of ASTM
International, Vol. 6, Issue _
ASTM International, West Conshohocken, PA, 2007
ABSTRACT: Inadequate detailing practice and defective installation of windows has accounted for a significant number of premature failures of the building envelope. This has spurred the development of alternative construction details to manage water intrusion at the wall-window interface. Laboratory investigations focused on assessing the effectiveness of wall-window interface details to manage rainwater intrusion in the wall assembly have provided an effective way to obtain useful information on the varying performance of different interface details. Previous studies undertaken to investigate the effectiveness of details typically used in wood frame low-rise wall assemblies have shown the degree to which different details manage rainwater intrusion and the extent of fault tolerance of such systems. This paper reports on results obtained from laboratory testing of two sets of wall-window interface details and variations on their implementation, that are representative of residential and light commercial window
installation practice in the US. Results from these tests indicate that the window installations details of the type assessed in this study are adequate to manage even the most significant rainfall events as might occur in North America. It was also demonstrated that window installation designs that do not permit drainage from the sill are vulnerable to excessive water retention during significant wind-driven rain events. Additionally, critical elements for achieving functional window installation details included: sill pan flashing with watertight corners; openings along the interface between the sill and window flange to permit water drainage; continuity of the air barrier system at the interface with the window frame and window. Such designs could be adopted for climate zones having heightened wind-driven rain loads such as coastal areas of the US subjected to severe storm events. The work is limited to evaluating the response of wall-window interface details to simulated wind-driven rain and water penetration; it does not address hygrothermal effects.
KEYWORDS: laboratory tests, rainwater intrusion, wall-window interface, watertightness, window installation details, wind-driven rain, nail-flange windows
1
National Research Council Canada, Institute for Research in Construction, 1200 Montreal Road, Building M-20, Ottawa, ON, K1A 0R6 Canada; [email protected]
2
Introduction
A key functional requirement for exterior walls is, evidently, the control of rain penetration. To effectively control penetration the appropriate design and installation of components is important. Lack of attention to either the detailing of components or their installation may result in the premature deterioration of wall elements. Inadequate detailing and defective installation of windows has accounted for a significant number of premature failures of the building envelope as has been evident across North America in recent years [1, 2, 3, 4]. For example, a survey of building envelope failures in the coastal region of British Columbia indicated that 25% of the moisture problems associated with water ingress into wall assemblies were directly attributed to penetration through windows or the wall-window interface [1]. However, the issue of building envelope failure is not one that is limited to coastal climates given the concern evident throughout North America.
For example, the issue of premature failure of the building envelope has been apparent in the state of Minnesota [3], where it is reported by the building inspection division of the town of Woodbury that homes built since 1990 were experiencing major durability problems. Specifically, 276 of 670 stucco homes built in Woodbury in 1999 had failed (ca. 41%); the primary cause for failure were window leaks, lack of kickout flashing, and improper deck flashing above the wood framing [3].
The state of California has taken interest in understanding the level of risk afforded by different window installation methods and has recently reported on a test program to evaluate the performance of different window installation details [4]. The overall goal was to perform a systematic laboratory evaluation of specifically identified conventional and innovative residential building materials, assemblies, and construction practices. The laboratory evaluations were designed to provide experimental evidence of moisture loading, propensity for mold formation, and potential performance improvements associated with innovative building assemblies and construction practices.
Clearly the problem of water penetration at window openings persists and not only in coastal areas for which the perception is that climate loads are very severe. Although coastal climates may indeed be severe, details that promote the entrapment of water and that are not fault tolerant are likewise susceptible to premature deterioration, even in areas of apparently reduced “climate loads”. Carll [5] makes the point regarding the need for additional information related to moisture loads on buildings and the need to characterize the degree of water entry in relation to such loads.
The vulnerability of the wall-window interface to water entry was identified in two recent studies [6, 7], which were conducted on behalf of the Canada Mortgage and Housing Corporation. Although a wide range of factors was found to contribute to water leakage, the principal paths for leakage were those associated with the wall-window interface. Two common leakage paths were identified: (1) through the window assembly extending into the adjacent wall assembly, and; (2) through the window to wall interface extending into the adjacent wall assembly. The criteria for water penetration control found in CSA A440 B rating performance [6] do not identify leakage associated with either of these leakage paths. Moreover, testing of the installed window assembly is not a requirement of the standard.
There appears to be considerable concern for more in depth understanding of the behavior of window installation methods over a range of climate loads. To this end, a laboratory investigation was undertaken by the Institute for Research in Construction to evaluate different wall-window interface details and their ability to manage rainwater entry. The approach adopted in the “Wall-Window Interface” consortium project provided a means of assessing the robustness of specified window installation details by considering what occurs when, for example, the jointing product fails, the window leaks, or the assembly has reduced airtightness. Selected results from an initial phase of the project that focused on Canadian window installation practice were reported in [8] and [9].
In this paper, results from a subsequent phase are presented that focus on the evaluation of window installation practice for low-rise wood frame construction in the United States. Specifically, results are given from a laboratory evaluation of the air and watertightness of a select set of wall-window interface details. The details were based on variations of a method for installing windows with mounting flanges that is outlined in ASTM E2112 [10].
An overview of the experimental approach is provided that includes a generic description of the test specimen, a summary description of the test facility and a brief outline of the test protocol. Thereafter, installation details, and variations thereof, are given specific to the wall for which results are reported in this paper.
Water entry characteristics for the different wall-window interface configurations are presented, and the effectiveness of the different details is discussed. Insights are offered into the relative importance in respect to air and watertightness afforded the different components incorporated in the various installation methods.
Experimental Approach to Evaluating Water Management of Window Interface Details
The experimental approach adopted for evaluating these sets of window interface details has been previously developed by Lacasse et al. in [8, 9] and was based on similar water penetration tests undertaken on different wall
assemblies as described in [11]. Although watertightness evaluations determined from laboratory tests simulating wind-driven rain events do not directly relate to expected long-term performance of the assemblies, these can provide a linkage to the response of assemblies to specific rain events for which the recurrence period is known. Establishing the response of wall assemblies to simulated events is an indirect means of determining the likely risk of water entry over a given period for a specific climate region. Such type of evaluations may also provide some measure of the expected risk to water entry and fault tolerance of different installation methods in extreme conditions [12].
In the context of evaluating the watertightness of wall-window interface installation details, the ability of specific details to manage rainwater is determined on the basis of air leakage and water penetration tests and the response of the respective details, and details incorporating deficiencies, when subjected to simulated conditions of wind-driven rain.
Generic Description of Test Specimen
Wall specimens were designed to permit side-by-side comparison of two wall-window interfaces (Figure 1). The wall specimens were intended to be representative of low-rise residential and light commercial construction except that they used clear materials in place of interior gypsum board or wood-based sheathing. The specimens consisted of: 38 by 138 mm (nominal 2-in. by 4-in) wood studs, transparent acrylic sheet installed against the inside surfaces of the studs (in place of gypsum board, and serving as the principal element of the air barrier system, or ABS), acrylic sheets installed against the exterior surfaces of the studs (in place of plywood or oriented strandboard sheathing), a sheathing membrane (also known as a water resistive barrier, or WRB), and exterior horizontal lap siding. The siding was installed either directly against the WRB or against a drainage medium (proprietary drainage mat, or a proprietary WRB with attached drainage strips). The clear acrylic sheets permitted observation of water penetration past the WRB. The acrylic sheets that served as sheathing had a 3 mm (1/8-in) horizontal joint at mid
height; this was consistent with the manner in which 2.4 m (48-in) wide wood-based sheathing panels are usually installed (where the long dimension of panels is perpendicular to the studs).
Each wall specimen included two openings of 635-mm by 1245-mm (25-in. by 4 ft. 1-in.); in each opening, a 600 mm by 1200 mm window (nominal size: 2-ft. by 4-ft.) was installed. Wall-window interface details at the window head, jambs and sill differed. One of the windows was installed as a “selected practice detail”, and the other
as a variation on the “selected practice detail”. In one of the test specimens, the “selected practice detail” was representative of a common current practice (it was consistent with an installation method outlined in ASTM E 2112 [10] for flanged windows).
The windows were fixed (non-operable) windows, made of either wood or PVC, with integral mounting flanges. The windows were fabricated in Canada; windows having the same (or appreciably similar) configuration and style are commonly used in new residential construction across North America.
Entry of water around either window opening was collected in troughs located beneath the respective sills. Water was also collected at the base of the wall behind the cladding. Additional details regarding the test specimen configuration specific to the results reported are provided below.
Figure 1 — (a) Schematic of front elevation of 2.44-m by 2.44-m (8-ft. by 8-ft.) specimen showing location of 600 m
Description of Test Apparatus - Dynamic Wind and Wall Test Facility (DWTF)
The Dynamic Wind and Wall Test Facility (DWTF), previously used to subject similar specimens to simulated wind-driven rain conditions [11], was utilized for the investigations reported in this manuscript. The facility is
m by 1200 mm (2-ft. by 4-ft.) windows; One half of specimen might be representative of installation details used in
current practice whereas the other half a variation on that practice; (b) Photo of a completed specimen clad with
hardboard siding. (b) Selected practice detail Variation on Selected practice Selected practice detail Variation on Selected practice (a)
capable of subjecting full-scale test specimens (nominal size 2.44-m by 2.44-m; 8-ft. by 8-ft.) to both static or dynamic pressure fluctuations of over 2 kPa (41.8 psf)† and water spray rates ranging between 0.8 and 8L/min-m2 (1.2 and 12 gal/ft. -hr). The dynamic (wind pulsing) capabilities of the facility were not used in the investigations reported in this manuscript; static pressure conditions were instead investigated in this study. The facility provided a means to assess the air leakage characteristics of the specimens. Its pressure regulated water spray system was used in each of two formats. For one of the test specimens, water was applied in full-spray format, (where the water was deposited evenly across the front of the specimen through an array of spray nozzles). For the other test specimens, water was applied at the top of the specimen from a water header pipe, having the capacity of the entire array of nozzles, and
The test protocol was adapted from previous work [11] and a review of wind-driven rain loads as might be experienced across North America [13], [14], that also took into consideration existing North American water
ch as ASTM E331 [15] (Standard Test Method for Water Penetration of Exterior Windows) and CSA A440.4 [16]. The protocol involved spray exposure at a series of spray rates (water deposition rates), and at each spray rate over a series of air pressure differentials across the assembly [13]. A more detailed description of the protocol is provided in [8, 9] but the essential elements are:
m2 ferred to as the 0.3 ABS and 0.8 ABS conditions respectively. Description regarding how the specified air leakage rates of the air barrier systems were attained is provided in a subsequent section
2. Water penetration without deficiency in static mode at specified spray rates of 0.8, 1.6 and 3.4 L/min.-m (1.2, 2.4, 5 gal/ft. -hr) with pressure variations from 0 to 700 Pa (14.6 psf) and nominal air barrier system (ABS) leakage of 0.3 and 0.8 L/s-m at 75 Pa (0.06 and 0.16 cfm/ft. at 1.57 psf). .
2
from which the lower portions of the specimen were wetted by the downward flow of water.”
Summary of Test Protocol
penetration test standards su
1. Characterization of air leakage and pressure equalization potential of the wall assembly
• Air leakage characterization was completed for two nominal air leakage conditions: 0.3 L/s-(at 75 Pa pressure differential) and 0.8 L/s-m2; these are re
2
2
2 2
†
3. Water entry with deficiency in static mode at spray rates varying from 0.8 to 3.4 L/min.-m2 (1.2 to 5 gal/ft. 2-hr) and pressure variations from 0 to 700 Pa (14.6 psf) and nominal ABS leakage of 0.3 an L/s-m2 at 75 Pa (0.06 and 0.16 cfm/ft.2 at 1.57 psf).
d 0.8
se co
were d ese locations as well as that portion that entered the wind
This manuscript reports on the middle phase of a three-phase project involving evaluation of wall-window interfaces. This phase of the project was designated phase B. It addressed installation methodology that is employed, or might be employed in low-rise, residential, wood frame construction in the United States.
tured an hat incor
g and the siding was advantageous. Based on these observations, a third specimen, desig
ls Specimens were thus subjected to simulated wind-driven rain conditions for specified periods of time; the nditions replicated the main features of rain events. Rates of water entry at the subsill and behind the cladding
etermined by measuring the rate of water collected from th
ow at the interface between the window lite and the frame. The use of the facility together with the test protocol permitted comparisons of water entry results among the different wall-window interface details.
Selection of Wall-Window Detailing
More specifically, this manuscript concerns evaluation of two wall test specimens, each clad with hardboard lap siding and each with two identical flanged windows. The first of these specimens, designated B-W1, fea installation that was in accord with method A1 of ASTM E2112 [10], and an alternative installation method t
porated a sill pan and provision for drainage between the sheathing and the siding. As will be discussed later, the test results for test specimen B-W1 suggested that the alternate installation method had advantages relative to the ASTM E2112 A1 method.
The results of tests on a similar test specimen (designated B-W2), which for reasons of brevity are not reported in this manuscript, likewise suggested that installation methodology that incorporated a sill pan and provision for drainage between the claddin
nated B-W3, was constructed and tested. Each window in specimen B-W3 was installed with a sill pan and included provision for drainage between the cladding and the siding.
Descriptions of the test specimens addressed in this manuscript are summarized in Table 1. Additional detai for the respective wall specimens are provided in subsequent sections.
Table 1 — Wall-window combinations selected for testing
Description
Specimen B-side A-Side
B-W1
• WRB (non-woven polypropylene with microporous coating) installed before windo single-piece (slightly larger than test specim and wrapped around s, into window rough openings, and aro top and bottom
e along f
ary product (10-m e
• ASTM E2112 Method A1
n-woven polypropylene microporous coating) installed b ndow in single-piece (slightly larger tha specimen) and wrapped around end studs, into window rough
nd bottom plates;
paced (neither furring strips nor w in
en) • WRB (no end stud
und plates; i.e. no lap-joints in WRB;
• Sill pan, proprietary pre-fabricated flashing product (fabricated of HDPE* components and self-adhesive sheets);
• Window flanges not bedded in sealant;
• Nails used to anchor window flang lange lips
i.e. no lap-joints in WRB • No sill pan
• Window flanges (including bottom flange) bedded in sealant.
• Nails used to anchor window flange along perimeter of opening
at window head and vertical flanges; metal c used to secure underside of flange at sill;
• Drainage mat; propriet m • Siding not s plastic filament with reticulated drainag d
channels) installed after setting window.
efore wi n test openings, and around top a
rainage mat). • WRB installed before window; WRB includes
Two (2) sheets of 1.22-m (4-ft.) wide WRB installed over entire wall surface and overla by 152-mm (6-in.);
•
pped
• WRB Integral furring strips attached to WRB
(.closed-ts and self-adhesive sh
t; cell foam strips - 1¾-in. wide; ¼-in. thick - spaced 203-mm (8-in.) apart);
• Sloped sill pan fabricated of proprietary pre-fabricated componen eets; nominally provides drainage from sill; installed over sill flashing membrane;
• Window flanges not bedded in sealan
• Nails used to anchor window flange along flan at window head and vertical flanges; metal clips used to secure underside of flange at sill.
ge
installed after setting window; • WRB (same as B-side) applied in two (2)
layers;
B-W3
• Integral furring strips attached to WRB (same as B-side);
ry pre-ame as B-side);
anchor window flange along nge • Sloped sill pan fabricated of proprieta
fabricated components and self-adhesive sheets (s
• Window flanges not bedded in sealant; • Nails used to
flange at window head and vertical flanges; metal clips used to secure underside of fla at sill.
* HDPE: high density polyethylene;
For both sides of each of the specimens, the hardboard siding nd the window; no j-channel receptor was used. I
was installed with a 3 mm gap between the siding a n all cases, non-operable (fixed) flanged windows of the same size (600 mm by 1200 mm, as indicated previously) were used; two identical metal-clad wood windows were used in specimen B-W1, while two identical polyvinyl chloride (PVC) windows were used in specimen B-W3. There were no staple penetrations through the outer surface of the WRB membrane, (as the acrylic sheathing was not a suitable staple-base).
As indicted in Table 1, this phase of the project included evaluation of a drainage medium (either a mat or a WRB with attached strips that provided drainage channels between the strips). There was particular interest in the
degree to which the different approaches would provide drainage of the subsill area, and the degree to which the mounting flanges would restrict drainage from the subsill.
de ow frame perimeter to the acrylic sheet “return” sections,
and l e
Specimen B-W1 - Wall-Window Details
-ricated sill-pan flashing product (S-PFP) and a proprietary drainage mat (PDM) behind the siding. An illustration of the S-PFP is given in Figure 2b. Figure 2c is a photo of the drainage mat used on the B-side of the specimen. In figure 2d the lower portion of the window on the B-side is show
of
Specimen B-W3 - Wall-Window Details
orporated a WRB with integral drainage strips, but the details differed with regard to sequencing of window installation relative to placement of the WRB. As indicated in Table 1, on one side of the specimen the WRB was installed prior to setting the window, whereas on the other side of the specimen the WRB was installed after setting the window.
In respect to ensuring the continuity of airtightness at the window frame perimeter, the window “tie-ins” for the test specimens were not completed using aerosol foam or backer-rod and sealant as might typically be used in practice. Given that the interior finish was acrylic sheet, “return” sections of acrylic sheet were also used to provi the interface to the window. Tape was used to seal the wind
ikewise between the “return” sections and the acrylic sheet used as interior finish. For the period of testing, th tape effectively sealed the window perimeter thus making the airtightness of the installations dependent on the airtightness of the interior acrylic sheets.
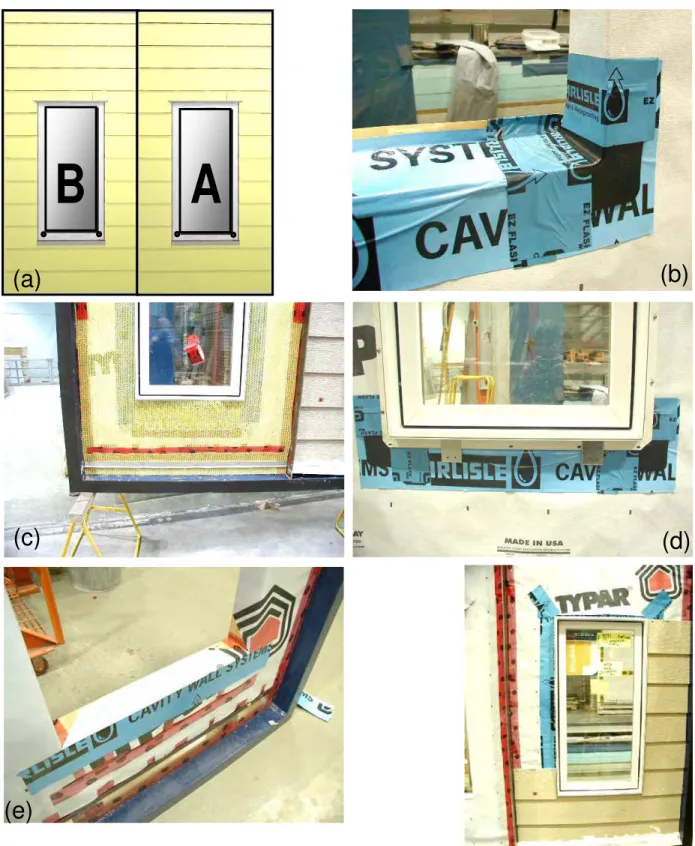
A conceptual sketch of specimen B-W1 configuration, is shown in Figure 2a. As indicted in Table 1, the B side of B-W1 incorporated a proprietary pre-fab
n prior to the installation of the drainage mat and cladding. The two (2) clips located beneath the window flange support the lower flange and provide an opening through which water might drain from the sill area.
As indicted in Table 1, the A-side of specimen B-W1 was built in accord with method A-1 of section 8.1 ASTM E2112. Figure 2e shows the installation of the WRB in the rough opening of the specimen prior to the installation of the window. Figure 2f shows the A-side of the specimen in a stage nearing completion (with the exterior cladding partially installed.
The objective in testing specimen B-W3 was to compare the response of two appreciably similar window interface details. The details each inc
Figure 2 – (a) Schematic of specimen B-W1 showing B- and A-sides; (b) Sill pan PFP method B-side; (c) Propriety drainage mat for B-side; (d) Lower portion of window on B-side prior to installation of drainage mat, cladding; metal clips support lower window flange; (e) Installation of WRB in rough opening of A-side prior to installation of window; shows lower portion next to sill; (f) A-side showing exterior cladding, and self-adhering flashing sheets at
head (largely covered by flap in the WRB) and along one of the jambs.
B
A
(a)
(c)
(e)
(f)
(b)
(d)
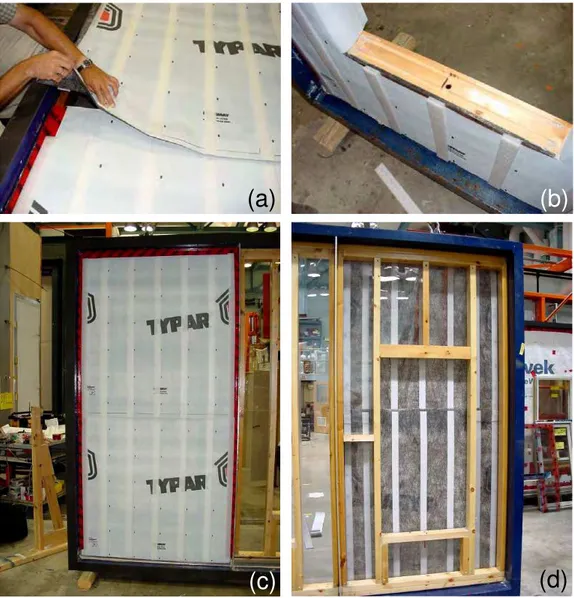
The WRB used on specimen B-W3 incorporated strips that provided drainage channels (Figure 3). The strips, composed of closed-cell polyethylene foam, were 45 mm wide by 6 mm thick (1¾-in. by ¼-in.), and were spaced 203 mm (8-in.) apart. The strips were attached to either side of the WRB and were thus considered as integral with the WRB WRB incorporating the foam strips was installed in two layers, the upper layer overlapping the lower. On of the WRB first installed at the base of the specimen, the strips were held back by 200 mm (8 in.) thus permitting a 200 mm overlap to the adjoining WRB (Figure 3a). Figure 3b shows the WRB installed on the B-side of the wall assembly; at the window opening the WRB has been cut and the individual foam strips can be seen on either side of the WRB membrane. Figure 3c shows the full view of B-side of the specimen as observed from the exterior side of the WRB prior to the WRB being cut at the window opening; (this photo was taken before the photo shown in Figure 3b). Figure 3d shows the full view of the B-side of the specimen, at the same stage as shown in Figure 3c, but viewed from the opposite side of the specimen; the foam strips on the inner face of the WRB membrane can be seen through the window opening (where sheathing is absent) and through the transparent acrylic sheathing panels above, below, and to the sides of the window opening.
. The one edge
(a)
(b)
(c)
(d)
Figure 3 — (a) Installation of WRB with integral closed-cell PE foam strips; (b) View showing WRB installed on wall and at window rough opening; (c) B-side of specimen B-W3 with WRB installed on wall; (d) B-side of
Vertical sectional views and related photographs of the A-side of the specimen (window set before installation e provided in
5 are stylized
( hs. Apart from
cus on protection
o ior and interior of
of WRB) are given in Figure 4. Horizontal sectional views (at the jambs) of the A- and B-sides ar Figure 5(a) and Figure 5(b) respectively. The sketches of the windows provided in Fig. 4 and Fig.
simplified), and are provided for the purpose of showing details of the interface and collection troug the information provided in Table 1, additional details regarding the installation of this specimen fo
f the rough opening and the manner in which the window was “tied-in” to the window at the exter the assembly, specifically:
• Protection at rough sill of rough opening: 152-mm (6-in.) strip of self-adhered flashing m wrapped onto the sloped sill, 51-mm (2-in.) on the sill and 102-mm (4 in.) on the face of (3-in.) wide strips of self-adhered flashing membrane secured the sill pan to jambs. • Window exterior “Tie-In”:
embrane
the WRB; 76-mm
Two metal brackets at the base of the window created a sm window flange and supported the window during installation.
o Window flange at the sill is not taped to ensure adequate drainage
o No caulking or J-trim used between cladding and window frame (¼-in. butt joint); o No drip cap head flashing.
• Window interior “Tie-In”
all gap behind the
: Sheets of clear acrylic were used as interior finish that would the window frame and thereafter sealed with adhesive tape of the type typically used to
be butted against seal the WRB.
Figure 4 – Specimen B-W3– (a) Vertical section of wall-window terfa (b) enlarged detail of se nal view sill ft side; n e ta si showing collection troughs at base of wall; (d) Yellow mesh (pho a s air to pass freely in beh plas tes path for r ee a a flashing; path of water drainage (blue line) from sill pan to co ti ough T1 shown in (b); (e rtical at head for h s s ecimen.
in ce; to), llow llec on tr ctio ind ) Ve at Le tic, crea section (c) e larg d de il on Left de wate flow betw n pl stic nd
bot side of te t sp 8 12 1 2 5 13 Exterior Interior 6 3 7 14 8 4 1 in 1 in 25°
(a)
(c)
(b)
Exterior
Interior
(e)
Trough T3 Collection Tr g llectio o ou h T2 Co n Tr ugh T1(d)
12 2 19 1 7 10 9 8 8 11 5 4 20 21 6Exterior
1 2-ft. by 4-ft. PVC fixed window with integral flange
8 Tape to window frame
2 Horizontal hardboard siding 9 Sill pan
3 Self-adhered flashing membrane 10 Sloped subsill stap
4 WRB with closed cell foam furring strips, installed
before window 11
Wooden rough s tray
5 Closed cell foam strips (1¾-in. wide; ¼-in. thick), spaced 8-in. apart, glued to front, back of WRB as built-in furring strips
12 Wood framing (
6 Clear acrylic sheet, 3/8-in. to act as sheathing board 13 ¼-in. gap sealan
ensure continuity of air barrier system to
19 Water collection trough T1
flashing 20 Collection trough to collect water running down
front of WRB
led to rough sill 21 Collection trough to collect water running down backup wall behind WRB
ill, containing built-in collection
2-in. x 4-in.)
between siding an me, no
t
7 Clear acrylic sheet, 3/8-in. acts as air barrier
d window fra
element for wall 14 Wood shims as nailing support for acrylic sheet
Figure 5 Specimen B-W3 - Horizontal section of wall-window interface at jamb for (a) A-side and (b) B-side
Exterior
Interior
1 13 2 3 5 4 12 7 8 6Interior
1 13 2 3 3 5 12 7 8 6 3 4(a) (b)
Measurement and observation
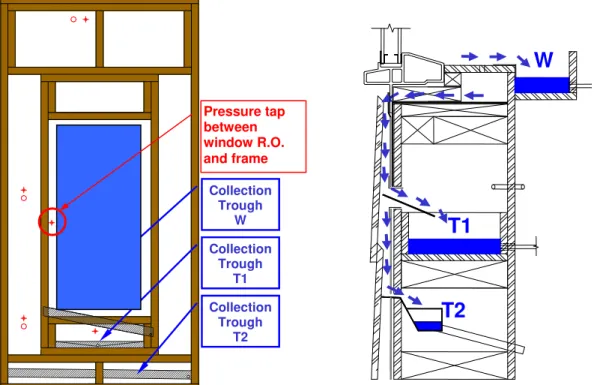
Measurement was devised for water that penetrated into the test specimen by co i e 6 and Figure 7*. Figure 6 offers an illustration of the trough locations bo llection trough at the window (W), beneath and collecting water drainin il
ackside of the cladding and the WRB at the base of specimen (T2). A e 7 that in addition shows the location of a subsill collection tray (ss) o
en B-W1.
Water accumulating and drained from the sill could be collected in o nd the cladding and water running down the face of the WRB, would be gh T2. In the case of specimen B-W3 an additional trough was incl d to co
nd both the cladding and the WRBand thereafter run d he face of the bac llect th in m s tion sed i on in elevati l (T1) a of this arr n Test t
troughs located as shown in
Figur on and section views showing
a co nd another located betwee
the b angement is given in
Figur rial 4 on the A-side of
specim
ugh ; ts w
behi collected near the base of the wall i
trou llect er that m pe ate
behi kup wall (acrylic sheathing) to
collect near the base of the wall in trough T3 (Figure 4c).
Nominally, the use of troughs permitted quantifying the amount a ate of w ry a ere ath and differentiating the significance of these paths given different test c tions. W llect r in respective troughs were calculated in ml/min and the results presented r res i t om rates of collection obtained in the various test trials are also provided in e ph)
As indicated previously, use of acrylic sheet as interior and exterior p b a er intrusion. It also allowed personnel conducting the tests to see where water that penet en e Throughout the testing, no permeation of the WRB membrane was observed, and because there were no staple penetrations, breach of the WRB at locations removed from the window meter was n r d
Penetrating water
Measurement was made of water collected from the rough openin elow th l he base of the wall behind the siding. As is more fully described la series ou t imen g fro varia nly u n ay n s inal d. collecti n tro T1 water finding i
ude nd r ondi in the d gallon sheath wat ent r co figu ur (g itted o ight diff ates ng to tion of netr nt p the he n wat own t ater ate ent r ho erm long ion relat . serv iffe s p ing
rated the specim was direct
peri g (b of f eve it si s was observe l) and als perform . o fro ed o e un trial m t n spec ter, a r tes *
These figures do not provide all interface details as these have already be in he information provided relates to the location of water collection troughs.
B-W1 and a series of two test trials was performed on specimen B-W3. In some of the test trials of specimen B-W1, en B-W3, the joint between the window and the siding was left open (i.e. not caulked). Water entry between the siding and the window was anticipated when the joint was left open, and was considered possible when the joint was caulked. Water that was to the exterior of the window’s bottom flange was and in both of the test trials of specim
Figure 6 – Notional sketch of collection trough locations showing collection trough at window (W), beneath and collecting water draining from sill (T1), between backside of cladding and back-up wall at base of wall (T2). Location of pressure taps are shown in elevation sketch as (+ – located in stud cavity) and (o – located behind cladding (T2)
Figure 7 – Notional location of collection trough with subsill (ss) water collection tray
W
Collection Trough W Collection Trough T2 Collection Trough T1T1
T2
Pressure tap between window R.O. and frameT1
T2
ss
Subsill Collection Tray Collection Trough T1 Collection Trough T2 Pressure tap between window R.O. and frameassumed to have entered below the window’s sill and not to have entered the rough opening. Efforts were taken to separate water on opposite sides of the window’s bottom flange.
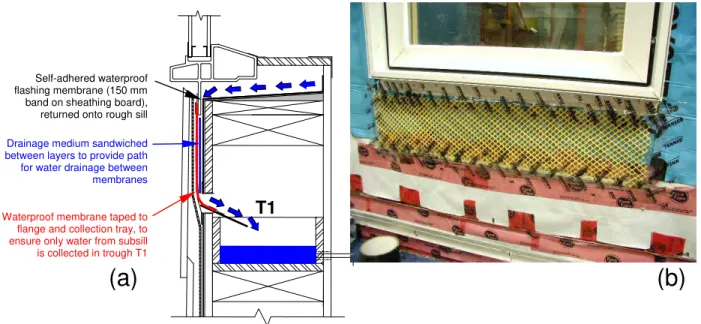
The means to accomplish this differed for specimens B-W1 and B-W3. For specimen B-W1, a drainage medium of similar thickness a was used*, and was placed in the plane of the flange, located below it. A vertical sectio n on the B-side of specimen B-W1, at the sill, is shown in Figure 8a. A frontal photo on (taken at a moderately advanced stage of fabrication) is shown in Figure 8b. The photo shows the section of drainage medium that was used to direct water that might drain from the sill to the collection trough (T1) and the interface of this drainage medium with the lower (sill) flange of the window. The expected path of water drainage from the sill to the water collection trough (T1) beneath the sill is depicted in Figure 8a. The sketch shows that the section of drainage medium extended through a slot in the sheathing to collection trough T1, which was located inside the wall.
As will be discussed later in this manuscript, four test trails were conducted on specimen B-W1. For the last of sill ng t of water that
bsill area were 4d.
s the window flange nal view of the installatio
graph of the installati
these, the A-side of this specimen was altered to include a sill collection trough (Figure 7). The purpose of the sub-collection trough was to estimate the amount of water that, during a previous test trail, penetrated into the rough openi and failed to drain from it. Stated in a different way, the use of the sub-sill permitted estimating the amoun
accumulated at the sill and thus could not be collected in trough T1 from prior testing without the sub-sill. For each window installation of specimen B-W3, the collection troughs for water entering the su located in the space between the sheathing and the siding as shown in Figure 4a, Figure 4b and Figure
*
This drainage medium was for measurement purposes and was present on both the A-side and the B-side of specimen B-W1; it is purposely not shown in Figs. 6 and 7. This drainage medium, being roughly the thickness of
the window fla re, of side B
of specimen B-W1.
of specimen B-W1 showing path of supposed
water dra r to
Figure 8 — (a) Vertical sectional view of the installation on the B-side
inage from sill to collection trough T1; (b) Photo of B-side of specimen B-W1 showing assembly prio installation of drainage mat
Self-adhered waterproof ng membrane (150 mm band on sheathing board), returned onto rough sill flashi
Drainage medium sandwiched between layers to provide path for water drainage between membranes
Waterproof membrane taped to ensure only water from subsill is collected in trough T1 flange and collection tray, to
T1
Air pressure differential
Risk of water entry can be inferred from knowledge of the degree of pressure drop across a supposed plane of water tightness, the presence of water at that plane, and openings through which water can pass. Measuring the pressure drop in these test trials thus provided a means to infer the risk to water entry to the rough opening along the periphery of the wall-window interface given openings through which water could pass. Air pressure differential
ns across the test specimen; the location points for monitoring of differential e elevations sketches of Figure 6 and 7. The location of the pressure tap between the window rough op nd the window frame is also shown; measurements from this location permitted
determining the pressure difference across the window flange. As indicated previously, Figures 6 and 7 relate to the A-side of specimen B-W1; differential air pressure measurements were made in similar locations on the B-side of
The primary plain of air tightness of the test specimens was the acrylic sheet referred to as the air barrier system (ABS). The airtightness of the ABS was controlled at the nominal leakage rate by cutting holes in the acrylic sheet (in a distributed manner) on the interior surface of the wall (where gypsum board would normally be used as interior finish). Thus a series of holes provided an air leakage rate of 0.8L/s-m2 at a pressure differential of 75 Pa. across the specimen. The 0.3 ABS condition was obtained by closing the holes with tape, as many as needed to reach the target nominal air leakage rate at 75 Pa pressure differential.
was monitored at various locatio pressure are provided in th
ening a
sp
being sprayed) and various framing cavities was measured, with the pressure differential between the exterior and the rough opening airspace (the “perimeter cavity”) being of particular interest (Figs. 6 and 7). The window flanges provided an evident barrier between the exterior and the rough opening airspace. Differential pressure between the exterior and the rough opening airspace was thus considered as largely characterizing the wall-window interface. For the A-side of test specimens B-W1 and B-W3 the location point for this measurement can be identified in the elevation sketches in Figures 6 and 7, i.e. along the window framing stud on the left side of the rough opening at mid height; whereas, for the B-side, this point was on the right side of the rough opening at mid height.
Variations in air leakage of the air barrier system
Test Trials and deficiencies
ates -m2
2
Test specimen B-W1 was subjected to four test trials, as outlined in Table 2. It should be noted that for all trials, a sequence of tests were performed at a series of three water spray rates, and at any single water spray rate, differential air pressure across the wall was stepped through a series of pressures ranging from 0 to 700 Pa.
Table 2 — Test trials and parameters for specimen B-W1
Test trial Description Exterior Perimeter seal Deficiencies ABS* Spray r L/min (gal/hr-ft ) 1
effect of ABS leakage rate on water entry
0.8, 1.6, 3.4 cascade, (1.2, 2.4, 5) As constructed – Intent: to determine No None 0.3
No None 0.8 Same as above
2
Sealant and backer rod added between window frame and cladding, full perimeter – Intent: compare with results of Trail 1 at 0.8 ABS condition to characterize the influence of the exterior perimeter seal
Yes None 0.8 Same as above
3
Un-plug small openings in window corners – effect of deficiencies on water entry to sill area of rough opening
Yes Present 0.8 Same as above
4
Same as Trial 3, except with a subsill
Yes Present 0.8 Same as above collector trough added to A-side of
specimen to estimate rate of accumulation at sill
*Air Barrier System – ABS leakage rates of 0.3 and 0.8 L/s-m2 (0.06 and 0.16 cfm/ft2)
d in a relatively airtight condition (nominal leakage rate 0.3 L/s-m2 at 75 Pa.) and thereafter in a less airtight condition (nominal leakage rate 0.8L/s-m2 at 75 Pa). As indicated in Table 2, for the second, third, and fourth series of trials, specimen B-W1 was tested in the nominal 0.8 ABS condition only. As also indicted in the Table, the first test trial was conducted without an exterior perimeter seal, whereas for the subsequent three test trials the gap between the window frame and the cladding was sealed (by use of backer rod and elastomeric sealant). The intent in this instance was to determine the influence of sealing the perimeter gap on water penetration into the rough opening.
Deficiencies were not included in the first two test trials whereas the contribution of water entry through small rs was estimated from results of the final two test trials; a description of the deficiency in the window corner for B-W1 is given in a subsequent section (see § Deficiencies).
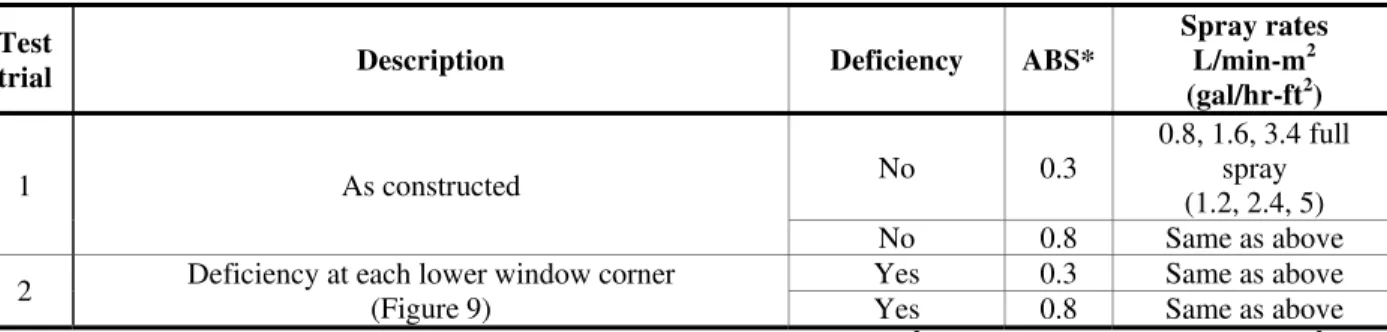
Test specimen B-W3 was subjected to two test trials, as outlined in Table 3. The different trials permitted estimating the effect of including a deficiency in the window corners on the water entry to and subsequent drainage from the sill.
Table 3 — Test trials and parameters for specimen B-W3
trial Description Deficiency ABS*
S openings in the window corne
pray rates Test L/min-m2 (gal/hr-ft2) 1 A 0. l (1.2, 2.4, 5) s constructed No 0.3 8, 1.6, 3.4 ful spray No 0.8 Same as above Yes 0.3 Same as above Deficiency at each lower window c
(Figure 9)
orner 2
Yes 0.8 Same as above
* A kage of 0.3 L/s-m2 (0.06 cfm/ft.2); 0.8 ABS - 0.8 L/s-m2 (0.16 cfm/ft.2)
D cie e respe window e ll spe
W3 are t of including deficiencies in the window components was to simulate conditions of a pre that had deteriorated over time; either would be expected to result in
water p ening orming defic s per
determi of the robustness of the flashing details and allowed observation of the manner in which penetrating wate
w. sealed
BS – air barrier system; 0.3 ABS – ABS lea
efi ncies — The locations of deficiencies in th given in Figure 9. The inten
ctive s for either sid of wa cimen W1 or
B-maturely failed window or of a window enetration into the sill space of the rough op nation
. Perf trails with iencie mitted
r was managed.
As can be seen in Figure 9a, the deficiencies are located at the lower and opposing corners of each windo For specimen B-W1 (Figure 9b) the deficiencies were approximately 1-mm in diameter. These openings were with elastomeric sealant for those test trials in which no deficiencies were being tested as shown in Figure 9c. Similar size openings were placed at the lower corner of the windows of specimen B-W3 as shown in Figure 9d. When specimen B-W3 was tested with no deficiencies (i.e. B-W3 Test trial 1 “As constructed”), these openings were likewise sealed with caulking as was done with the other specimen.
Figure 9 — (a) Pictorial representation showing front elevation of test specimen (cladding exterior) and nominal location of deficiencie
at lower right corn
s at lower corners of windows; (b) Photo of specimen B-W1 of deficiency (ca. 1-mm diameter) er of window; (c) Photo of specimen B-W1 showing lower right hand corner with deficiency “plugged” with sealant; (d) Specimen B-W3 showing” un-plugged” lower right corner of window
Deficiency at window corners
(b)
(a)
Selected Results from Tests on B-W1
In the test trials reported for this test specimen, water spray was applied in the cascade spray rates, and with air pressure differential at each spray rate stepped through seven differe reported in terms of water collection rates as related to spray rates and to air pressure differe specimen. The rates of collection are given in ml/min. Equivalent rates expressed in gallons
rovided in the text, but are (at selected values) shown graphically in the respective figures.† Test Trial 1 (Comparison of 03 and 08 ABS leakage conditions; no caulking or backer rod a
As expected, increasing the nominal air leakage rate of the wall (by unplugging holes i resulted in exertion of a greater proportion of the pressure differential across the wi
ABS condition, the proportion of the pressure differential across the wall exerted on the windo reater on the A-side of the specimen (~ 11 % for the 0.3 ABS condition and < 85% for the n the B-side of the specimen (< 3% for the 0.3 ABS condition and < 45% for the 0.8 AB levels to which the specimens were subjected.
Water collection rates in trough T1 at the 0.3 ABS leakage condition was as great as 20 water deposition rate. Rates of collection were highly dependent on the pressure difference acro not dependent on the water spray rate applied onto the cladding. Rates of collection were bo more significantly from an increased ABS leakage on the A-side (ASTM) side as compared to t
format at three different nt levels. Results are ntial across the
per hour (gph), are not p
t window perimeter)
n the interior ABS) ndow-wall interface. At either
w-wall interface was
g 0.8 ABS condition) than
o S condition) at all pressure
ml/min at the highest ss the assembly and th greater and increased he B-side; increases
63 mL/m ion and
the highest applied differential pressure, rates of up to 110 ml/min and 60 ml/min were obtained on the A-side (ASTM) and B-sides respectively.
in maximum rates from the 0.3 to the 0.8 ABS condition ranged from 30 mL/min to 116 mL/min, and 7mL/min to in for the A-side and B-side respectively. As shown in Figure 10, at the 0.8 ABS air leakage condit
†
Water collection rates in gal/hr (gph) are obtained by multiplying ml/min by 0.016; e.g. 20ml/min: 0.32 gal/hr; e.g. in Figure 10, rates of collection of 40, 80 and 120 ml/min are given as 0.63, 1.27 and 1.9 gph respectively.
Figure 10 — B-W1 Test Trial 1 – Water collection rates to trough T1 in relation to
2 2 2
(5
2
gh T2 was lower on the A-side (ASTM); it was below 100 ml/min for the majority of test conditions. Water collection rates at T2 on his side of the wall was less than 20 ml/min at low pressure differentials, and increased with progressively higher differential pressure to a maximum of 126 ml/min at 700 Pa. Trends in collection rates at T2 at the 0.8 ABS condition were similar to those observed at the lower ABS leakage rate (0.3 ABS).
applied pressure differential at 08 ABS for rates of water spray of 0.8, 1.6 and 3.4 L/min-m2
The water collection rate to trough T2 (Figure 11) was very high, (up to 700 ml/min) on the side of the wall where the cladding was spaced and installed over a drainage mat (the B-side). Rates of collection were dependent on cascade rate and were relatively constant across the full range of chamber pressure conditions, increasing from ~400 ml/min at the 0.8 L/min.-m (1.2 gal/ft. -hr) cascade rate, to ~650 ml/min at a cascade rate of 3.4 L/min.-m gal/ft. -hr). Water collection at trou
t
B-W1: Water collection to trough T2 - 08 ABS
600 700 800 mi n ) 0 100 300 00 200 4 0 100 200 300 400 500 600 700 800 Water E n l/ 500 try ( m
Chamber Pressure (Pa)
B-side Trough T2 - 08 B-side Trough T2 - 16 B-side Trough T2 - 34 A-side Trough T2 - 08 A-side Trough T2 - 16 A-side Trough T2 - 34 4.2 psf 8.4 psf 14.6 psf 1.6 gph 4.8 gph 7.9 gph 11.1 gph B-W1 08 ABS No Modifications B A
B-W1: Test Trial 1 - Water collection to trough T1 - 08 ABS
100 120 140 200 0 100 200 300 400 500 600 700 800 a t tr l/ 0 20
Chamber Pressure (Pa) 40 60 80 160 W e r En y (m mi n) 180 B-side Trough T1 - 08 Cascade B-side Trough T1 - 16 Cascade B-side Trough T1 - 34 Cascade A-side Trough T1 - 08 Cascade A-side Trough T1 - 16 Cascade A-side Trough T1 - 34 Cascade 4.2 psf 8.4 psf 14.6 psf 0.63 gph 1.27 gph 1.9 gph B A T1
Figure 11 — B-W1: Test trial 1 – Water collection rates to trough T2 in relation to
applied pressure differential at 08 ABS
Test Trial 2 (Window perimeter sealed with caulking)
As previously indicated (Table 3), in this test trial, a caulk seal (consisting of backer rod and sealant) was applied between the window frame and cladding. With the perimeter joints along the window frame sealed, water collection rates to trough T2, located at the base of the wall, were reduced significantly (Figure 12). The B-side showed a significant decrease from 703 mL/min (in Test trial 1) to 18 mL/min (in this trial). On the A-side (ASTM),
collection rate at T2 decreased from a high of 126 mL/min to no water collection. Collection rates to trough T1 also decreased although less significantly. On the B-side the maximum rate at T1 decreased modestly (63 mL/min in Trial 1) versus 55 mL/min in Trial 2). On the A-side (ASTM) the maximum rate at T1 decreased appreciably, (116 mL/min in Trial 1) versus 35 mL/min in Trial 2); the decrease at T1 was nonetheless of lesser degree that at T2.
Figure 12 — B-W1: Test Trial 2 (Win ow perimeter sealed with caulking) -
Water collection rates to trough T2 in relati to applied pressure differential at 08 ABS
Test Trial 3 (Window perimeter sealed and deficiencies at window corners)
Collection rates with deficiencies at the window corners (leakage paths though holes in the window frames) were very similar to those in the previous trial (when leakage paths through the frames were plugged). Corner deficiencies appeared to have little to no effect on rates of collection on the B-side (Figure 13); rates of water collection in trough T1 increased very modestly (from 55 to 67 mL/min) at the highest spray rate (3.4 L/min-m2). On the A-side (ASTM) at pressure differentials above 300 Pa (6.3 psf), water drainage to collection trough T1 dropped off. At test pressures above this level, water was observed collecting on the rough sill indicating that drainage from the sill area of the rough opening was not effective. In contrast on the B-side of the specimen, water drained to trough T1 at all levels of applied pressure differential.
d on B-W1: Test Trial 2 - W 400 800 0 100 200 300 400 500 600 700 800
Chamber Pressure (Pa)
te
try
mi
ater collection to Trough T2 - 08 ABS
0 100 200 300 500 600 W a r En (ml / n) 700
B-side Trough 2 - 08 Cascade B-side Trough 2 - 16 Cascade B-side Trough 2 - 34 Cascade A-side Trough 2 - 08 Cascade A-side Trough 2 - 16 Cascade A-side Trough 2 - 34 Cascade
T2
4.2 psf 8.4 psf 14.6 psf
1.6 gph 6.3 gph
Fig
Wa
Test Trial 4 (Window perimeter sealed, deficiencies at window corners, subsill collection tray) ure 13 — B-W1 Test trial 3 (Sealed Perimeter with caulking removed in corners) –
ter collection rates to trough T1 in relation to applied pressure differential at 0.8 ABS
The subsill collection tray that was added to the A-side of the specimen confirmed that the drop-off in collection at T1 that was observed in the third trial at higher differential pressures for the window installed in accord with ASTM E 2112 was not reflective of a decrease in water entry into the sill area of the rough opening, but instead was because water that entered this subsill region was unable to drain from the region at the higher levels of pressure differential (Figure 14).
Recalling the results of Test trial 3, water was observed to collect in trough T1 on the A-side (ASTM) up to a differential pressure of 300 Pa (6.3 psf), after which collection in the trough decreased. A plausible explanation for this observation is that at pressures in excess of 300 Pa, pathways that permitted drainage from the subsill area were restricted. In the fourth trial, the rates of collection at subsill collection tray up to 300 Pa pressure differential were similar to the rates of collection in trough T1in the third trial. This suggests that substantial drainage from the subsill area occurred up to 300 Pa, but that beyond this level drainage became increasingly restricted.
B-W1: Test Trial 3 - Water collection to Trough T1 - 08 ABS
0 20 40 60 80 100 120 140 160 180 200 0 100 200 300 400 500 600 700 800
Chamber Pressure (Pa)
Wa te r Entr y ( m l/m in)
B-side Trough T1 - 08 Cascade B-side Trough T1 - 16 Cascade B-side Trough T1 - 34 Cascade A-side Trough T1 - 08 Cascade A-side Trough T1- 16 Cascade A-side Trough T1- 34 Cascade A-side trapped in subsill (estimate) - 34 Cascade 4.2 psf 8.4 psf 14.6 psf 0.95 gph 1.9 gph 2.9 gph B A T1
Figure 14 — B-W1 Test Trial 4 (Sealed Perimeter with caulking removed in corners) Collection rates to trough T1
usly in Table 3, specimen B-W3 was subjected to two (2) test trials, and in each of these trials
4 with igures 6, 7 and 8), different than in specimen B-W1. Results are reported in terms of the maximum rates of water ollection in the various collection troughs (Table 4), with collection amounts identified by specimen side, ABS
in relation to differential pressure across specimen at 0.8 ABS. Subsill collection tray on A-side (ASTM)
Selected Results from Tests on B-W3
As indicated previo
the spray format was full spray (as opposed to cascade format). Although the spray format was different than in the trials conducted on specimen B-W1, specimen B-W3 was prepared to the same ABS leakage conditions (0.3 and 0.8 ABS) as specimen B-W1. In addition, the series of spray rates and pressure differentials followed in the two trials conducted on this specimen (B-W3) were the same as those followed in the trials conducted on the other specimen (B-W1).
The configuration of collection troughs in this specimen was, (as can be seen by comparing Figure F
c
B-W1: Test Trial 2 - Water collection at subsill and trough T1 - 08 ABS
0 20 40 60 80 100 120 140 160 180 200 0 100 200 300 400 500 600 700 800
Chamber Pressure (Pa)
Wa te r Ent ry (ml /mi n)
B-side Trough T1 - 08 Spray B-side Trough T1 - 16 Spray B-side Trough T1 - 34 Spray A-side Trough T1 - 08 Spray A-side Trough T1 - 16 Spray A-side Trough T1 - 34 Spray A-side Subsill (ss) Trough - 08 Spray A-side Subsill (ss) Trough - 16 Spray A-side Subsill (ss) Trough - 34 Spray
4.2 psf 8.4 psf 14.6 psf 0.95 gph 1.9 gph 2.9 gph T1 ss
A
B
leakage condition during test, and presence or absence of window deficiencies during test. Collection rates in trough T1
Tria
, which collected drainage from the sill pan, are plotted in Figure 15.
Table 4 — Test Trial Sets 1& 2 - Threshold conditions for water entry
Test l
Maximum rate of water collection in respective troughs (ml/min)
ABS Leakage
Deficiency
WRB set-up after window installed (i.e. Window installed before WRB)
WRB set-up before Window installed (i.e. Window installed after WRB) T1 Window sill reservoir T2 Behind siding T3 Behind WRB T1 Window sill reservoir T2 Behind siding T3 Behind WRB
1 0.3ABS No 215 704 Nil 8 995 Nil
0.8ABS No 197 509 Nil 7 705 Nil
2 0.3ABS With 120 1139 Nil 39 931 Nil
0.8ABS With 328 1013 Nil 99 1130 Nil
Resu
Table 4 indicates that when the WRB was installed before the window, and the window did not have d
even er
condition of the interior air barrier system (0.3 or 0.8 L/s-m2). In contrast, when the WRB was installed after the ost extreme combination of spray rate and pressure differential was roug
ions ent sheathing materials suggested however that the pan flashing system could successfully mana
lts for Test Trial Set 1 — No deficiencies in the wall
eficiencies, very little water ( <10 ml/min) was collected in trough T1 (the trough that collected from the sill pan), at the most extreme combination of spray rate and pressure differential. This was moreover the case at eith
window, the collection rate at T1 at the m
hly 200 ml/min (the rate was, as with the other sequencing of window and WRB installation, apparently unaffected by ABS condition). There were multiple layers of jamb flashing material when the WRB was installed after the window (see Figure 5). A slightly higher pressure drop across the wall-window interface was observed on the this side of the specimen at the same across-specimen pressure differential. This difference in pressure across the wall-window interface could explain the greater measured rate of water entry into the rough opening. Observat through the transpar
Figure 15 - B-W3: Water collection rate (T1) in relation to pressure difference across wall at 08 ABS air leakage
gh T2) at
f
l/min
n re WRB, water was observed to occasionally intrude behind the WRB through the layers of flashing (Figure 16 and Figure 17). It was ne r of sufficient quantity however to find its way to collection trough T3 (Figure 5c).
On either side of the specimen appreciable amounts of water were collected behind the cladding (Trou the most extreme combination of spray rate and differential pressure (Table 4). For a each installation, the collection rates were somewhat higher when the ABS condition was relatively tight. Conversely, at the same sets o ABS condition, the collection rate in T2 was somewhat higher for the side of the specimen where the window was installed after the WRB (705 and 995 ml/min for 0.3 and 0.8 ABS conditions respectively versus 509 to 704 m at the same set of ABS conditions). These differences are of modest relative magnitude; they are essentially unimportant, inasmuch as the collection rate values at T2 (at the most extreme combination of spray rate and pressure differential) exceed 500 ml/min. These high rates reflect the fact that the joint between the cladding and the window frame was neither caulked nor had J-trim been used to complete the joint along this interface. Hence water had a ready entry path along the gap between the cladding and the window. No water was collected behind the WRB indicating that the overlapping details for the WRB effectively restricted water entry. In the installatio where the window was installed befo
ve 0 50 1 150 200 250 10 200 400 500 0 7 800
Chamber Pressure (Pa)
Wa te y m in )
B-W3: Water drainage from sill to trough T1 - 08 ABS
00 0 0 300 60 00 r E n tr (ml /
WRB before Window Window servoir - 08 y Re Full Spra WRB before W indow
servoir - 34 indow Wy Re Full Spra Window before indow
servoir - 08 F ay WRB W Re ull Spr Wi
Re
ndow before indow servoir - 34 y
WRB W Full Spra WIN WRB
Figure 16 — B-W3 – Observed water leak behind WRB at the bottom corner of the window flashing; window installed before WRB; testing with no deficiencies
Figure 17 — B-W3 – Observed water leak behind WRB at the bottom corner of the window flashing; window
Discussion
Test results relating to specimen B-W1 are discussed first, followed by discussion of results relating to specimen B-W3.
Results from tests on specimen B-W1
Pressure differential between the exterior and the rough opening - Throughout the tests, this pressure differential,
(which we consider to be the pressure across the w/w interface), was higher on the A-side (ASTM) than on the B-side of the specimen. The A-B-side incorporated a bead of sealant behind all flanges of the window (a continuous bead at jamb and head flanges and a discontinuous bead at the sill flange). The sealant was intended to seal the flange to the WRB. In contrast, the window installed on of the B-side of the specimen did not have this seal. The likely cause of this higher pressure drop was restriction of air movement across the wall-window interface when the window flanges are bedded in sealant; the restriction of air movement evidently increased the pressure fferential across the plane of the seal.
Wall-Window Interface Water Entry – Collection to trough T1 — The method of window installation for the A-side
(ASTM) of the wall is intended to prevent water from attaining the subsill area whereas the B-side (S-PFP) details are intended to manage water that penetrates the wall-window interface by collection at and drainage from the sill. Because of these fundamental differences in rainwater management strategy, two distinct results would be expected between these two approaches to window installation practice.
Twice as much water collection in trough T1 (drainage from the sill) occurred on the A-side as compared to the B-side even though neither window had evident deficiencies. The efforts to block water entry through a sealed interface were evidently ineffective. Leakage paths were assumed to be blocked by sealant, and the windows contained no known leakage paths, but water nonetheless entered the rough opening.
In the installation on the A-side of the specimen, self-adhering flashing membrane was applied over the jamb flanges, this presumably added another layer of protection from water entry (in addition to the sealant behind the flange). However in locations where the self-adhering flashing failed to adhere to the window flange or to the WRB, the non-adhered areas could provide paths for water entry. Removal of the lap siding from the specimen foll
certain locations. This created ope ). The fish mouths proved to be di
owing completion of the test trials, it was found that the self-adhered flashing had lost adhesion to the WRB in nings sometimes called “fish mouths” (Figure 18
leakage paths. Several “pour test” into these openings located along the jambs showed that water that entered at these
ings for water entry exist, the presence of water at these locations combined with a pressure differential necessarily brings about water penetration. As previously mentioned, at the same differential pressure across the assembly, the pressure drop across the A-side was greater than the B-side. This evidently raised the
n locations reached collection trough T1.
Given that open
potential for water entry. This is almost certainly the reason why greater amounts of water accumulated at the sill o the A-side of this specimen than on the B-side.
ght) of B-W1
This explanation for water entry is furthermore supported by the observation (reported previously) that water collection to trough T1 for either side of the specimen showed a high dependence on pressure differential across the specimen and no dependence on the water deposition rate on the cladding. This would be indicative of water occluding small openings and being driven through these openings at rates of penetration dependent on the capacity of the openings to admit water and the pressure difference across them.