Publisher’s version / Version de l'éditeur:
Procedia Engineering, 2, 1, pp. 1673-1682, 2010-04
READ THESE TERMS AND CONDITIONS CAREFULLY BEFORE USING THIS WEBSITE. https://nrc-publications.canada.ca/eng/copyright
Vous avez des questions? Nous pouvons vous aider. Pour communiquer directement avec un auteur, consultez la première page de la revue dans laquelle son article a été publié afin de trouver ses coordonnées. Si vous n’arrivez pas à les repérer, communiquez avec nous à [email protected].
Questions? Contact the NRC Publications Archive team at
[email protected]. If you wish to email the authors directly, please see the first page of the publication for their contact information.
Archives des publications du CNRC
This publication could be one of several versions: author’s original, accepted manuscript or the publisher’s version. / La version de cette publication peut être l’une des suivantes : la version prépublication de l’auteur, la version acceptée du manuscrit ou la version de l’éditeur.
For the publisher’s version, please access the DOI link below./ Pour consulter la version de l’éditeur, utilisez le lien DOI ci-dessous.
https://doi.org/10.1016/j.proeng.2010.03.180
Access and use of this website and the material on it are subject to the Terms and Conditions set forth at
Fatigue analysis for CF-18 component:wing fold shear-tie lug
Liao, Min; Renaud, Guillaume
https://publications-cnrc.canada.ca/fra/droits
L’accès à ce site Web et l’utilisation de son contenu sont assujettis aux conditions présentées dans le site LISEZ CES CONDITIONS ATTENTIVEMENT AVANT D’UTILISER CE SITE WEB.
NRC Publications Record / Notice d'Archives des publications de CNRC:
https://nrc-publications.canada.ca/eng/view/object/?id=d60e9b05-10f7-47d8-97ad-2c564418afb0
https://publications-cnrc.canada.ca/fra/voir/objet/?id=d60e9b05-10f7-47d8-97ad-2c564418afb0
Available online at www.sciencedirect.com Procedia Engineering 00 (2009) 000–000
Procedia
Engineering
www.elsevier.com/locate/procediaFatigue 2010
Fatigue Analysis for CF-18 Component:Wing Fold Shear-Tie Lug
Min Liao
a*, Guillaume Renaud
ba*
a
Institute for Aerospace Research (IAR), National Research Council Canada (NRC), Ottawa, K1A 0R6, Canada
b
Institute for Aerospace Research (IAR), National Research Council Canada (NRC), Ottawa, K1A 0R6, Canada Received 9 March 2010; revised 9 March 2010; accepted 15 March 2010
Abstract
This paper presents the results of a fatigue analysis of a CF-18 aft wing fold shear-tie lug, which involved multiple crack nucleation sites and short crack growth under complex geometry and loading conditions. A three-dimensional (3D) finite element model was developed to simulate the loading applied in the shear-tie lug test and determine the local stress/strain distribution. Short crack data and the subsequent material model, were specifically developed for the lug material (7050-T7452 forging), in which work the Holistic Structural Integrity Process (HOLSIP) approach was used to correlate the short crack model with material microstructural features, such as constituent particles and porosities. After the shear-tie lug fatigue test, quantitative fractography (QF) was carried out to measure the crack growth size. Based on the failure mechanisms, a simplified single crack model was proposed to analyze this multiple crack growth problem, and the life estimation compared well with the test results.
Keywords: Life Prediction; HOLSIP; Short Crack; FEM; Fractography; 7050;
1. Introduction
Numerous cracks were found in-service on CF-18 wings, at the root upper radius of the aft wing fold shear-tie lug. Thereafter, the Canadian Forces (CF) tasked the National Research Council Canada (NRC) to carry out a component fatigue test and collect crack growth data at the shear-tie lug [1]. In addition to the fatigue test, NRC carried out a fatigue analysis to estimate the fatigue life of the shear-tie lug. Due to the multiple cracking mechanisms, complex lug geometry, and wing buffeting-induced dynamic spectrum loading applied to this component, a conventional fatigue analysis could not provide a good estimation of the fatigue life. Consequently, large scatter factors were used for lifing this or similar components [2] and the original safe-life based management approach was deemed not practical for such structural components [3].
In collaboration with other organizations, NRC is developing HOLSIP (Holistic Structural Integrity Process) to augment the traditional safe-life and damage tolerance paradigms, with the ultimate goal to evolve HOLSIP into a new paradigm for both the design and sustainment stages. Physics-based life prediction models are employed in HOLSIP to address material microstructure, surface integrity, and synergetic interaction between cyclic and environmental effects. Some successful applications of HOLSIP have been previously presented in the FATGUE2002 conference [4]. This paper presents a fatigue analysis of the CF-18 shear-tie lug using the HOLSIP
* Corresponding author. Tel.: +1-613-990-9812; fax: +1-613-952-7136. E-mail address: [email protected].
c 2010 Published by Elsevier Ltd. Procedia Engineering 2 (2010) 1673–1682 www.elsevier.com/locate/procedia 1877-7058 c 2010 Published by Elsevier Ltd. doi:10.1016/j.proeng.2010.03.180
Open access under CC BY-NC-ND license.
based short-long crack material model. First, a simplified but effective 3D FE modeling was developed to simulate the test loading and accurately determine the local stress/strain distributions. Then a simplified crack model was proposed to simulate the multiple crack growth problem, and provide a total life simulation based upon the short crack material model, 3D FE stress distribution, and QF based crack growth data.
2. Fatigue Test
The fatigue test, named FT312, was designed to locally test the wing fold aft-spar shear-tie and simulate the initial crack nucleation. This area was then repaired by the overhaul contractor by blending the damaged area; and the modified structural element was tested under fatigue loading to determine if the structural modification was adequate to meet the life objective in accordance with the lifing policy for this aircraft [1].
The FT312 test was composed of three parts: Part 1 fatigue cycling was performed to generate cracks similar to that found in-service. After the crack was excised for quantitative fractography (QF) and the area was repaired by a typical in-service hand blending and polishing, Part 2 test continued on the post-modification lug to generate crack growth data under a representative aircraft spectrum. Part 3 was a residual strength test which failed the post-modification lug. The fracture surface was then used for a QF study to obtain the crack growth data.
2.1. Test specimen and setup
The test specimen for FT312 was retained from the original IFOSTP (International Follow-on Structural Test Project) FT245 wing test. This wing component was retired after having accumulated about 60% of one RLLs (repeated load lifetimes). Note the wing fold shear-tie area of this wing had not been loaded during FT245 testing. The test article shear-tie lug was installed in its original position on the left side of the fuselage, along with a reaction system consisting of a contour board with solid struts, as illustrated in Figure 1 (a). Although a single actuator was used to apply loads directly to the shear-tie lug (Figure 1 (b)), the entire test setup was close to the actual situation with all the supporting wing and fuselage structures.
Figure 1 FT312 test set-up, (a) actuator load cell installation; (b) loading lug and digital image correlation camera [1]. 2.2. Loading spectrum
The spectrum contained two blocks, each representing one year of flying. One block (even numbers) assumed that the wing tip missile had fins fitted (fins-on), and the other (odd numbers) assumed the fins had been removed (fins-off). Both spectra were truncated by removing the smallest end loads that had an accumulated damage equivalent to 15% of the total damage. For the post-modification spectrum, the peak and valley loads were lowered
by approximately 8% and the number of cycles was shortened. The post-modification spectrum had 14,656 end levels for the fin-on and fins-off sequence, as illustrated in Figure 2 (a).
Post-Modification Spectrum FT312 Wing Fold Shear Tie Two Block Spectrum
-0.8 -0.6 -0.4 -0.2 0 0.2 0.4 0.6 0.8 0 2000 4000 6000 8000 10000 12000 14000 Spectrum Line Number
Lo a d / De s ign Li mi t L oa d
0 to 7356 Lines No Fins Block 7357 to 14660 Lines Fins Block
Peak Load / Design Limit Load Critical Strain Conditions Post-Alex 66.2
0 200 400 600 800 1000 1200 -5 -4 .3 -3 .6 -2 .9 -2 .2 -1 .5 -0 .8 -0 .1 0. 6 1. 3 2 2. 7 3. 4 4. 1 4. 8
Load ratio (bin)
F re quen c y 0% 10% 20% 30% 40% 50% 60% 70% 80% 90% 100% Frequency Cumulative %
Figure 2 (a) Post-modification spectrum sequence plot [1]; (b) Statistical plots of spectrum load ratio.
Figure 2 (b) shows that the most frequent load ratios were around R= -0.8, and there were no high R-ratio (R=Pmin/Pmax) loads such as R=0.7 to 1.3. The number of cycles of small loads, i.e., below 5% of the maximum or minimum loads (absolute values), represented about 3% of the total load end levels in the test spectrum. Therefore, the test spectrum did not have too much high R-ratio and small loads.
3. Quantitative fractography (QF)
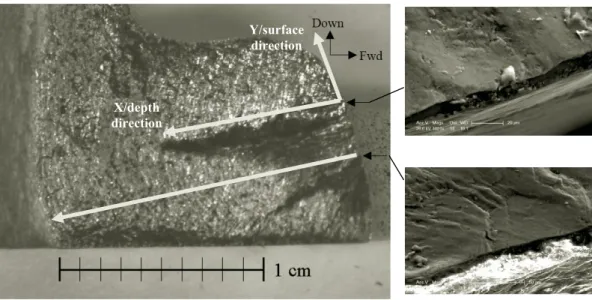
The QF work was carried out at Quality Engineering Test Establishment (QETE) [5] and the Royal Military College (RMC) using SEM (scanning electronic microscopy) [6] for both pre- and post-modification lug fracture surfaces. For the pre-modification lug, multiple cracks were found to nucleate from IVD (ion vapour deposit) pits whose depths were between 5 to 10 Pm. Fatigue striations were clearly visible right after the IVD pits, although the first repeatable crack patterns started from 231Pm. For the post-modification lug, multiple cracks also nucleated in the same location; two main cracks grew and coalesced, as shown in Figure 3. The upper crack nucleation feature was found to be a constituent particle, but the lower cracking feature was not clear, and no clear fatigue striations were observed near the crack nucleation region.
The QF crack growth data are presented, in both linear-linear and log-linear scales, in Figure 4 for the post-modification lug. The first repeatable crack pattern was found starting from 1.053 mm for the upper crack, and 4.979 mm for the lower crack. The two cracks merged at about 9.62 mm and grew to 14.75 mm, where the fatigue test stopped. It is shown that the crack growth curves are like two log-linear curves (Figure 4 (b)), with a knee (changing of slope) at about 3.0 mm. An exponential equation was used to back extrapolate the first linear portion of the data, which led to an initial crack size of 0.157 mm in depth (Figure 4 (b)).
Y/surface direction
X/depth direction
Figure 3 (a) Fracture surface and two main cracks; (b) upper crack nucleation feature: particle; c) lower crack nucleation feature: unclear.
0 2 4 6 8 10 12 14 16 0 0.2 0.4 0.6 0.8 1 Cr a c k si ze ( m m )
Time ratio to post-mod test hours Lower crack growth QF data Upper crack growth QF data y = 0.1573e7.9069x R² = 0.9972 0.1 1 10 100 0 0.2 0.4 0.6 0.8 1 Cr a c k si ze ( m m )
Time ratio to post-mod test hours
Lower crack growth QF data
Upper crack growth QF data
Figure 4 (a) QF crack growth data for the post-mod test, linear scale for crack size; (b) Logarithmic scale for crack size.
4. Stress Analysis using 3D FEM
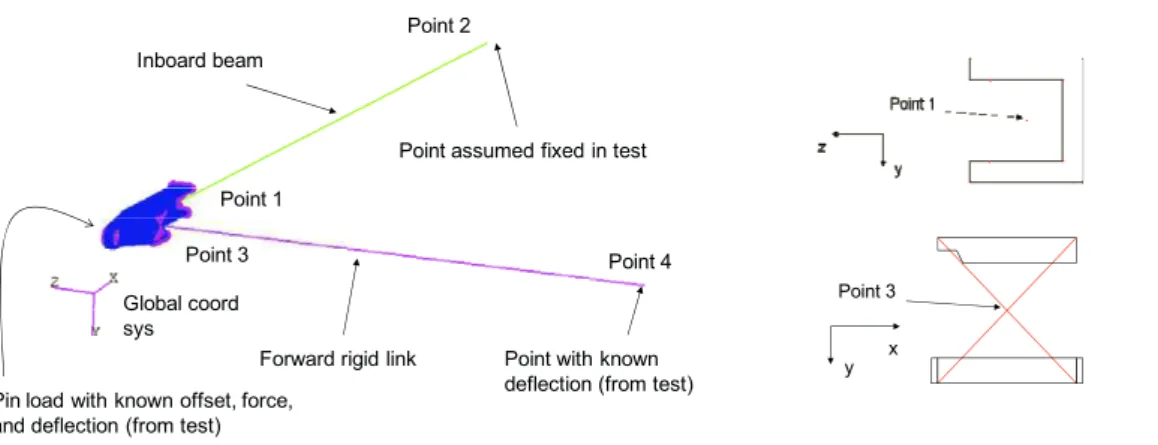
For fatigue analysis purpose, a simple but efficient FE model was developed. To simplify the model, the adjacent structures were not modelled; instead, artificial structural elements were used in the model to attach to the lug to apply the proper boundary conditions that could match the test displacement and strain measurements. These elements, shown in Figure 5, were connected to the lug using multi-point constraints at the points illustrated in Figure 5.
Forward rigid link Inboard beam
Point assumed fixed in test
Point with known deflection (from test) Pin load with known offset, force,
and deflection (from test) Global coord sys Point 1 Point 2 Point 3 Point 4 Point 3 x y
Figure 5 Shear-tie lug FE model, and the inboard beam and forward rigid link attachment points
A detailed parasolid model of the shear-tie lug was obtained using CATIA and the DIC (Digital Image Correlation) data on the cracking location. The shear-tie lug was meshed using linear tetrahedral elements, using higher element densities around the pin hole, the strain gauge locations, and the critical radius area. The meshing strategy was implemented in PCL (Patran Command Language) so that several local mesh parameters were allowed to change in order to calibrate the simplified FE model. A meshed lug and the real part are shown in Figure 6.
Crack
location
Critical location(radius area)
Figure 6 NRC shear-tie lug FE mesh and the real part
Since the FE model did not include the adjacent structures, it was calibrated using the measurements from eight strain gauges installed near the critical area. The calibration process consisted of adjusting the inboard beam stiffness and the actuator force to best match the test strains gauge measurements and the load point measured displacement. A comparison of the calibrated FE results and target test values is presented in Table 1. It is seen that with an 84% load scale factor and an inboard beam Young’s modulus of 10,400 ksi, the calculated strains (taken from five FE nodes surrounding the strain gauge location) were close to the strain measurement, except for gauge No. 5A.
Moreover, the NRC FE modelling results were compared with DIC measurements and a third party (CF-18 MRO (Maintenance and Repair Operator), L3-MAS) FE results. For the pre-modification shear lug, the maximum principal strain had a difference of about 1% (in linear analysis) and 6.5% (in nonlinear analysis) between the NRC and the MRO FE analysis, and a difference of 5.6 % between the NRC FE and the DIC strain measurements. Importantly, the NRC FE maximum principal strain location was the same as the cracking location found in the
actually imported into AFGROW in Tabular Look-up format. These curves were demonstrated to result in better fatigue life estimations than other 7050 material models, when a short/small crack growth is involved [7].
1.E-09 1.E-08 1.E-07 1.E-06 1.E-05 1.E-04 1.E-03 1.E-02 d a /d N ( in ch /cycl e ) 0.1 1.0 10.0 100.0
'K (or Kmax, -R); (ksi in^0.5) R = -0.35 R = -0.23 R = 0.05 R = 0.33 R = 0.45 2a c
IDS crack used to calibrate the lower da/dN
Figure 8 Crack growth rate da/dN- K curves for 7050-T7452 hand forging. 5.2. Crack model
The Center Semi-elliptical Edge Surface Crack model of AFGROW (4.11.15.0) was used to analyze the crack growth of the shear-tie lug. The thickness of the model was measured to be 10.0 mm (0.3937”) from the fracture surface (Figure 3), and the width of the model was assumed to be 203 mm (4”), over 10 times the thickness of the fracture surface. This assumption is based on the fact that, the lug flange is actually turning into a corner and connects to the lug main body. Therefore, the crack growth would slow down when approaching the corner (see Figure 6). The assumed width would reduce the finite width effect on the crack growth, as observed in the fractography study (Figure 3).
A simplified equivalent, single crack model was assumed to simulate the co-planar, multiple surface crack growth problem. As shown in Figure 9, the depth of the model was assumed to be the maximum depth of the two or multiple surface cracks, and the surface length was the total length between the two farthest spaced crack tips, including the gap between the cracks. Essentially, the simplified single crack model ignored the stage before the cracks coalesced. Some tests showed that the behaviour of the coalesced crack is very similar to that of a real single crack [8]. Obviously, the applicability of the simplified single crack model for a co-planar multiple crack problem are conditional upon different factors, like crack gaps, stress level, geometry, material (yielding) property, etc.
2
a
0C0 Crack 2
Crack 1
Equivalent single crack
Figure 9 Simplified single crack model to simulate multiple cracks 5.3. FE stress distribution
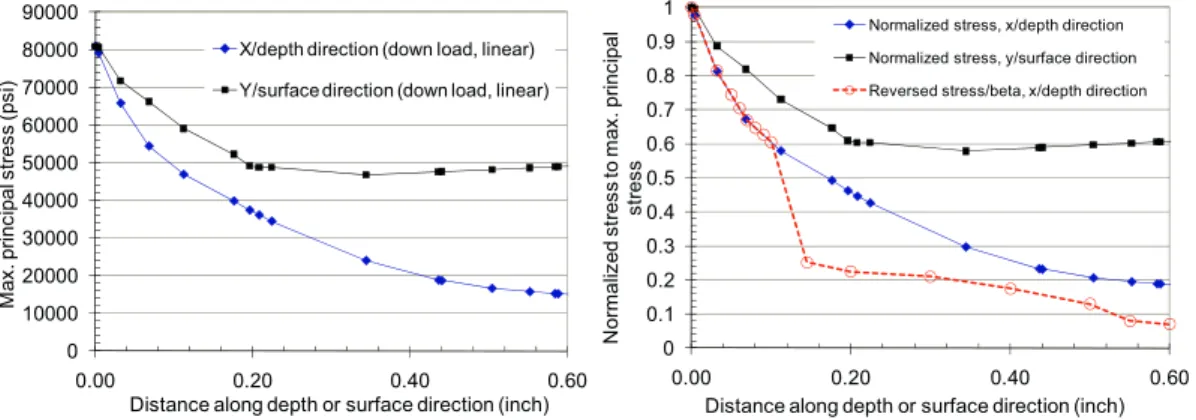
In this paper, the post-modification lug was used for fatigue analysis. From the fractography of the shear-tie lug, it was found that the crack had mainly grown in a mode I pattern. The maximum principal stress distributions along the two directions of the crack plane were taken from the FE analysis, as presented in Figure 10 (a). This figure indicates that the stress quickly decreased in the depth direction (into the material).
As the shear-tie lug was under a complex loading condition, and the AFGROW model was limited to uniform remote loading. The 3D FE based maximum principal stress distributions for the uncracked structure, shown in Figure 10 (a), was converted into normalized stress, in Figure 10 (b), based on the maximum stress point, in order to allow AFGROW to approximately simulate the crack growth in the shear-tie lug.
0 10000 20000 30000 40000 50000 60000 70000 80000 90000 0.00 0.20 0.40 0.60 Ma x. p ri n ci p a l st re s s ( p si )
Distance along depth or surface direction (inch)
X/depth direction (down load, linear) Y/surface direction (down load, linear)
0 0.1 0.2 0.3 0.4 0.5 0.6 0.7 0.8 0.9 1 0.00 0.20 0.40 0.60 N o rm a liz ed s tres s t o m a x . p rinc ipa l st re s s
Distance along depth or surface direction (inch) Normalized stress, x/depth direction Normalized stress, y/surface direction Reversed stress/beta, x/depth direction
Figure 10 (a) Max. principal stress distributions (post-mod), x, y direction shown in Figure 3; (b) Normalized stress distribution from 3D FE and from reversed engineering.
5.4. Fatigue analysis for long crack growth
First, fatigue analysis was carried out for the long crack growth from 1.053 mm (0.04146”) to 14.75 mm (0.58”) as measured from the QF. The two main cracks on the fracture surface (Figure 3) were gapped by a 3.0 mm (0.118”) distance. Thus the initial single surface crack was 1.053 mm (0.04146”) deep and 5.10 mm (i.e., 0.118”+2x0.04146”= 0.201”) wide. Without using any retardation model, the AFGROW produced the crack growth curve as shown in Figure 11 (a). It is shown that the analytical curve is very close to the test till the crack depth reached about 3.0 mm, and then diverted away from the test. Overall the analytical life is about ~55% shorter than the test life. The AFGROW Willenborg Retardation model was tried, which could shift the analytical curve closer to the test in the end point, but the shape of the curve is still very different from the test. Considering that the majority of load ratios in the spectrum were around -0.8, the retardation model was not further investigated in this work.
0 2 4 6 8 10 12 14 16 0 0.2 0.4 0.6 0.8 1 C ra ck si ze (m m)
Time ratio to test hour
Analytical (FE stress correction) Analytical (with reversed beta) Analytical (Willenborg/5.5N) Lower crack growth QF data Upper crack growth QF data 0 2 4 6 8 10 12 14 16 0 0.2 0.4 0.6 0.8 1 C ra ck si ze (m m)
Time ratio to test hour Analytical (FE stress
correction) Analytical (with reversed beta) Analytical a/c=1.0 (with reversed beta) Lower crack growth QF data Upper crack growth QF data
The reasons for the shorter analytical life were: 1) the FE stress distribution, based on the uncracked structure, would be changed after a certain crack size, which was also not adequately accounted by the classic AFGROW model; 2) possible residual stress present in the die forged shear-tie lug, which could reach two digits in ksi from a XRD (X-ray Diffraction) measurement on a spare shear-tie lug. Theoretically, a FE code capable of analyzing a crack, like StressCheck, is needed to accurately determine the stress distribution and stress intensity factor along with crack growth path, with residual stress information, if available, from inside material. A preliminary study on the StressCheck FE modelling, on the shear-tie lug proved to be very challenging due to the complex geometry (multi-holes, multi-curvature) and loading conditions. In this paper, an engineering approach was proposed for the fatigue analysis. The approach was based on the reversed beta correction, which was obtained by altering the normalized stress distribution in AFGROW in order to match the test data. This procedure only altered the normalized stress distribution beyond a certain crack size (~3.0 mm), and only in the depth (x) direction. The reversed beta/stress distribution was presented in Figure 10, together with the original FE stress distribution. Using this reversed beta/stress distribution, the analytical crack growth curve was obtained and shown in Figure 11 (a).
5.5. Fatigue analysis for total life
The total life for the post-modification lug was defined as the time period from the repair to the end of the fatigue test, so the pre-modification lug test hours were not included in the total life. Physically, the total life includes the crack nucleation life, although no clear microstructural features were identified from the fractography. Based on previous fatigue tests on 7050-T7452 hand forging coupons [7][9], the crack nucleation features are usually particles, pores, grain boundary, or machining marks. Considering the very high stress level (~80 ksi from linear analysis) at the critical location, and multiple crack nucleation sites found from fractography, the crack nucleation process is expected to be relatively short in the total life. In this fatigue analysis, the total life was entirely modelled by crack growth, and the crack nucleation life was not modelled. Again the simplified single crack model was used, with the initial crack size as follows, 1) crack depth: c0=0.157 mm (0.00618”) which was regressed using the log
(crack size) – linear (time) relationship for the first portion of QF data, see Figure 4 (b); 2) surface crack length: 2a0=3.31 mm (0.0118”+2x0.00618”), which is the distance of two main cracks 0.0118” plus two crack depth
2x0.00618”.
The analytical crack growth curves are presented in Figure 11 b), along with the QF crack data. The comparison indicates that,
x Using the FE based stress correction, the analytical total life is about 45% shorter than the test. The first part of the life, to the crack depth of ~3.0mm, is very close to the test, after that the life curve is very different from the test.
x Using the same reversed beta/stress distribution determined in Section 5.3, the analytical total life and the crack growth curve shape are close to the test results.
In addition, if multiple cracks were not considered and only one crack with a0=c0=0.157mm was used, the
analytical total life was about 32% longer than the test Figure 11 (b).
6. Discussion
It is interesting to note that the initial crack depth (0.157mm) for the total life analysis falls into the range of the 50 percentile (median, 0.011mm) to 99.9 percentile (extreme large, 0.230mm) EPS (equivalent pre-crack size) values, which were determined in [9] for the 7050 machined coupon and F-18 test articles.
Although the FE based stress distribution did not result in the crack growth curve completely matching with the test, the first portion of analytical life to the crack depth of 3mm (0.118”) is very close to the test, which is still valuable information. For this depth of crack, its surface length should be twice as long, i.e., 6 mm (0.236”), therefore, easily detectable by most NDI (non-destructive inspection) techniques. Overall, the test crack growth curve remains fairly stable up to a long crack size (~15 mm), which could basically alleviate the aircraft maintenance in service.
Today more and more composite materials are being used in aircraft structures, however, the heavily loaded components/joints may remain in metals. The complex cracking mechanisms, 3D FE analysis, and potential residual
stress effects will remain major challenges to the aircraft structural life management. While this paper revealed these challenges again, it also intended to prompt continuing research on advanced 3D FE modeling on crack growth and fracture mechanics methodologies to improve the critical structural lifing methodology.
7. Conclusions
Following a fatigue test on the CF-18 shear-tie lug, a simple but effective FE modeling was developed for the test structure and verified with multiple strain gauge measurements near the critical location. The 3D FE modeling then provided cross section stress distributions for the uncracked structure, which was used for the fatigue analysis. A simplified single crack model was proposed to simulate the multiple crack growth problem. It was shown that the simplified model could provide a good estimation of the fatigue life to a certain crack depth, when using the original 3D FE stress distribution.
At the same time, this work presented the complexity of the shear-tie lug fatigue analysis which involved complex geometry, multiple cracks, and possible residual stress from forging process, etc. Accurate 3D FE modeling with cracks and advanced fracture mechanics models are needed to tackle this kind of problem. In this paper, an engineering approach, i.e., a reversed beta/stress correction curve calibrated with the simplified crack model and QF data, was used to provide a simulation close to the total fatigue life under the test (average) loading spectrum. Given that individual aircraft loading spectra are different from each other but still in the similar pattern, the calibrated model may be applied to provide a reasonable life estimation for the fleet and individual aircraft.
Acknowledgements
This work was carried out with the financial support of Defence Research and Development Canada (DRDC) and National Research Council Canada (NRC), Projects ‘‘Short Crack Model Development for Helicopter Structural Life Assessment”. Thanks to Mr. R. Rutledge, J. Rogers, J. McMillan, D. Backman for providing the shear-tie lug CATIA model and other fatigue test results.
References
[1] Rutledge,R.S., Backman, D.S., and Hiscocks, R.J., Evaluation, modification and damage tolerance of an in-service aircraft critical area, ICAF 2009, Bridging the Gap between Theory and Operational Practice, Proceedings of the 25th Symposium of the International Committee on Aeronautical Fatigue, Rotterdam, The Netherlands, 27-29 May 2009, Bos, M. (Ed.).
[2] Macleod, G., Dubuc, J., Quantification of scatter in usage and structural response of the CF-18 aircraft, RTO-MP-AVT-157, NATO RTO Symposium AVT-157 on Ensured Military Platform Availability, Oct. 2008, Montreal, Canada.
[3] Molent, L, Barter, S., Conser, D. and White, P., Overview of the F/A-18 aft fuselage combined manueuvre and dynamic buffet fatigue test.The Proceedings of 2002 USAF Aircraft Structural Integrity Program, USA, December 2002.
[4] Liao, M., Bellinger, N.C., Komorowski, J.P., Rutledge, B., and Hiscocks, R., Corrosion fatigue prediction using holistic life assessment methodology. The Proceedings of the 8th International Fatigue Congress, FATIGUE 2002, Stockholm, Sweden, June 2002, published by EMAS UK, edited by A.F. Blom, Vol. 1, pp. 691-700.
[5] Roth, M. and Sander, K., F/A-18 IFOSTP FRACTOGRAPHIC ANALYSIS REPORT NSD31201-1-1 FT312 68% Spar Shear-Tie Component Fatigue Test’, QETE A006004-1 FT312-001, Quality Engineering Test Establishment Canada, 2006.
[6] Underhill, R., F/A-18 IFOSTP FRACTOGRAPHIC ANALYSIS REPORT NSD31201-2-1 FT312 68% Spar Shear-Tie Component Fatigue Test’, RMC-2006-001, Royal Military College Canada, 2006.
[7] Liao, M., Benak, T., Renaud, G., Yanishevsky, M., Marincak, T., Bellinger, N.C., Mills, T. - Prost-Domansky, S, and Honeycutt, K., Development of short/small crack model for airframe material: 7050 aluminum alloys. The 11th Joint NASA/FAA/DOD Conference on Aging Aircraft, Phoenix, USA, 2008.
[8] Hu, W., Liu, Q, and Barter, S.A., A study of interaction and coalescence of micro surface fatigue crack in aluuminum 7050, The 25th Symmposium of the International Committee on Aeronautical Fatigue (ICAF2009), Rotterdam, Netherlands, June 2009.
[9] Molent, L, Sun, Q., and Green, A.J., Characterisation of equivalent initial flaw sizes in 7050 alloys, Fatigue & Fracture of Engineering Materials & Structures, Volume 29, Issue 11, Pages 916 – 937.
![Figure 1 FT312 test set-up, (a) actuator load cell installation; (b) loading lug and digital image correlation camera [1].](https://thumb-eu.123doks.com/thumbv2/123doknet/14147482.471365/3.816.107.706.606.836/figure-actuator-installation-loading-digital-image-correlation-camera.webp)
![Figure 2 (a) Post-modification spectrum sequence plot [1]; (b) Statistical plots of spectrum load ratio](https://thumb-eu.123doks.com/thumbv2/123doknet/14147482.471365/4.816.97.710.224.452/figure-post-modification-spectrum-sequence-statistical-plots-spectrum.webp)