HAL Id: hal-02415491
https://hal.archives-ouvertes.fr/hal-02415491
Submitted on 17 Dec 2019
HAL is a multi-disciplinary open access
archive for the deposit and dissemination of
sci-entific research documents, whether they are
pub-lished or not. The documents may come from
teaching and research institutions in France or
abroad, or from public or private research centers.
L’archive ouverte pluridisciplinaire HAL, est
destinée au dépôt et à la diffusion de documents
scientifiques de niveau recherche, publiés ou non,
émanant des établissements d’enseignement et de
recherche français ou étrangers, des laboratoires
publics ou privés.
operations Application to CEA PHEBUS facility
M. Soulard, G. Ritter, C. Le Loirec, R. Eschbach, Olivier Serot
To cite this version:
M. Soulard, G. Ritter, C. Le Loirec, R. Eschbach, Olivier Serot. Source term computation for reactor
dismantling operations Application to CEA PHEBUS facility. DEM 2018 - Dismantling Challenges:
Industrial Reality, Prospects and Feedback Experience, Oct 2018, Avignon, France. �hal-02415491�
Source term computation for reactor dismantling operations:
Application to CEA PHEBUS facility
Maxime Soulard
1*, Guillaume Ritter
1, Cindy Le Loirec
1, Romain Eschbach
1,
Olivier Serot
11
CEA/DEN/DER/SPRC 13108 Saint-Paul-lez-Durance
This paper presents a part of the validation process for performing radiological characterization of reactors in decommissioning phase. This study focuses on three uncertainties sources: stochastic neutron uncertainty, nuclear data uncertainty and gamma rays intensities uncertainty. As the propagation of those sources of uncertainties is rarely done nowadays, we propose here to quantify their impacts. We establish criteria for converging neutron flux as well as a list of important isotopes for which a revisited evaluation could help in the perspective of activation prediction, especially
KEYWORDS: Dose-rate, TRIPOLI-4®, DARWIN, Uncertainty propagation, Activation
Introduction
Dismantling and decommissioning of nuclear facilities is nowadays one of the most important issues one needs to tackle. Initial radiological characterization is essential to ensure the decommissioning activities to be achieved in safe and rational manners. Both simulation and experiments are conducted to perform it in an iterative way, the experiments allowing a punctual validation of the simulation step and the computation allowing a complete characterization of the facility. The current computational power of computers and their intensive use makes it possible to perform complex and complete simulations. Appropriate codes and nuclear data should be used to obtain a reliable isotopic inventory prediction and dose-rate estimation.
To ensure the validity of the code, the Nuclear Data (ND) and the coupling involved in the predictive radiological characterization, it is important to perform a Verification, Validation and Uncertainty Quantification (VVUQ) step. This process is especially recommended by the French nuclear safety authority (ASN) [1] and specifies steps one has to respect to obtain a trustful tool that can be used for any application that fits in the application domain.
The present work presents an automated coupling between both codes developed by the CEA: TRIPOLI-4® MC [2] (code v.4.10) with the DARWIN-PEPIN2 [3] (v.2. 3) depletion and decay package. This coupling was applied for the source term determination of the CEA PHEBUS facility, a research reactor in decommissioning since 2007. Dose rate values were estimated and the contribution of several kinds of uncertainties was also evaluated by using the IncerD code developed at CEA [4].
Facility description
The PHEBUS reactor was an experimental reactor constructed at CEA Cadarache in 1977. With a maximum power of 40 MW, it was a crucial tool to study loss of coolant accidents (LOCA) and fusion of fuel assemblies throughout 4 Fission Product (PF) programs. The real burn-up is equal to 973 MWd/t. The decommissioning program started in 2007.
Computation scheme
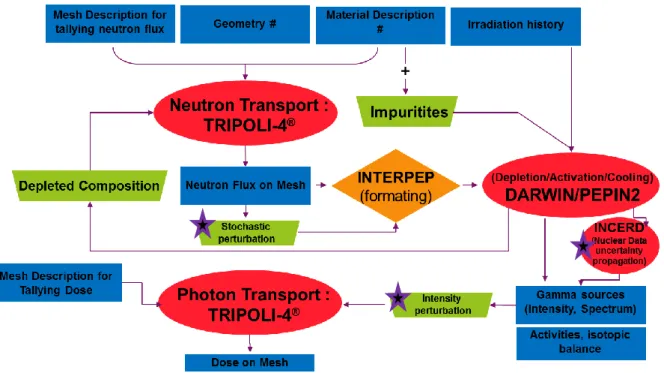
Initial radiological characterization of any reactors in decommissioning phase consists in performing 4 coupled calculations steps reported in Figure 1:
Neutron transport beyond fuel region,
Depletion calculation (isotopic inventory and gamma rays sources),
Gamma rays transport.
The Monte-Carlo code TRIPOLI4® (v.4.10) is used with the JEFF3.1.1 nuclear data library [5] for the estimation of the fission sources and the neutron transport. Neutron fluxes are tallied in specific meshes depending on the volume considered and then collapsed in 315 energy groups. Those fluxes are then used by the package DARWIN-PEPIN2 (v.2.3) to perform activation calculation with the JEFF-3.0/A library [6] for reactions rates calculations and JEFF3.1.1/DD as Decay Data library. Resulting gamma sources are then injected in TRIPOLI4 to estimate dose rate values in volumes of interest. Gamma transport is also performed with TRIPOLI4® (v.4.10) and the JEFF3.1.1 nuclear data library.
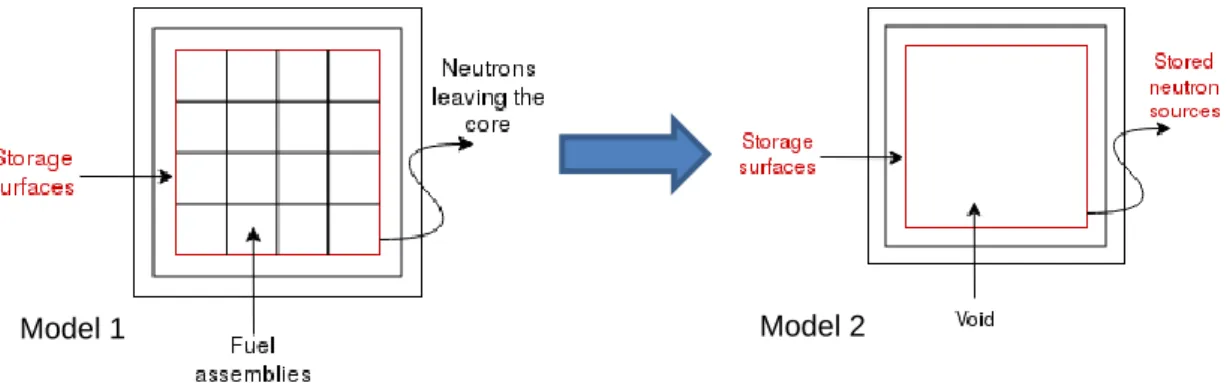
Monte Carlo modeling: Fission sources
The PHEBUS reactor is modeled twice as presented in Figure 2: in the first model called “Core model” in the following, the core is detailed whereas in the second one, called “activation model” in the following, the structures are precisely described.
Figure 2: Two steps fission sources calculation
Figure 1: Calculation Scheme used for initial radiological characterization of facility dismantling
The first model is extremely detailed with the representation of each fuel rods in the assemblies and the main structures of the core. It consists of a twenty-six 8x8 standard fuel assemblies with four triangle assemblies around the central tube for a total of 1816 fuel rods. The middle of the core is dedicated to the experimental test-device of the FP program. Absorber rods height is such that keff ~ 1.00 and fission sources are normalized to a thermal power of 15 MWth. This model is used to compute the neutron flux outgoing the fuel assemblies Figure 3 and Figure 4). Parameters (E,x,y,z,…)
of neutrons leaving fuel assemblies are stored in text files to be reused in the second simulation.
Figure 3: Radial neutron flux distribution (n.cm-2.s-1) Figure 4: Axial neutron flux distribution (n.cm-2.s-1)
Activation Calculation : Structures geometry and Monte-Carlo modeling
In the second simulation, neutron parameters stored in the file are reused in the dedicated activation model with detailed structures (graphite reflectors, nuts and bolts, tiny pieces) but without fuel assemblies as shown in Figure 5. In the activation model, structures of the core are modeled as precisely as possible to be able to compute activities in each part of the material. Different structures are described as reported in Figure 6. One can see graphite reflectors (turquoise), aluminum central
structure (light blue), several nuts (black circle) and staples (yellow).
The composition of those materials is either taken from results of destructive analysis or from literature for typical alloy. Especially, concentration of impurities is always taken equal to the maximum values given by the literature. For dismantling constraints, the method used here is conservative as it maximizes the materials activities and so the gamma emitted. The best solution should be to have precise isotopic analysis of each material. We will focus later on aluminum structures (fine composition reported below in Table 1).
The activity is extremely sensitive to the impurities concentration, as consequence a small variation in the initial composition has a major impact on the final activity of the material. For the aluminum, the Co sensitivity coefficient equals to 2.8E-3 %/%.
Atoms C (%) Atoms C (%) Atoms C (%) Atoms C (%)
Na 0.0008 Fe 0.4000 Rb 0.0001 Ba 0.0003 Mg 2.6000 Co 0.0002 Sr 0.0015 Ce 0.0001 Al 95.9766 Ni 0.0075 Zr 0.0020 Pr 0.0001 Si 0.4000 Cu 0.1000 Mo 0.0002 Nd 0.0001 Ca 0.0319 Zn 0.2000 Cd 0.0001 Dy 0.0001 Ti 0.1500 Ga 0.0159 Sn 0.0051 W 0.0001 Cr 0.0950 Ge 0.0121 Te 0.0001 Hg 0.0001
Table 1: Aluminum AG3 elemental concentration
As the geometry has changed over the past few decades according to the experiment, we used up to 3 different geometries to properly represent the structures of the reactor (especially the thickness of graphite increased from 5 cm to 20 cm, to gain on neutron balance). Neutron fluxes are obtained in all structures of interest (graphite reflectors, nuts, etc.), reaction rates are then used by the depletion solver which solves the Bateman equations. To properly compute one group reaction rates and get the right isotopic balance, isotopic activities and gamma spectrum for each structure volume considered one should use the accurate irradiation history reported in Table 2. The output is filtered as we only keep the isotopes with an activity at the last cooling time (the date of the beginning of the dismantling) greater than 1 Bq.cm-3.
Cycle # Days BU MWd/t Cycle 1 18 359 Inter-Cycle 960 0 Cycle 2 7 141 Inter-Cycle 1529 0 Cycle 3 10 207 Inter-Cycle 1485 0 Cycle 4 13 266
Table 2: Irradiation History
Figure 6: Top view of the Monte-Carlo model with detailed structures and experimental device (green) Left : z=0cm (midplane), Right : z=45cm
Dose-rate estimation
Dose-rate estimation (Gy.h-1) is performed by a coupled photon-electron transport in regions of interest. We can compute the dose as well as the dose rate everywhere in the nuclear facility in order to establish a dose and dose-rate maps.
Uncertainty propagation during activation and decay
We propose here a new step forward with the addition of an uncertainties propagation method. We introduce three main sources of uncertainties, added to the previous scheme and reported Figure 7.
Neutron Transport : Stochastic uncertainties (only due to statistical convergence)
Depletion/Activation/Cooling: Nuclear data uncertainties (for the activation reactions)
Photon Transport: Gamma rays intensities uncertainties (direct impact on the dose)
When estimating a multi-group flux, TRIPOLI-4®, like any other Monte-Carlo code, gives for each energy group a statistical uncertainty which varies according to the classic law 1
√𝑛 where n is the
number of particles simulated. For activation studies it is sometimes hard to reach a great convergence for all energy groups (because of the distance from the neutron source and the lack of neutrons for the tallies) .The stochastic uncertainty has an impact on the future isotopic balance calculated by the depletion solver because of the great variations of the reaction rates. In order to know the bias introduced by this statistical error, we first assume no correlation between energy groups. The statistical error given by TRIPOLI-4® is taken to be equal to the standard deviation and the flux given by TRIPOLI-4® to the mean value [7]. This allows generating a normal distribution for each energy group and then picking a random value for each energy group. A new input file is produced for in order to compute the reaction rates. This operation is repeated up to 1000 times in a given volume to produce 1000 concentration values for each isotope of the inventory. We show that those results are perfectly fitted by a normal distribution. Eventually, for each isotope we can assess the stochastic uncertainty by :𝜇𝑖
𝜎𝑖 (i is the isotope considered).
Nuclear data uncertainties
The code IncerD is based on the first order perturbation theory. The function representing the isotopic concentration is linearized at the first order thanks to a Taylor development. It is then possible to obtain several sensitivity coefficients (one for each uncertain parameter). By knowing the vector of sensitivity coefficients as well as the covariances matrices associated to those uncertain parameters (X), we can compute the standard deviation of the concentration (or the activity) for each isotope and for each uncertain parameter according to the “sandwich formula” :
𝐶𝑜𝑣(𝐶𝑜𝑛𝑐𝑒𝑛𝑡𝑟𝑎𝑡𝑖𝑜𝑛) = 𝑆(𝐶𝑜𝑛𝑐𝑒𝑛𝑡𝑟𝑎𝑡𝑖𝑜𝑛|𝑋)𝐶𝑜𝑣(𝑋)𝑆
𝑡(𝐶𝑜𝑛𝑐𝑒𝑛𝑡𝑟𝑎𝑡𝑖𝑜𝑛|𝑋)
𝐶𝑜𝑣(𝐶𝑜𝑛𝑐𝑒𝑛𝑡𝑟𝑎𝑡𝑖𝑜𝑛) refers to the standard deviation on isotopic concentration
𝑆(𝐶𝑜𝑛𝑐𝑒𝑛𝑡𝑟𝑎𝑡𝑖𝑜𝑛|𝑋) refers to the vector of sensibility of the isotopic concentration with respect to
the list of uncertain parameters X.𝐶𝑜𝑣(𝑋) refers to the matrix of correlation of those uncertain parameters.
𝐶𝑜𝑣(𝑋) = 𝐼
𝑛if no correlation are taken into account.Here is the list of the uncertain parameters taken into account for the uncertainty propagation:
𝑋 = {
𝜆, 𝑑𝑒𝑐𝑎𝑦 𝑐𝑜𝑛𝑠𝑡𝑎𝑛𝑡
𝑏𝑟, 𝑏𝑟𝑎𝑛𝑐ℎ𝑖𝑛𝑔 𝑟𝑎𝑡𝑖𝑜
𝜎, 1 𝑔𝑟𝑜𝑢𝑝 𝑛𝑒𝑢𝑡𝑟𝑜𝑛𝑖𝑐 𝑟𝑒𝑎𝑐𝑡𝑖𝑜𝑛 𝑟𝑎𝑡𝑒 = 1𝑔 𝑐𝑟𝑜𝑠𝑠 𝑠𝑒𝑐𝑡𝑖𝑜𝑛
}
As the evolution package uses JEFF3.1.1 as nuclear data library, we use for the uncertainty propagation a table of uncertainties associated with JEFF3.1.1 to properly propagate the uncertainties.
Gamma ray intensities uncertainties:
An other source of uncertainties is relative to the gamma rays intensities. Although the energy of the rays are often well known with an extremely low uncertainty, because of high purity germanium crystals with exceptional energy resolution (1 eV of uncertainty for 1 MeV gamma ray), intensities are far less known (about few percents) and one can observe variation of few percent for each ray. For each isotope of interest it is possible to get from the JEFF3.1.1 Decay Data the uncertainty associated with each gamma and X ray intensity. As the evolution solver computed the activities for each isotope of the isotopic balance, a multiplication between activities and intensities is needed to get the amount of photons emitted by the activated matter. From there we can generate two different gamma source files for further photon transport with TRIPOLI-4®. One with the maximum of gamma emitted according to the level of uncertainties and the other with the minimum of gamma emission. It may not be rigorously physical but it gives precious margins that have never been taken into account before.
Results
The new methodology is applied to the PHEBUS reactor case with a specific focus on the aluminum structure which envelops the fuel assemblies and the graphite material. We present the results of the propagation of the three sources of uncertainties described above on both activation and dose-rate.
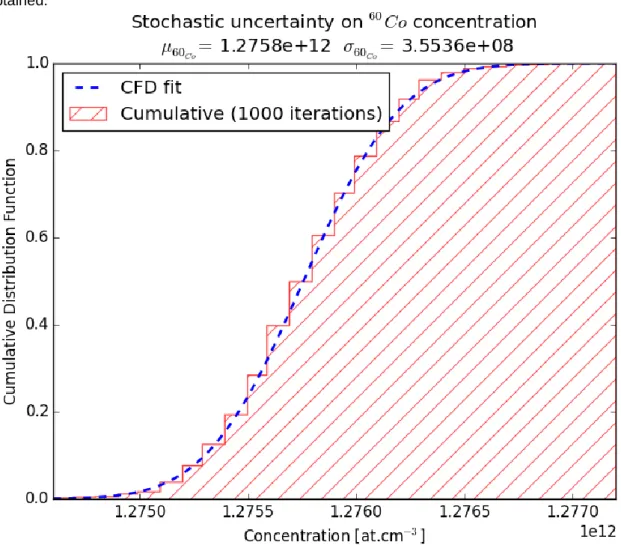
Figure 8 presents the results of the stochastic uncertainty propagation for the 60Co in a graphite reflector. It represents the cumulative distribution function relative to 1000 different concentrations coming from 1000 random draws in a 315 multi-group energy flux. We use the cumulative distribution because it shows without misinterpretation the shape of the distribution itself. The assumption of a
Gaussian fit is made and plot on the real distribution. It matches very well all the distribution we obtained.
Nuclear Data
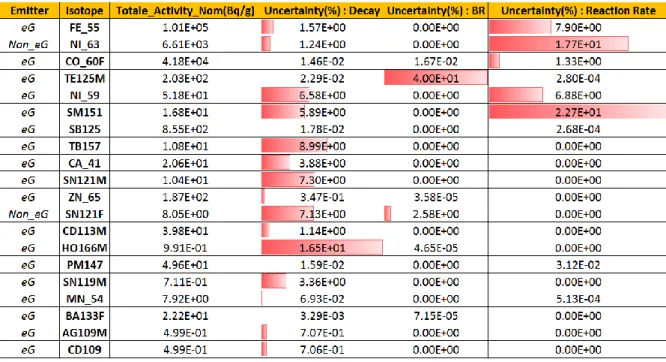
Tables 3 and Table 4 are automatically created at the end of the calculation process. The tables contain one column for the activity computed without any uncertainty propagation (i.e Total_Activity_Nom) which is the standard values always presented. Next columns contain Decay uncertainties, Branching Ratio uncertainties and Reaction Rate uncertainties obtained with IncerD. Each one of those columns represents the proportion of uncertainty of the parameter of interest (decay constant, branching ratio or reaction rates) on the total activity of the material per isotopes. We consider here only the isotopes with a contribution to the activity greater than 1 Bq.cm-3.
The contribution of the capture cross-section is the main one. For example we have 8% of uncertainty on {54Fe (n,γ) 55
Fe}, 4% on {154Eu (n,γ) 155
Eu} and 1,3% on {59Co (n,γ) 60
Co}. Another source of uncertainties comes from decay values, especially for 93mNb (20%) and 93Mo (20%). Some parameters such as the branching ratio of 93mNb do not have any uncertainty value in the literature so that a default 40% of uncertainty is applied to this parameter corresponding to the quantile at 95% of uncertainties associated to all branching ratios.
Parameters Isotopes
Capture cross-section 54Fe, 59Co, 150Nd, 58Ni, 62Ni, 92Mo,153Eu,154Eu Decay 59Ni,121Sm,93Mo, 93Nd, 121mSn, 121Sn
BR (125Sb->125mTe), (93Mo->93Nb),(121mSn->121Sn)
Table 5: Sum-up of the parameters of interest
Table 5 presents a list of isotopes and nuclear data that remains after severe sorting criteria consisting of retaining the isotopes with a contribution to the isotopic activity considered greater than 5%. This list
Table 3: Nuclear data uncertainties by isotopes for aluminum material
would help gain confidence in activation calculation if their evaluation was revisited and improved in the next JEFF evaluation.
Uncertainty due to Gamma ray intensities
The last part of the uncertainty propagation consists in checking whether or not the uncertainties on gamma ray intensities have an impact on the dose-rate itself. The process developed here involves getting all the intensity uncertainties from the JANIS database (xml format) on each gamma ray emitted by each isotope in the composition and perform the product between activity (without uncertainties) and intensities (with uncertainties). We basically obtain the maximum and the minimum number of gamma rays that can be emitted by the considered composition and so assess the maximum spread in which the dose value will be due to uncertainties on gamma ray intensities. The gamma spectrum is binned according to the common MERCURE energy grid (see in appendix).. The simulation is performed on different materials (graphite, aluminum, stainless steel, Zircaloy). We present on Figure 9 the results for the aluminum. One can observe basically no difference for the aluminum material. The only subtle variation is concerning the very first bin with a variation equals to 0.8%. This result is consistent with all the other materials. The uncertainty on gamma intensities can be totally neglected for dose estimation.
As we can neglect the gamma ray intensities uncertainties, the only other source of uncertainties is coming from the other nuclear data uncertainties, mentioned in the nuclear data part above.
We can observe on Figure 10 the result of a complete propagation of the nuclear data uncertainties on a gamma spectrum of a typical aluminum material. The impact on the spectrum is variable. The maximum variation is observed for the very first bin due the large uncertainty of the 54Fe capture cross-section. The variation is about ∓ 13% on the number of gamma emitted by the material. All the other variations are below 1%. This result is consistent with the other material we have been working with. For a dose estimation, ND uncertainties can be neglected. In spite of the important uncertainty in the first energy bin, the X rays have so little energy that they will never contribute to the dose itself.
Conclusion
We present in this paper a new methodology to take into account three sources of uncertainties neglected in the dismantling studies. It can bring attention to some particular ND that should be improved to better estimate both material activities and dose-rate. Our results highlight that 62Ni and 54
Fe cross sections need to be improved as well as the decay value for 93Mo. A work has also to be conducted on data without uncertainties to provide uncertainties values in order to estimate rigorously the impact on the results.
A work on ND evaluation will bring confidence in the waste classification estimation during the initial radiological characterization of the installation but will not have as much impact on dose estimation. It is possible to neglect uncertainties propagation for dose rate estimation but not for waste management.
This new method is fully automated and user friendly to help integrate uncertainties to all future dismantling and decommissioning studies. Work is currently ongoing to properly compare dose-rate measurements and dose-rate simulations to achieve the complete validation process of the code system.
References:
[1] ASN, Guide de l'ASN n°28 : Qualification des outils de calcul scientifique utilisés dans la démonstration de sûreté nucléaire - première barrière, 2017.
[2] E. Brun et al., "TRIPOLI-4® CEA, EDF and AREVA reference Monte Carlo code," Annals of
Nuclear Energy, no. 82, pp. 151-160, 2015.
[3] A. Tsilanizara, C. M. Diopp, Nimal. B. et al., «DARWIN: an evolution code system for a large range of applications,» Journal of Nuclear Science and Technology, n°137, pp. 845-849, 2000.
[4] S. Lahaye, T. Huynh and A. Tsilanizara, «Comparison of deterministic and stochastic approaches
for isotopic concentration and decay heat uncertainty quantification on elementary fission pulse,»
EPJ Web of Conferences, vol. 09002, p. 111, 2016.
[5] A. Santamarina et al., «The JEFF-3.1.1 nuclear data library,», JEFF Report 2.2, 2009.
[6] J.-C. Sublet, A. Koning, R. Forrest et J. Kopecky, «The JEFF‐3.0/A Neutron Activation File-New Features, Validation, and Usage,» AIP Conference, 2005.
[7] N. Garcia-Herranz, O. Cabellos, J. Sanz, J. Juan and J. Kuijper, «Propagation of statistical and nuclear data uncertainties in Monte Carlo burn-up calculations,» Annals of Nuclear Energy, n° 135, p. 714–730, 2008.
DEM 2018 - Dismantling Challenges: Industrial Reality, Prospects and Feedback Experience
France, Avignon – 2018, October 22 │24 Appendix
MERCURE energy grid :
Energy bounds (keV) Energy bounds (keV)
1.0000E-02 1.5000E-01 1.6667E+00 2.0000E+00
1.5000E-01 2.0000E-01 2.0000E+00 3.0000E+00
2.0000E-01 3.0000E-01 3.0000E+00 3.5000E+00
3.0000E-01 4.0000E-01 3.5000E+00 4.0000E+00
4.0000E-01 4.5000E-01 4.0000E+00 5.0000E+00
4.5000E-01 5.1000E-01 5.0000E+00 5.5000E+00
5.1000E-01 5.1200E-01 5.5000E+00 6.5000E+00
5.1200E-01 6.0000E-01 6.5000E+00 7.0000E+00
6.0000E-01 7.0000E-01 7.0000E+00 7.5000E+00
7.0000E-01 8.0000E-01 7.5000E+00 8.0000E+00
8.0000E-01 1.0000E+00 8.0000E+00 1.000E+01
1.0000E+00 1.3333E+00 1.000E+01 1.2000E+01
1.3333E+00 1.5000E+00 1.2000E+01 1.4000E+01