HAL Id: hal-02417817
https://hal.archives-ouvertes.fr/hal-02417817
Submitted on 18 Dec 2019
HAL is a multi-disciplinary open access
archive for the deposit and dissemination of
sci-entific research documents, whether they are
pub-lished or not. The documents may come from
teaching and research institutions in France or
abroad, or from public or private research centers.
L’archive ouverte pluridisciplinaire HAL, est
destinée au dépôt et à la diffusion de documents
scientifiques de niveau recherche, publiés ou non,
émanant des établissements d’enseignement et de
recherche français ou étrangers, des laboratoires
publics ou privés.
measurements in the VERDON CET-loop
M. Ledieu, S. Bernard, B. Gleizes, Yves Pontillon, G. Ducros, E. Hanus
To cite this version:
M. Ledieu, S. Bernard, B. Gleizes, Yves Pontillon, G. Ducros, et al.. Design and implementation of
a new gamma spectrometry sighting device for gaseous iodine measurements in the VERDON
CET-loop. International Conference on Advancements in Nuclear Instrumentation, Measurement Methods
and their Applications (ANIMMA - 2017), Jun 2017, Liege, Belgium. �hal-02417817�
Abstract— Source term assessment under severe accident conditions has been the main objective of several scientific research programmes over the past thirty years. But in the recent context of the Fukushima events, a new key issue has been identified: the potential impact of control rod degradation on the release of volatile fission products. A higher than expected fraction of gaseous iodine may indeed have been released during the accident due to the reaction of boron with CsI. The VERDON facility, at the LECA-STAR hot laboratory on the CEA Cadarache centre, was used to perform a new test to address this issue and to consolidate the database on the source term assessment. Prior to this test, the VERDON experimental circuit was equipped with a new gamma spectrometry device specifically for gaseous iodine on-line measurements. Installing such a new device inside the hot cell of the VERDON facility raises a number of specific experimental and operational constraints, e.g. resolution, efficiency, dimensions and robustness of the detector. To meet these specifications, the BrilLanCe© 380 detector by Saint-Gobain Crystals was chosen. This detector was characterized in order to validate the MCNP model used to design the lead shielding and tungsten screens. The designing phase was preliminary to the device implementation on the experimental loop and the first experimental results were obtained during the VERDON-5 test. A comparison of these results with the calculation results produced a ratio between 0.95 and 1.25 confirming the consistency of our calculations.
Index Terms— Fission products release kinetics, gamma
spectrometry, iodine measurements, severe accident monitoring, source term assessment.
I. INTRODUCTION
ource term assessment under severe accident conditions has been the main objective of several scientific research programmes over the past thirty years. Such programs were launched after the Three Mile Island accident (1979) and further reinforced with the Chernobyl accident (1986) and the more recent Fukushima disaster (2011).
Within the scope of this field, several tests have already been performed in the VERDON laboratory at the CEA Cadarache
M. Ledieu, S. Bernard, B. Gleizes, Y. Pontillon, G. Ducros and E. Hanus are with CEA, DEN, DEC, SA3C, LAMIR, F-13018 Saint-Paul-Lez-Durance, France (telephone +33 4 42 25 52 86, e-mail marion.ledieu@cea.fr).
centre [1], [2]. The corresponding VERDON experimental loop installed in the C5 hot cell of the STAR facility is devoted to studying fuel behaviour under severe accident conditions and the related fission product releases and deposits. This loop can be used to anneal freshly irradiated fuel samples up to temperatures representative of severe accident scenarios that lead to the total or partial release of the initial fission product inventory and to fuel relocation. Thereafter, it is possible to both identify and quantify the released species and their kinetics.
In the recent context of the Fukushima events, fresh observations regarding the source term have been made such as the fact that a higher than expected fraction of gaseous iodine may have been released during the accident due to the possible reaction of boron with CsI. It is true that the potential of boron to induce a high fraction of gaseous iodine due to chemical reactions with CsI has already been evidenced in past separate-effect tests [3]. This consideration has highlighted a new key issue: the impact of control rod degradation on iodine speciation and therefore the release of volatile fission products.
To address this new issue and to consolidate the database on the source term assessment of high burn-up UO2 fuel, a new
test was performed in the VERDON laboratory using the VERDON transportation experimental circuit (CET). Though no major changes were made to the gamma spectrometry instrumentation of the CET compared with the previous VERDON tests [4], a new gamma device has since been implemented in the hot cell to enable the on-line measurements of the gaseous iodine deposit kinetics in the May-Pack filter. This filter is specifically designed to trap molecular iodine, which is why it has been positioned in a location on the circuit to simulate the inlet into the reactor containment.
Installing such a new device inside the C5 hot cell involved a number of specific experimental and operational constraints that had to be incorporated into the qualification and design phases. Thus, this paper presents the step by step approach that we used, from the choice of the detector to the first experimental results obtained during the test. After briefly describing the VERDON facility, this paper presents the choice of the detector regarding the several constraints and the qualification phase that led to the validation of the MCNP model of the detector. Then, this model is used to determine the lead shielding and tungsten screens necessary to the
Design and implementation of a new gamma
spectrometry sighting device for gaseous iodine
measurements in the VERDON CET-loop
M. Ledieu, S. Bernard, B. Gleizes, Y. Pontillon, G. Ducros and E. Hanus
measurements which gave us the iodine release kinetics during the VERDON-5 test and an experiment-over-calculation comparison of the results showing their consistency and validating our design approach.
II. EXPERIMENTAL SETUP
This section provides a brief description of the VERDON facility and the detailed characteristics of the new detector that led to our final choice.
A. VERDON facility
The VERDON facility has been used to perform several tests in order to study the fuel behaviour under severe accident conditions and the related fission product releases and deposits [4]. Indeed, the VERDON experimental loop (Fig.1) installed in the C5 hot cell of the STAR facility can heat a freshly irradiated fuel sample under conditions representative of a severe accident and lead to the total or partial release of the initial fission product inventory.
Fig. 1. VERDON experimental loop in its “Transport” configuration (CET) The first component of the VERDON loop in its “fission product transport” configuration (CET) is the induction furnace, which contains the fuel sample and performs the annealing sequence. Downstream, a hot leg connects this furnace to a series of thermal gradient tubes along which the temperature decreases linearly from 700°C to 150°C. The fluid then flows through an aerosol filter that traps all the fission products in aerosol form and a May-Pack filter that specifically traps molecular iodine. Finally, the remaining fission gases are transferred outside the hot cell into a gas vessel via a glove box. The VERDON loop is also equipped with four gamma spectrometry sighting devices that are used for the on-line measurement of the fission products release and deposit kinetics during the tests (circled in green in Fig.1). Each device focuses on a specific area: the sample located inside the furnace, the hot leg, the aerosol filter, and the gas outlet exiting the hot cell.
One of the main objectives of the last VERDON-5 test was to study the impact of boron resulting from control rod degradation on the iodine speciation. This gaseous fraction was measured at a location simulating the inlet into the reactor
configuration, there was no available gamma sighting device focusing on the May-Pack, implying to add a new one for this purpose.
B. The chosen detector
The installation of this new device inside the C5 hot cell had to fulfil a number of specific experimental and operational constraints.
Considering the operational constraints, the detector being implemented inside the hot cell, it had to be easy to operate, i.e. remotely manageable and without complex cooling system like for HPGe detectors. Regarding the seismic risk and the cell crowding, the final device had to be as compact as possible to limit its shielding mass (limited to 30 kg). And regarding the hot cell environment during the test, it had to be robust with respect to the irradiation.
Considering the experimental constraints, the detector had to meet the technical requirements imposed by the experimental conditions of the VERDON-5 test. Particularly, the detector had to have resolution performances allowing the measurement of several iodine isotopes, efficiency performances enabling the early detection of iodine in the filter and the measurement of the complete initial inventory, and the ability to support high input count rate (ICR).
The BrilLanCe© 380 detector by Saint-Gobain Crystals met these specifications. Indeed, the detector is composed of a 9 mm x 9 mm x 20 mm cerium activated lanthanum bromide crystal (LaBr3:Ce) coupled to an avalanche photodiode, which
produces a very compact design, i.e.
30 mm x 30 mm x 55 mm. This type of detector (scintillator), working at room temperature, does not require a cooling system. With an announced resolution performance of 2.8% at 662 keV, the detector actually achieved 3.2% when tested in laboratory conditions. This resolution level is expected to be sufficient for measuring iodine isotopes. Finally, this scintillator allows counting in intense flux and is known to have a good radiation hardness (up to 1kGy in unpackaged crystals) [5]–[7].
Fig. 2. BrilLanCe© 380 detector by Saint-Gobain Crystals [8]
III. RESULTS AND DISCUSSION
This section first presents the qualification phase of the new device, i.e. the experimental characterisation of the BrilLanCe© scintillator and the shielding design. It also discusses the first experimental results obtained during the VERDON-5 test and their comparison with our calculations.
A. BrilLanCe© scintillator characterization
This phase consisted in validating the technical characteristics of the detector listed in its data sheet in order to establish an effective MCNP model. This model was used throughout the entire design phase.
A first measurement campaign was performed with the unshielded detector using 60Co, 133Ba, 137Cs and 152Eu isotopic sources in succession which were positioned at a distance of 15 cm from the entrance window. This experiment gave us the efficiency and resolution calibrations of the detector.
The same setup has been modelled with the MCNPX code, simulating a gamma source of various energies emitting in the direction of the entrance window of the 9 mm x 9 mm x 20 mm detector, in a cone including the latter. The source has also been modified with a Gaussian energy broadening card (GEB card) [9] that defines the full width at half maximum (FWHM) of the peak in order to be consistent with the Gaussian dynamics of the acquisition. The arguments of the GEB card are related to the parameters of the efficiency calibration determined during the measurements campaign thanks to (1).
(1)
Where E is the energy of the particle and a, b and c are in MeV, MeV1/2 and 1/MeV.
The a, b and c factors were determined by processing the spectra with the GENIE2000 software. The efficiency calibration equation is given in the same form as the MCNPX GEB arguments.
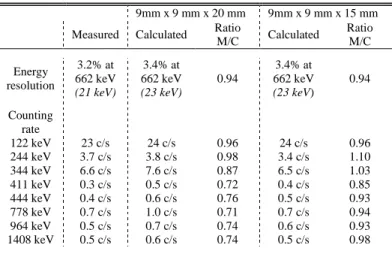
Table 1 below summarises the measured and calculated results for the counting rate, the energy resolution and the efficiency of the detector
The iodine isotope peaks relevant to our study range from 380 keV to 1400 keV. The M/C ratio obtained for these energies is about 0.75. We used the Vised software to represent the events locations inside the crystal and were able to observe that the distribution was rather homogeneous in the volume. Thus, we decided to adapt the MCNP model in order to be consistent with the measurements: we shortened the length of the detector in the simulation. As a result, the size of the crystal was brought to 9 mm x 9 mm x 15 mm. Table 1 also lists the M/C ratios obtained in this new configuration.
The M/C ratios were enhanced by shortening the detector length, especially for the 380 keV – 1500 keV range which is relevant to our study.
TABLEI
COMPARISON OF THE MEASURED AND CALCULATED RESULTS
9mm x 9 mm x 20 mm 9mm x 9 mm x 15 mm
Measured Calculated Ratio M/C Calculated Ratio M/C
Energy resolution 3.2% at 662 keV (21 keV) 3.4% at 662 keV (23 keV) 0.94 3.4% at 662 keV (23 keV) 0.94 Counting rate 122 keV 23 c/s 24 c/s 0.96 24 c/s 0.96 244 keV 3.7 c/s 3.8 c/s 0.98 3.4 c/s 1.10 344 keV 6.6 c/s 7.6 c/s 0.87 6.5 c/s 1.03 411 keV 0.3 c/s 0.5 c/s 0.72 0.4 c/s 0.85 444 keV 0.4 c/s 0.6 c/s 0.76 0.5 c/s 0.93 778 keV 0.7 c/s 1.0 c/s 0.71 0.7 c/s 0.94 964 keV 0.5 c/s 0.7 c/s 0.74 0.6 c/s 0.93 1408 keV 0.5 c/s 0.6 c/s 0.74 0.5 c/s 0.98
The counting rate results are given for the 152Eu source because the peak energies range between 100 and 1500 keV, which is a relevant range with respect to the iodine isotopes in our study.
The MCNP model of the detector has therefore been validated. These new dimensions were applied for the remainder of the design approach.
B. Shielding design
The May-Pack filter was specifically designed for the on-line measurement of the gaseous iodine deposit kinetics. This filter is composed of three zeolite stages that trap molecular iodine. We decided to focus on measuring the first stage of zeolite (Fig. 3), considering the size of the crystal, the crowding of the hot cell (Fig. 1), the limited mass of the total device and the results of the previous VERDON tests.
Fig. 3. May-Pack filter outline
The objective was therefore to design a shielding that would make it possible to correctly measure the iodine trapped in the first stage of the May-Pack filter without being disturbed by any parasitic sources in the hot cell and its ambient contamination.
1) Lead shielding
The first step of this design phase was to model the main components of the hot cell in order to identify any gamma parasitic sources that could interfere with the iodine measurement. The MCNP calculations were used to define two major parasitic sources: the aerosol filter located close to the May-Pack and the furnace containing the fuel sample. Thus, the shielding had to be designed to minimise the counting rate in the crystal caused by these sources. Fig. 4 provides an MCNP representation of our model; it indicates the direction of the parasitic sources.
Fig. 4. MCNPX model representation of the C5 hot cell and directions of the parasitic and iodine sources (top view for the crystal and filters, front view for
the furnace)
This model made it possible to quantify the parasitic signals from the furnace and the aerosol filter; with about 104 c/s and 103 c/s respectively. The shielding was made of lead which was internally lined with a sheet of copper to block fluorescence X-rays from the lead.
The thickness of the lead shielding had to be increased on the left and top of the detector (facing the entrance window, see Fig. 5b) to take into account the directions of the parasitic sources.
Fig. 5. MCNPX representation of the lead shielding surrounding with the copper thickness: top view (A) and front view (B).
An aperture has been left empty at the back of the detector for the feed-through of electrical wiring. The device weighs a total of about 25 kg, thus meeting the operational requirements in terms of weight.
2) Tungsten screens
In order to focus the measurement on the first stage of the filter, a collimator was designed so it could be aligned with the entrance window of the detector (Fig. 5a). The shape of the aperture was defined geometrically to limit the sighting solid angle to this first stage.
The design phase was based on the assumption that the complete iodine initial inventory could be trapped in the May-Pack. Accordingly, the MCNPX results calculated the incoming counting rate (ICR) at around 108 c/s. The tungsten screens were therefore designed to respect the optimal range of the electronics, usually set at 105 c/s. Each screen was designed to decrease the signal by one decade and can be interposed at the collimator entrance slit (Fig. 6).
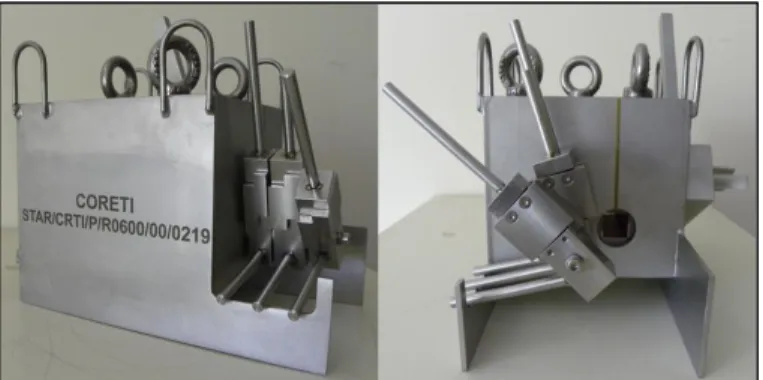
Fig. 6. Photographs of the final lead shielding and tungsten screens
3) Calibration system
A test campaign was performed in parallel to the design phase so as to set up the electronics and meet the measurement requirements, i.e. spectra acquisition without counting losses and with the best possible energy resolution. During this campaign, a shift in the spectra was observed with the increasing ICR. A calibration system with two 137Cs and 60Co isotopic sources was added on the side of the gamma spectrometer shielding. It allowed us to either align the sources in front of a small aperture to be measured by the gamma detector before calibrating it, or to install a lead plug to reform the shielding (Fig. 7). It was thus possible to calibrate the gamma detector by using the three main gamma ray-lines of these two radionuclides before and at the end of the test.
Fig. 7. Photograph of the calibration system located on the side of the device Generally speaking, the device was designed to take into account all the afore-mentioned technical and safety requirements, focusing in particular on the remote handling of the screens during the thermal sequence.
C. Iodine spectrum estimation
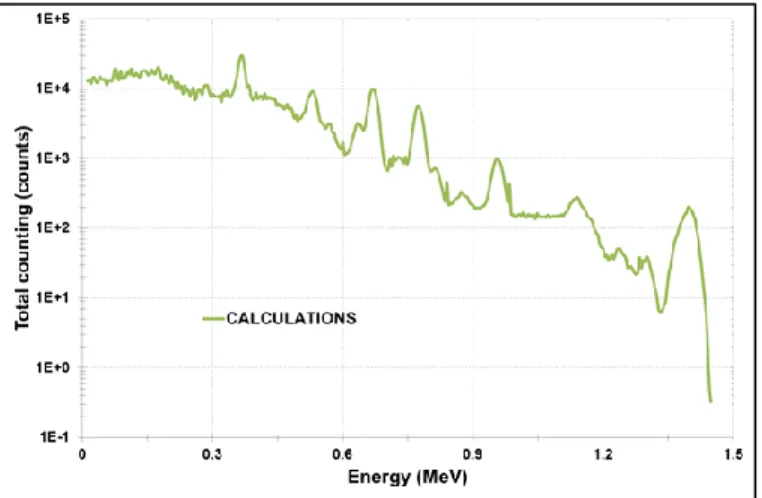
We were able to estimate the iodine spectra that could be measured during the test on the basis of the final MCNP model of the hot cell and the shielded detector. This estimation took into account three isotopes of iodine (131I, 132I and 133I) and the parasitic background due to the fuel sample and the aerosol filter (Fig. 8).
Fig. 8. Iodine spectrum estimation with the MCNPX model The estimation confirmed that the several iodine peaks would be visible and exploitable. The analysis of these peaks helped us to determine the iodine deposit kinetics in the May-Pack filter and to compare the measured results with our calculations.
D. Iodine kinetics measurements
The final device was installed directly inside the C5 hot cell close to the May-Pack filter before the VERDON-5 test and several spectra were acquired continuously during the test in order to determine the iodine kinetics. Due to the high frequency power supply of the furnace, electromagnetic parasites nonetheless disturbed the measurements and the acquired spectra could not be analysed as such (Fig. 9). No significant peak was observed and the whole spectrum was shifted to the right.
Fig. 9. Iodine spectrum acquired on-line during the test, while the HF power supply was functioning
Post-test processing was performed on the spectra in order to plot the iodine kinetics. To begin with, the basic assumption was that the spectrum contained all the information even if it was compressed. The simulation results were therefore used to define a region of interest (ROI) detectable on each spectrum, starting from the first inflexion point until the last canal (Fig. 10). The variation in this ROI for each spectrum gave us the variation in the iodine quantity in the May-Pack filter and therefore its deposit kinetics.
Fig. 10. Definition of the ROI for each iodine spectrum
The kinetics obtained with this approach (Fig. 11) was consistent with those obtained during the previous tests (VERDON tests performed with the circuit in a “release” configuration) [2].
Fig. 11. Iodine deposit kinetics in the May-Pack filter during the VERDON-5 test determined thanks to a specific ROI of the spectra.
Moreover, at the end of the test, when the HF power supply has been shut down and electromagnetic parasites disappeared (see III.E), the information extracted from both disturbed and non-disturbed spectra overlapped, validating our basic assumption.
E. Experiment over calculation comparison
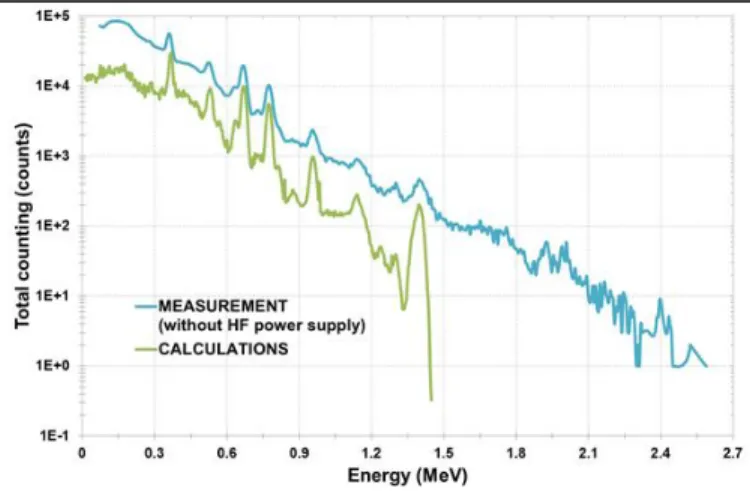
At the end of the VERDON-5 test, when the HF power supply has been shut down, the impact of the electromagnetic parasites decreased and tended to completely disappear. Thus, it was possible to use those spectra to do an experiment-over-calculation comparison (Fig. 12).
Fig. 12. Comparison of the spectra acquired at the end of the VERDON-5 test (HF shut down) in blue and estimated with the MCNP model in green. This first comparison showed a good agreement between measured and calculated results in terms of peak appearance on the spectra. Nevertheless, the background seemed to be underestimated by about a decade and the resolution seemed degraded on the measurement spectrum compared with the calculated spectrum. These observations highlight the fact that the MCNP model can be improved in order to better represent the measurement environment.
Post-test processing was performed on these spectra to extract the net area of the several full-energy peaks. The results of this second comparison are summarised in Table 2.
TABLEII
COMPARISON OF THE NET AREAS OF THE PEAKS DETERMINED ON MEASURED AND CALCULATED SPECTRA AND CORRESPONDING M/C RATIOS
Energy (keV) Measured area Calculated area M/C ratio
364 1.02x10⁵ 1.01x10⁵ 1.02 506/523/530 4.92x10⁴ 3.87x10⁴ 1.27 630/637 1.57x10⁴ 1.28x10⁴ 1.23 668 6.91x10⁴ 5.57x10⁴ 1.24 774 3.33x10⁴ 2.66x10⁴ 1.25 955 5.54x10⁴ 5.80x10³ 0.95 1136 1.68x10³ 1.62x10³ 1.03 1399 2.42x10³ 2.05x10³ 1.18
Some peaks that were visible on the calculated spectra were not visible on the measured spectra. Their areas had to be cumulated to be compared.
Despite the underestimation of the resolution degradation and the background signal by about a decade, Table 3 shows that measured and calculated net areas extracted from the full-energy peaks are of the same order of magnitude, with the M/C ratios ranging from 0.95 to 1.27.
Once again, the MCNP model can be improved by adjusting the input data for the post-processing of the calculated spectra. For example, the iodine activity was estimated regarding the previous VERDON tests and can be enhanced by using the effective VERDON-5 initial inventory for these isotopes (this data was unavailable at the time of this study).
As part of the initial approach, the good agreement of these results validates the MCNP model used to implement the new gamma spectrometry device, as well as confirming the design approach followed during this experiment.
To address the on-line iodine measurement issue for the VERDON-5 test, a new gamma spectrometer was implemented on the experimental loop. Due to the operational and experimental constraints, the BrilLanCe© 380 detector by Saint-Gobain Crystals had to be introduce in the hot cell, as close to the May-Pack filter as possible. After a characterisation phase and thanks to the MCNP model that we validated, we designed a lead shielding, three tungsten screens and a calibration system to optimise the iodine measurement in the first stage of the May-Pack filter. Despite disturbance from the high frequency power supply, we were able to determine the iodine deposit kinetics in the dedicated filter thanks to post-test processing using the acquired spectra. Finally, a first measurement-over-calculation comparison was performed, which showed good consistency between the results. Nevertheless, this comparison can be improved by making some improvements on the MCNP model, especially to adapt the impact of the background and the degraded resolution of the measurement environment.
REFERENCES
[1] A. Gallais-During et al., “Overview of the VERDON-ISTP Program and main insights from the VERDON-2 air ingress test,” Ann. Nucl. Energy, vol. 101, pp. 109–117, 2017.
[2] A. Gallais-During et al., “Nuclear fuel behaviour at high temperature: new insights from post-test examinations on the VERDON-1 sample,” in International Conference
TopFuel, Boise, USA, 2016.
[3] P. D. W. Bottomley et al., “Revaporisation of fission product deposits in the primary circuit and its impact on accident source term,” Ann. Nucl. Energy, vol. 74, pp. 208–223, 2014.
[4] A. Gallais-During et al., “Performance and first results of fission product release and transport provided by the VERDON facility,” Nucl. Eng. Des., vol. 277, pp. 117– 123, 2014.
[5] Saint Gobain Crystals, “BrilLanCe Scintillators Performance Summary.” 2009.
[6] W. Drozdowski, P. Dorenbos, A. J. J. Bos, A. Owens, and F. G. A. Quarati, “Gamma ray induced radiation damage in 1in x 1in LaBr3:5%Ce.,” Radiat. Meas., vol. 43, no. 2–6, pp. 497–501, 2008.
[7] J. Flamanc, C. Rozsa, F. D. McDaniel, and B. L. Doyle, “Compact LaBr3: Ce Gamma Ray Detector with Si‐APD Readout,” AIP Conf. Proc., vol. 1099, no. 1, pp. 79–83, 2009.
[8] Saint Gobain Crystals, “BriLanCe 380 _ Compact APD Detector.” 2008.
[9] D. B. Pelowitz, “MCNPX user’s manual _ Version 2.7.0.” 2011.