HAL Id: hal-03235902
https://hal.sorbonne-universite.fr/hal-03235902
Submitted on 26 May 2021
HAL is a multi-disciplinary open access
archive for the deposit and dissemination of
sci-entific research documents, whether they are
pub-lished or not. The documents may come from
teaching and research institutions in France or
abroad, or from public or private research centers.
L’archive ouverte pluridisciplinaire HAL, est
destinée au dépôt et à la diffusion de documents
scientifiques de niveau recherche, publiés ou non,
émanant des établissements d’enseignement et de
recherche français ou étrangers, des laboratoires
publics ou privés.
controlled trial
Eva Lau, Eugeni Belda, Paul Picq, Davide Carvalho, Manuel
Ferreira-Magalhães, Maria Silva, Isaac Barroso, Flora Correia, Cidália Vaz,
Isabel Miranda, et al.
To cite this version:
Eva Lau, Eugeni Belda, Paul Picq, Davide Carvalho, Manuel Ferreira-Magalhães, et al.. Gut
mi-crobiota changes after metabolic surgery in adult diabetic patients with mild obesity: a randomised
controlled trial. Diabetology & Metabolic Syndrome, 2021, 13 (1), pp.56.
�10.1186/s13098-021-00672-1�. �hal-03235902�
RESEARCH
Gut microbiota changes after metabolic
surgery in adult diabetic patients with mild
obesity: a randomised controlled trial
Eva Lau
1,2*, Eugeni Belda
3, Paul Picq
3, Davide Carvalho
1,4, Manuel Ferreira‑Magalhães
2,5, Maria Manuel Silva
1,4,
Isaac Barroso
6,7, Flora Correia
8,9, Cidália Pina Vaz
2,10, Isabel Miranda
11, Adelino Barbosa
12, Karine Clément
13,
Joel Doré
14, Paula Freitas
1,4and Edi Prifti
3,15Abstract
Background: Roux‑en‑Y gastric bypass (RYGB) surgery is one of the most efficient procedures for the treatment of obesity, also improving metabolic and inflammatory status, in patients with mild obesity. The underlying mechanisms have not been fully understood, but gut microbiota is hypothesized to play a key role. Our aim was to evaluate the association between gut microbiota changes and anthropometric, metabolic and inflammatory profiles after meta‑ bolic surgery compared with medical therapy, in type 2 diabetic (T2DM) adults with mild obesity (BMI 30–35 kg/m2).
Methods: DM2 was an open‑label, randomised controlled clinical trial (RCT: ISRCTN53984585) with 2 arms: (i) surgi‑ cal, and (ii) medical. The main outcome was gut microbiota changes after: metabolic surgery (Roux‑en‑Y gastric bypass—RYGB) versus standard medical therapy. Secondary outcomes included anthropometric, metabolic and inflammatory profiles. Clinical visits, blood workup, and stool samples were collected at baseline and months (M)1, 3, 6, 12. Gut microbiota was profiled using 16S rRNA targeted sequencing.
Results: Twenty patients were included: 10 in surgical and 10 in medical arm. Anthropometric and metabolic com‑ parative analysis favoured RYGB over medical arm. At M12, the percentage of weight loss was 25.5 vs. 4.9% (p < 0.001) and HbA1c was 6.2 vs. 7.7% (p < 0.001) respectively. We observed a continuous increase of genus richness after RYGB up until M12. In the medical arm, genus richness ended‑up being significantly lower at M12. Composition analysis indicated significant changes of the overall microbial ecosystem (permanova p = 0.004, [R2 = 0.17]) during the follow‑ up period after RYGB. There was a strong association between improvement of anthropometric/metabolic/inflamma‑ tory biomarkers and increase in microbial richness and Proteobacterial lineages.
Conclusions: This was the first RCT studying composite clinical, analytic, and microbiome changes in T2DM patients with class 1 obesity after RYGB versus standard medical therapy. The remarkable phenotypic improvement after sur‑ gery occurred concomitantly with changes in the gut microbiome, but at a lower level.
Trial registration: ISRCTN53984585
Keywords: Diabetes mellitus, Insulin resistance, Microbiome, Roux‑en‑Y gastric bypass, Weight loss
© The Author(s) 2021. This article is licensed under a Creative Commons Attribution 4.0 International License, which permits use, sharing, adaptation, distribution and reproduction in any medium or format, as long as you give appropriate credit to the original author(s) and the source, provide a link to the Creative Commons licence, and indicate if changes were made. The images or other third party material in this article are included in the article’s Creative Commons licence, unless indicated otherwise in a credit line to the material. If material is not included in the article’s Creative Commons licence and your intended use is not permitted by statutory regulation or exceeds the permitted use, you will need to obtain permission directly from the copyright holder. To view a copy of this licence, visit http:// creat iveco mmons. org/ licen ses/ by/4. 0/. The Creative Commons Public Domain Dedication waiver (http:// creat iveco mmons. org/ publi cdoma in/ zero/1. 0/) applies to the data made available in this article, unless otherwise stated in a credit line to the data.
Background
Obesity and type 2 diabetes mellitus (T2D) are both met-abolic diseases that have expanded worldwide, reaching epidemic proportions and increasing patients’ morbid-ity and mortalmorbid-ity [1]. Close interaction and imbalance
Open Access
*Correspondence: evalau.med@gmail.com
1 Department of Endocrinology and Nutrition, Centro Hospitalar de S. João, Alameda Professor Hernani Monteiro, 4200‑319 Porto, Portugal Full list of author information is available at the end of the article
between epigenetic and environmental factors are the primers for the complex etiological pathways of both diseases. Recent studies have emphasised the role of gut microbiota in metabolic regulation—specifically in ener-getic storage dysfunction and systemic inflammation [2,
3].
The “Microbiome Hypothesis” is based on the fact that humans host 1014 bacteria in the gut, which perform a variety of physiological functions, ranging from protec-tive to metabolic regulation, including carrying out an active part in glucose and lipid metabolism [4, 5]. Intesti-nal dysbiosis, characterised by changes in gut microbiota composition, has been shown to play an essential role in obesity and T2D [6, 7]. Ley et al. showed a shift towards a higher relative abundance of Bacteroidetes and a decreased quantity of Firmicutes in patients with obesity who lost weight through low-calorie diets [8]. Further-more, experimental data has highlighted the role of gut microbiota in nutrient absorption, as well as in the main-tenance of gut barrier integrity and lipogenesis and hor-monal status, leading to an increasing interest in shaping human gut microbiota composition in order to prevent and treat obesity and restore glucose homeostasis [9, 10].
Recent clinical trials reported that bariatric surgery, namely Roux-en-Y gastric bypass (RYGB) or bilio-pan-creatic diversion, was the most effective treatment for combined weight loss and improvement/remission of T2D in patients with severe obesity [body mass index (BMI) > = 35 kg/m2] [11, 12]. Such encouraging results led to further research adopting the same approach in patients with mild obesity (BMI 30–35 kg/m2) and the outcomes also proved the efficacy of this surgery in this subgroup of patients with obesity [13]. The mechanism by which T2D improves rapidly after RYGB, before sig-nificant weight loss, has not yet been completely under-stood, but recent studies have shown that gut microbiota modulation contributes to beneficial metabolic effects [14, 15]. Furet et al. demonstrated a shift toward an increase of Faecalibacterium prausnitzii in diabetic patients which was associated with a reduction in low-grade inflammatory state in obesity and diabetes [14].
To our knowledge, no randomised controlled clinical studies have been carried out assessing the association between gut microbiota changes and metabolic out-comes after RYGB in diabetic patients with mild obe-sity, compared to standard medical therapy. The main aim of our study was to evaluate gut microbiota changes after metabolic surgery versus standard medical therapy in diabetic adult patients with class 1 obesity. Second-ary aims included: (1) the assessment of anthropometric, metabolic and inflammatory changes after interventions; and (2) the study of associations between gut micro-biota alterations with anthropometric, metabolic, and
inflammatory changes. This research contributes to improve our understanding of the intricate role of the gut microbiota in metabolic regulation.
Methods
Study design and participants
The Diabetes, Microbiota and Metabolic surgery (DM2) study was an open-label, randomised controlled clini-cal trial (RCT) carried out at the Centro Hospitalar São João (CHSJ) in Porto, Portugal, which was designed to assess gut microbiota changes and T2D resolution in patients with mild obesity after metabolic surgery versus standard medical therapy. The Ethics Committee from CHSJ approved the clinical protocol (ref 116/13) and all patients provided written informed consent. This RCT was registered in International Standard Randomised Controlled Trial Number Registry (ISRCTN), with the number ISRCTN53984585 (http:// www. isrctn. com/ ISRCT N5398 4585).
We used electronic medical records to identify candi-dates to participate in the trial, and between May 2014 and August 2014 we screened 42 patients at the CHSJ Endocrinology outpatient centre. Assuming rates of dia-betes resolution to be 83%, with a 20% dropout rate in each study arm [12], required an enrolment of 10 patients in each category. This provided a power of > 90% to detect differences between the 2 groups, using a 2-sided alpha of 0.05. Consequently, we included 20 participants who were randomly assigned to one of the two study arms, with a 1:1 ratio, using a computer-generated randomisa-tion procedure, to receive either RYGB or standard medi-cal therapy. Blinding was unsuitable for use, due to the major differences between the two treatment therapies; however, participants and researchers were only aware of the study arm of each participant after patients’ informed consent and the random allocation concealment.
Inclusion criteria were as follows: age ≥ 20 and ≤ 65 years old; BMI ≥ 30 and < 35 kg/m2; previous diagnosis of T2D, according to the American Diabetes Association (ADA) definition, and under antidiabetic medical therapy [16]; duration of diabetes > 3 months; overnight-fasting C-peptide > 0.7 ng/ml; negative anti-GAD autoantibody; possible eligibility for general anes-thesia; ability and willingness to participate in the study, with an understanding of the requirements of each arm of the study (written informed consent). The exclusion criteria were: specific contraindication to obesity sur-gery; diabetes secondary to a specific disease (maturity-onset diabetes of the young, latent autoimmune diabetes in adult or pancreatitis); having taken any antibiotic, probiotic, or prebiotic agents during the month before randomisation; pregnancy; debilitating disease; any psy-chological condition which could hamper a patient’s
cooperation; any condition which, in the opinion of the researcher, could have meant that participation in the study was risky or could have biased the results.
Surgical arm: Roux‑en‑Y gastric bypass surgery
Participants in the surgical arm underwent RYGB— whereby a 30 ± 10 mL capacity subcardial gastric pouch was created on a nasogastric 36F calibrating tube by sec-tioning the stomach with a linear stapler 3–4 cm hori-zontally on the lesser curve, 4 cm distant from the e–g junction, and then vertically until attainment of the angle of Hiss. After identification of the Treitz ligament, the jejunum was transected at 100 cm from the ligament of Treitz and the two stumps were closed. The distal stump was anastomosed to the distal end of the gastric pouch. Finally, the proximal stump of the transacted bowel was joined end-to-side to the jejunum 150 cm distant from the gastroenterostomy.
Medical arm: Standard medical therapy
Participants in the medical arm were managed with anti-diabetic standard medical therapy. This was defined as the use of lifestyle (nutrition and exercise counselling) guidelines by ADA to optimise weight loss and glycaemic control, along with frequent glucose self-monitoring and titration strategies, and also drug therapy for hypergly-caemia and restoration of pancreatic cells function [16]. In addition, all subjects were treated according to ADA guidelines for lipid and blood pressure targets.
Follow‑up
The follow-up period ran from October 2014 to May 2016. Clinical visits and laboratory tests were carried out at six points in time: (i) during the screening period; (ii) at baseline, after randomisation (M0); (iii) and at four moments of follow-up—(Months M1; M3; M6; M12 after the RYGB in surgical arm, or after the first appointment in medical arm).
Clinical visits were carried out at all six moments of assessment. Patients were evaluated by an endocrinolo-gist who performed a complete medical history and physical examination, including anthropometric meas-urements (body weight, height, waist circumference, visceral fat area, body fat mass and fat-free mass) using bio-impedance analysis (Inbody®, model 720). Dietary records were also evaluated by a nutritionist, who car-ried out a detailed dietary intake (quality and quantity) for the 24 h period before the interview. Patients also maintained dietary records for the 72 h period before the clinical visit. Laboratory tests included blood biochemi-cal tests and gut microbiota analysis. Blood biochemibiochemi-cal tests were conducted at all six moments of assessment and patients had at least eight hours of fasting, with
trained nurses collecting blood samples at the beginning of the clinical visit. Gut microbiota analyses were con-ducted at M0, M1, M3, M6 and M12, and faecal samples were collected by participants at home, after appropriate exemplification and training of the collection procedure. Faecal samples were collected in the morning, before breakfast. Whole stools were self-collected in sterile boxes and stored at − 20 °C. Samples were treated in the laboratory and stored as 200 mg aliquots at − 80 °C until further analysis.
Biochemical tests
Routine chemical analyses were evaluated using an enzy-matic colorimetric test using the Olympus AU 5400 clinical chemistry analyser (Beckman Coulter®, USA), including glucose (fasting glucose, insulinemia and C-peptide) and lipid profile components of the serum [total cholesterol (TC), high-density lipoprotein cho-lesterol (HDL-C), and Triglycerides (TG)]. Low-density lipoprotein cholesterol (LDL-C) was calculated according to the Friedewald Eq. [17]. The measurement of hemo-globin A1C (A1c) was performed using ion-exchange high-performance liquid chromatography (HPLC) with a Variant™ Turbo A1c (Bio-Rad®, USA). Serum high-sensitivity C-Reactive Protein (hsCRP) was assessed using particle-enhanced immunonephelometric tests with a BN™ II laser nephelometer (Siemens®, Erlangen, Germany). Insulin was assayed using an electrochemilu-minescence immunotest with a Cobas e411 automated analyser (Roche®, Germany). C-Peptide was assessed using electrochemiluminescence immunoassay with a Cobas e411 automated analyser (Roche®, Germany).
Gut microbiota data processing
Gut microbiota profiling was carried out using 16S rRNA targeted sequencing of the V3-V4 hypervariable region using primers derived from Klindwordth et-al. [18], using a methodological approach developed by GenoScreen© (France). This process consists of three steps: (1) the preparation of libraries of amplicons according to the Metabiote® tool, limiting the bias of amplification between samples and including a positive control (the artificial bacterial community "ABC control"), with a first negative control (background of the whole process of libraries construction) and a second negative control (background of the stool extraction step); (2) sequenc-ing of the 16S amplicons libraries on an Illumina MiSeq "paired-end" 2 × 250 bp run; and (3) sorting by sample indexes and reassembly of the two "paired-end" reads to obtain full length 16S rDNA sequences. The 16S library constructions were carried out using 5 ng of gDNA, extracted according to the Metabiote® protocol devel-oped by GenoScreen©.
The raw demultiplexed sequences were processed using
mothur, with default parameters. Abundance tables at the
genus level were rarefied at 2059 reads and were normal-ised before statistical analyses, using the total count pro-cedure. The Bray–Curtis beta-diversity distance matrix was computed using the vegdist function of a vegan R package from the rarefied genus abundance matrix [19]. Principal Coordinate Analysis (PCoA) from Bray–Curtis beta-diversity matrix was carried out with the cmdscale function of a vegan R package.
Enterotype classification was carried out following the Dirichlet Multinomial Mixture (DMM) method of Holmes et al. [20], using the rarefied genus abundance matrix as the input. The DMM approach groups sam-ples together if their taxon abundances can be modelled by the same Dirichlet-Multinomial (DM) distribution. Genus richness was estimated using different methods. Rarefaction to 6,000 reads per sample and upsizing pro-cedure were used to estimate genus diversity. This con-sisted in a 10-times rarefaction procedure, with different alpha diversity metrics (observed genera, Chao1, ACE as richness estimators; Shannon, Simpson and InvSimp-son as evenness estimators). We observed differences in sequencing depth between samples from each group, however this variability was omitted after the rarefaction procedure.
Outcomes
The main outcome of the DM2 study was the quantifica-tion of gut microbiome diversity and composiquantifica-tion after RYGB, compared with standard medical therapy. The secondary outcomes included the relation between T2D remission/improvement (as measured by anthropomet-ric, metabolic and inflammatory biomarkers) and gut microbiota composition and modification throughout the intervention. Both outcomes were assessed at M0, M1, M3, M6 and M12. Diabetes remission was defined as A1c < 6.5%, without using any antidiabetic medica-tion. Diabetes improvement was considered if patients still required non-insulin antidiabetic drugs, but at lower doses compared to the baseline (without insulin use), as well as A1c levels ≤ 7.0% [13].
Statistical analysis
All values are described as mean and standard deviation (SD). Homeostasis model assessment of insulin resist-ance (HOMA-IR), percentage of total weight lost (%WL) and BMI were calculated, in accordance with the litera-ture. The composition of microbiota was expressed with the mean of the normalised relative abundance values. PCoA transformation of the multidimensional data at the genus level was carried out, using the Bray–Curtis beta-diversity distance matrix. A PERMANOVA test on vegan
R package with n = 999 permutations was carried out to test for differences in microbiome composition after sur-gery and interventions for the medical arm. Statistical analyses of the microbiome were carried out using the
momr and relome R packages developed at Institute of
Cardiometabolism and Nutrition (ICAN), France. Non-parametric tests (Wilcoxon, Kruskal-Willis or Spearman correlations) were performed when analyzing microbi-ome data. Benjamini–Hochberg multiple testing adjust-ment was applied (FDR < 0.1 indicates significance).
Paired Mann–Whitney tests were performed to ana-lyse the changes in these parameters between baseline and the various points in time, for each study arm cat-egory. Linear regression was used to analyse associations between continuous variables in different timepoints, for each study arm, and R2 effect size was also calculated. All inferential statistical computations were considered to be significant when p-values were < 0.05. Statistical analysis was carried out using SPSS version 25 (SPSS IBM, New York, NY, USA) and R.
Results
Clinical and biological baseline characteristics
We screened 42 patients, from which we randomised 20 participants in the DM2 study (see Fig. 1). There were two dropouts in the surgical arm: one patient quit the study after allocation and the other was excluded after surgery, due to newly-diagnosed tuberculosis.
Patient’s characteristics are described in Table 1. The average age was 53 vs. 58 years old, BMI was 33.6 vs. 32.0 kg/m2, A1c was 8.7 vs. 8.2%, and women were 50%
vs. 30%, for the surgical arm vs. medical arm, respectively.
There were no significant differences in BMI, A1c, fasting glucose, insulin, C-peptide levels, or HOMA-IR between the two arms. However, patients who underwent RYGB had significantly higher weight, visceral fat area, body fat mass, and serum hsCRP at baseline (Table 1).
Bariatric surgery outperforms medical therapy in improving patients’ anthropometric, metabolic and inflammatory profiles
One month after the beginning of the study, there was no evidence of differences in BMI between arms, however, %WL was significantly higher in the surgical category (10.5 vs. 3.1%, p < 0.001; Table 1). Neither were any sig-nificant differences observed at this time in fasting glu-cose, A1c, or C-peptide between arms. Nonetheless, we found lower insulin levels (6.6 vs. 18.5 mg/dL, p = 0.026) and HOMA-IR (2.5 vs. 6.5, p = 0.035) in the surgical arm.
At three months of follow-up, differences in %WL were even more pronounced (17.7 vs. 5.5%, p < 0.001), and significant differences in BMI (27.7 vs. 30.3 kg/m2,
p = 0.034) were observed, whereas none were for
fast-ing glucose, A1c, or C-peptide between both arms. Nev-ertheless, differences between arms increased as far as insulin levels (6.0 vs. 17.2 mg/dL, p = 0.019) and HOMA-IR (1.9 vs. 6.1, p = 0.013) were concerned.
At six months of follow-up, differences in BMI and %WL continued to be even greater (BMI: 25.7 vs. 30.4 kg/ m2, p < 0.001; %WL: 23.4 vs. 5.2%, p < 0.001) and body fat measures were significantly lower in the surgical arm (visceral fat area, p = 0.029; and body fat mass, p = 0.003). Measures of insulin resistance were also significantly reduced in the surgical arm (A1c: 6.2 vs. 7.3%, p = 0.038; HOMA-IR: 1.6 vs. 7.2, p < 0.001), as were triglycerides (91.9 vs. 143.6 mg/dL, p = 0.049), while HDL-C was sig-nificantly increased (54.4 vs. 40.7 mg/dL, p = 0.014).
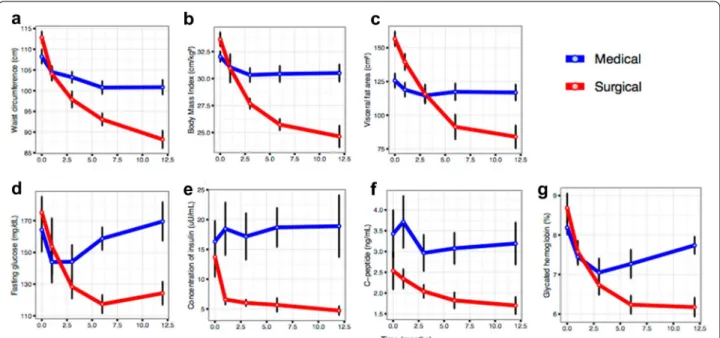
Lastly, at 12 months of follow-up, the average BMI was 24.6 vs. 30.5 kg/m2 (p < 0.001), and A1c was 6.2 vs. 7.7% (p < 0.001) in the surgical vs. medical arm, respec-tively (Table 1). The %WL was 25.5% in the surgical arm and 4.9% in the medical arm (p < 0.001). Waist circum-ference, visceral fat area and body fat mass were statis-tically lower in the surgical arm (p < 0.001, p = 0.007
and p = 0.002, respectively). In addition, fasting glu-cose, insulinemia, C-peptide, and HOMA-IR were sig-nificantly lower in the surgical arm (p = 0.007, p = 0.020,
p = 0.020 and p = 0.027, respectively), and HDL-C was
higher (p = 0.004). See Table 1 for absolute values for each parameter and Fig. 2 for summarised trajectories. At the final endpoint, all participants from the medical arm failed to achieve diabetes remission or improve-ment, however in the surgical arm, 5 participants (62.5%) experienced remission from their diabetes (p = 0.007 for comparison with medical arm, Chi2 test), 2 participants (25%) improved their phenotypes, and only 1 showed no improvement. Supplementary analyses were per-formed using the relative change between baseline and 12 months of follow-up. These results are shown in the supplementary material (Additional file 1: Table S1, Table S2 and Table S3, and Figure S1).
Microbiota composition and clinical phenotypes before interventions
We hypothesised that the clinical changes that occurred in the study cohort may have been accompanied by Fig. 1 Study flowchart. M month
Table
1
Clinical and biolog
ical charac
ter
istics at all time points in sur
gical ar m versus medical ar m Baseline M on th 1 M on th 3 M on th 6 M on th 12 Sur gical arm N= 8 M edical arm N= 10 p q Sur gical arm N= 8 M edical arm N= 10 p q Sur gical arm N= 8 M edical arm N= 10 p q Sur gical arm N= 8 M edical arm N= 10 p q Sur gical arm N= 8 M edical arm N= 10 p q A ge (y ears) 53.4 (8.78) 58.2 (4.73) 0.191 0.48 – – – – – – – – – – – – – – – – Female (%) 4 (50) 3 (30) 0.630 – – – – – – – – – – – – – – – – – Diabet es dura ‑ tion (y ears) 8.12 (4.73) 10.0 (4.42) 0.404 0.620 – – – – – – – – – – – – – – – – W eight (Kg) 92.5 (7.65) 83.9 (9.10) 0.046 0.220 82.6 (4.44) 81.2 (8.82) 0.677 0.860 76.0 (5.77) 79.3 (8.56) 0.358 0.570 71.0 (8.64) 79.5 (8.93) 0.058 0.084 69.2 (11.8) 79.7 (9.07) 0.058 0.096 BMI (%) 33.6 (1.84) 32.0 (1.56) 0.069 0.230 30.9 (3.74) 31.1 (1.78) 0.946 0.950 27.7 (1.36) 30.3 (2.07) 0.005 0.048 25.7 (1.51) 30.4 (2.38) <0.001 0.0012 24.6 (2.87) 30.5 (2.55) <0.001 0.0023 %WL (%) – – – – 10.5 (2.82) 3.15 (2.51) <0.001 <0.001 17.7 (2.96) 5.49 (3.27) <0.001 <0.001 23.4 (4.62) 5.18 (4.28) <0.001 <0.001 25.5 (8.56) 4.88 (5.53) <0.001 0.0018 W aist cir cumf er ‑ ence ( cm) 113 (4.01) 108 (5.47) 0.055 0.220 104 (4.74) 104 (4.48) 0.845 0.890 97.9 (5.59) 103 (4.29) 0.043 0.160 93.1 (4.21) 101 (4.93) 0.003 0.0098 88.2 (5.99) 101 (5.64) <0.001 0.0023 Visceral fat ar ea (cm²) 157 (15.3) 126 (16.7) 0.001 0.0087 139 (17.2) 119 (16.5) 0.022 0.160 116 (19.9) 115 (17.2) 0.897 0.930 91.4 (26.0) 117 (19.8) 0.037 0.061 84.0 (24.0) 117 (18.8) 0.007 0.0190
Body fat mass (Kg) 39.9 (4.60) 30.2 (3.89) <0.001 0.0064 33.6 (5.96) 28.1 (4.19) 0.049 0.190 26.4 (5.84) 26.9 (4.06) 0.838 0.930 19.9 (6.31) 28.2 (4.02) 0.007 0.020 17.9 (5.71) 27.4 (4.71) 0.002 0.0086 Fat ‑fr ee mass (Kg) 52.5 (9.69) 53.7 (9.48) 0.802 0.860 49.0 (8.80) 53.1 (9.32) 0.356 0.600 49.7 (9.10) 52.4 (8.47) 0.529 0.630 51.1 (10.5) 52.2 (8.80) 0.821 0.920 51.2 (9.60) 112 (193) 0.343 0.380 Fasting glucose (mg/dL) 175 (27.9) 164 (43.6) 0.528 0.750 154 (50.4) 144 (41.0) 0.662 0.860 128 (21.1) 144 (33.6) 0.244 0.460 117 (16.5) 159 (22.6) <0.001 0.0024 124 (20.6) 170 (38.7) 0.007 0.019 H bA 1c (%) 8.69 (1.03) 8.19 (0.56) 0.246 0.490 7.57 (0.78) 7.45 (0.66) 0.722 0.860 6.74 (0.71) 7.05 (1.14) 0.487 0.620 6.24 (0.66) 7.27 (1.14) 0.030 0.056 6.17 (0.68) 7.74 (0.69) <0.001 0.0021 Insulin (uU/mL) 13.7 (9.45) 16.3 (11.0) 0.602 0.800 6.59 (2.28) 18.5 (14.0) 0.026 0.160 6.03 (1.58) 17.2 (12.4) 0.019 0.091 5.67 (3.28) 18.7 (10.4) 0.003 0.010 4.72 (2.09) 18.9 (16.5) 0.024 0.048 C ‑peptide (ng/ mL) 2.54 (1.27) 3.43 (1.80) 0.239 0.490 2.34 (0.66) 3.71 (1.98) 0.064 0.20 2.04 (0.45) 2.96 (1.38) 0.072 0.230 1.82 (0.55) 3.08 (1.20) 0.011 0.024 1.70 (0.59) 3.19 (1.60) 0.019 0.042 HOM A ‑IR 5.99 (4.38) 6.58 (4.27) 0.780 0.860 2.54 (1.12) 6.52 (5.01) 0.035 0.170 1.90 (0.53) 6.11 (4.31) 0.013 0.082 1.59 (0.81) 7.20 (3.66) 0.001 0.0039 1.43 (0.66) 8.60 (8.60) 0.027 0.050 Total cholest er ol (mg/dL) 170 (36.0) 165 (56.1) 0.821 0.860 160 (33.5) 153 (42.1) 0.712 0.860 167 (31.1) 146 (53.9) 0.309 0.530 162 (28.2) 160 (41.5) 0.874 0.920 173 (26.3) 155 (41.4) 0.286 0.370 Tr igly cer ides(mg/ dL) 124 (47.7) 186 (175) 0.308 0.560 114 (49.0) 182 (151) 0.210 0.570 108 (32.4) 176 (116) 0.106 0.230 91.9 (30.6) 144 (62.6) 0.038 0.061 100 (42.2) 169 (124) 0.131 0.190 HDL ‑c (mg/dL) 52.0 (15.9) 39.7 (11.8) 0.093 0.270 47.4 (10.9) 40.5 (14.9) 0.275 0.570 51.0 (12.2) 40.0 (13.2) 0.086 0.230 54.4 (7.89) 40.7 (12.0) 0.011 0.024 62.9 (9.64) 41.5 (15.5) 0.003 0.0088 LDL ‑c(mg/dL) 93.4 (23.1) 97.9 (48.7) 0.799 0.860 90.9 (27.1) 87.1 (33.6) 0.795 0.890 94.5 (25.0) 70.6 (34.3) 0.107 0.230 89.6 (20.8) 90.4 (32.7) 0.952 0.950 89.8 (19.8) 79.9 (32.6) 0.441 0.440 Syst olic BP (mmHg) 132 (11.6) 132 (10.5) 1.000 1.000 117 (9.11) 121 (8.71) 0.300 0.570 121 (10.3) 117 (14.7) 0.453 0.610 119 (10.1) 124 (8.29) 0.256 0.350 120 (10.4) 124 (8.56) 0.311 0.370
BMI
body mass inde
x, %WL per cen tage of w eigh t lost , HbA 1c Gly ca ted hemoglobin, HOMA -IR homeosta
tic model assessmen
t f or insulin r esistanc e; HDL -c high densit y lipopr ot ein cholest er ol , LDL -c lo w densit y lipopr ot ein cholest er ol , BP blood pr essur e, hsCRP high sensitivit y C-r eac tiv e pr ot ein, n.a. not applicable Bold v alues ar e sta tistically sig nifican t. Values bet w een par en theses ar e standar d devia tion of the r espec tiv e mean v alue Table 1 ( continued) Baseline M on th 1 M on th 3 M on th 6 M on th 12 Sur gical arm N= 8 M edical arm N= 10 p q Sur gical arm N= 8 M edical arm N= 10 p q Sur gical arm N= 8 M edical arm N= 10 p q Sur gical arm N= 8 M edical arm N= 10 p q Sur gical arm N= 8 M edical arm N= 10 p q Diast olic BP (mmHg) 70.6 (4.84) 66.8 (11.8) 0.370 0.620 62.8 (4.17) 66.7 (12.7) 0.376 0.60 65.6 (5.90) 65.9 (7.46) 0.932 0.930 65.6 (4.37) 68.2 (8.69) 0.428 0.540 63.2 (5.97) 67.0 (8.65) 0.294 0.370 hsCRP (mg/dL) 6.89 (2.95) 2.61 (1.50) 0.004 0.027 6.25 (10.8) 1.36 (0.89) 0.242 0.570 1.94 (1.35) 1.43 (1.21) 0.421 0.610 1.12 (0.82) 1.30 (0.93) 0.677 0.800 0.82 (0.61) 1.39 (0.84) 0.118 0.180
changes in the gut microbiome. Therefore, we charac-terised the latter at different levels of specificity—such as richness, community type, and the genus taxonomic levels. In this study, we computed richness as being the number of present/observed genera. First, we observed no saturation at the genus level during the rarefaction analysis (Additional file 1: Figure S2A), which signifies that the sequencing depth may be insufficient to capture all of the complexity of the microbiome at the genus level. However, the limited sequencing depth would neverthe-less allow the capture of the signal for the most prevalent and abundant rates. We found differences in sequencing depth between study arms (lower in surgical) (Additional file 1: Figure S2B). These differences were levelled out with a rarefaction procedure.
At baseline, we observed a lower genus richness (trend) in the surgical arm, compared with the medical arm (61.37 ± 9.16 vs 71.3 ± 11.19 respectively, p = 0.055) (Additional file 1: Figure S3A). Additionally, when cor-relating genus richness with clinical variables (Additional file 1: Table S4), we observed that the waist circumference (p = 0.014) and hsCRP inflammatory marker (p = 0.023) were negatively associated, as previously described [21,
22], (Additional file 1: Figure S3b–d).
Next, we studied the microbiome data using a com-munity-based approach. Enterotypes were recognised as interesting describers of microbiome abundance data [23]. Indeed, recently an improved enterotyping approach, based on DMM has shown to be better for
capturing a significant signal in the microbial communi-ties [24]. We applied the DMM method, despite difficul-ties in determining the same optimal group number in the Laplacian profile—we fixed it for k = 4 for comparison of the results with the original study (Additional file 1: Figure S2c). The potential drivers of enterotype composi-tion for different groups are: K1: Synergestes (2 genera), Desulfovibrio (delta-proteobacteria), Ruminococcaceae genera Clostridium IV, and Unclassified Ruminococcus; K2: Lachnospiraceae, Ruminococcus; K3: Actinobacte-ria (Bifidobacterium), Bacillales (even less abundant), Enterobacteriales (potentially pro-inflammatory). Addi-tionally, decreased levels of the following were observed:
Faecalibacterium (potentially anti-inflammatory) and
Oscillibacteria (Ruminococcaceae); K4: Lachnospiraceae,
Roseburia, and Ruminococcus (all Clostridiales) (data not
shown).
These enterotype profiles are different from what is observed in previous studies [25–28]. Furthermore, no significant differences are seen in genus richness across enterotypes when considering the entire study cohort (data not shown) [24]. Contrary to what is expected, no significant associations are observed between entero-types and clinical variables at baseline.
Next, we explored compositional changes between study arms at baseline by applying a PERMANOVA test (non-parametric MANOVA from Bray–Curtis beta diversity distance matrix computed with genus abun-dance data). No significant difference was observed Fig. 2 Clinical trajectories throughout the follow‑up time points by study arms. Average values ± standard error values are depicted for each time
point (baseline, 1, 3, 6 and 12 months). Blue and red colours indicate the medical and the surgical arm respectively. a–c corpulence measurements;
(p = 0.095; Additional file 1: Figure S2d). When testing for differentially abundant features between surgical and medical arms at baseline, five genera were observed (not resisting multiple testing adjustment; Additional file 1: Figure S4).
Microbiota changes during the intervention
Despite lower baseline genus richness in the surgical arm (61 ± 9 prokaryotic genera), we found a significant continuous increase until attaining 76 ± 9 prokaryotic genera at M12 (p = 0.03 on paired Wilcoxon tests). On the contrary, genus richness did not change throughout the intervention in the medical arm (71 ± 11 at base-line; 71 ± 10 at M12; p = 0.92 on paired Wilcoxon tests) (Fig. 3a). These findings confirm previous results in patients with severe obesity where microbial gene rich-ness increases after RYGB [29].
The enterotype analyses did not allow us to observe any significant change throughout the intervention, which is probably a consequence of the small number of patients and stratification in the statistical tests. In the surgery arm, the composition analysis indicated signifi-cant changes in the microbiome (R2 = 0.17; permanova p = 0.004) (Fig. 3c). Changes in the medical arm were not significant (Fig. 3b), which confirmed the observations at the richness level.
Furthermore, we searched for specific genera that changed in abundance at the study endpoint, compared to baseline. We observed that Ruminococcus, unclassifie
d_Lachnospiraceae_ family and Faecalibacterium
signifi-cantly decreased, while Klebsiella,
Gammaproteobacte-ria, Enterobacter, unclassified_GammaproteobacteGammaproteobacte-ria, unclassified_Veillonellaceae increased after 12 months
of RYGB. In the medical arm,
unclassified_Lachno-spiraceae and Sutterella significantly decreased, while
unclassified_Clostridiales and unclassified_Bacteria
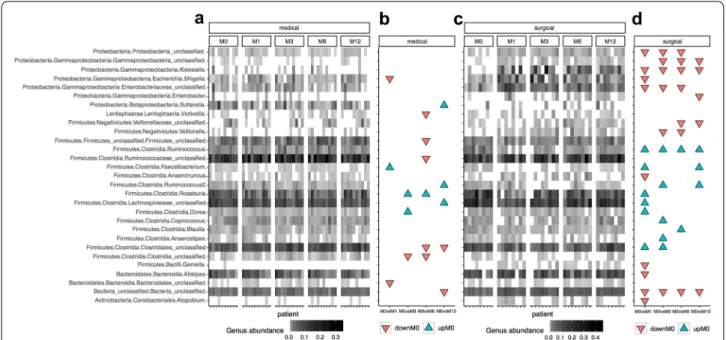
increased, when comparing baseline with M12 (Addi-tional file 1: Figure S5). None of these changes did resist multiple testing adjustment though (Additional file 1: Table S5). The main changes in genus abundance com-paring each timepoint of the study is represented in Fig. 4.
Finally, we explored the differences in the Firmicutes/ Bacteroides ratio (rFB) during the interventions’ follow-up. This score is largely used in microbiome studies as a marker of ecosystem health. No significant differences between the two categories or through time were found in this case (Additional file 1: Figure S6a). However, in agreement with previous findings [30], the Proteobac-teria/Firmicutes ratio (rPF) significantly increased after RYGB, but not in the medical arm (Additional file 1: Fig-ure S6b).
How do microbiome changes relate to phenotypic evolution?
We investigated the associations between relative changes in metabolic parameters and microbial rich-ness. There was a strong inverse relationship between changes in body composition and anthropometric/meta-bolic markers (waist circumference, diastolic blood pres-sure, A1c), as well as inflammation (hsCRP) along with changes in microbial richness (Fig. 5).
Similar analyses looking for associations of rela-tive changes in clinical parameters with changes in tar-get genera (those showing significant changes one year after the interventions from univariate tests) indicated significant associations (FDR < 0.05) between changes in anthropometric variables, glucose sensitivity vari-ables (glycated haemoglobin, insulin), and inflammatory variables (hsCRP), and also changes in Proteobacterial
Fig. 3 Gut genus richness throughout the follow‑up time points and arms. a genus richness distribution across time in each study arm. b PCoA
analysis of microbiome changes through time in the medical arm. c PCoA analysis of microbiome changes through time in the surgical arm. PERMANOVA tests were carried out over beta‑diversity distance matrices computed from rarified genus abundance data testing for differences between time points in each study arm (R2 and P values shown)
lineages, mostly of the gamma clade (Fig. 5 and Addi-tional file 1: Figure S7). We found that improvement in anthropometric, metabolic and inflammatory profiles characterized by decrease in these variables after the
interventions was associated with an increase in gamma-proteobacterial lineages, which were mostly driven by the RYGB surgery. Importantly, there was an inverse associa-tion between the concentraassocia-tion of Klebsiella and body Fig. 4 Abundance profiles of 29 bacterial genus with significant changes throughout the follow‑up time points and arms. a Heatmap of relative
abundances of these 29 genus features in patients of the medical arm. b Significant associations these 29 genus features between baseline and different study points in medical arm (DownM0 = Significant increases in genus abundance at different study points in comparison with baseline; UpM0 = Significant decreases in genus abundance at different study points in comparison with baseline; P value < 0.05, Paried Wicoxon rank‑sum test). c and d panels are equivalent to panels a and b for patients of the surgery arm
Fig. 5 Heatmap of associations of changes between phenotypes and genera between baseline and 12 months of follow‑up. Heatmap of spearman
correlation coefficients between relative change associations of genus richness and target genera with changes in clinical variables. */#: p/q
weight, comparing the baseline to one year after follow-up of metabolic surgery, which corroborate the beneficial metabolic impact of the increase of gamma-proteobac-teria after RYGB. Similarly, improvements in levels of HDL-C after intervention were positively associated with increases in these same gamma-proteobacterial clades, which was significant (FDR < 0.05) only for the
Entero-bacter genus. On the other hand, we found a positive
association (although not significant) between changes in Firmicutes genera (Ruminococcus, Faecalibacterium) and changes in these same clinical variables explained by the phenotypic improvement, along with a decrease in these Firmicutes genera after one year of follow-up (Additional file 1: Figure S5).
Discussion
Bariatric surgery treatment has increased worldwide, being the most efficient procedure for the treatment of severe obesity. The underlying beneficial metabolic effects go beyond weight loss, which has led to the con-sideration of RYGB for diabetic patients with milder forms of obesity. This is the first randomized controlled clinical trial that simultaneously explored clinical and microbiota changes in diabetic patients with class-1 obe-sity after RYGB versus standard medical therapy. We found that both RYGB and standard medical therapy groups improved anthropometric outcomes at 1 year of follow-up, with RYGB patients having significantly higher improvements. However, only RYGB patients achieved improvement/remission in diabetes status (n = 7, 87.5%) and, significantly improved anthropometric and glycae-mic profiles, independently and progressively, during the first year of follow-up and simultaneously had gut micro-biota changes. On the other hand, after an initial clinical improvement in medical therapy arm, at the final end-point all participants failed to achieve diabetes remission or improvement. During the first 6 months the patients were observed 4 times (M0, M1, M3 and M6), which might contributed for the initial improvement seen in this arm, as support of healthcare professionals is one of the most important motivators for lifestyle changes and therapeutic adherence [31]. Sustainable progress after an intensive intervention is challenging and a gap of 6 months without clinical visits (between M6 and M12) might contributed for the decline on clinical benefits, which has also been supported by other authors [32, 33].
Gut microbiota plays a relevant role in the complex causes of obesity and T2D, and is hypothesised to be involved in the modulation of metabolic status after RYGB. Microbial richness is a simple descriptive param-eter of the microbiome. A healthy microbial ecosystem is usually characterised by an elevated level of microbial richness [21, 22]. In addition, one of the key features of
the microbiome that characterises obesity is a low level of microbial richness, which is correlated with metabolic disorders, such as low-grade inflammation, insulin resist-ance, and adipocyte size [21, 34]. Here, microbial rich-ness was measured at the genus level. Despite a trend of lower baseline genus richness in patients in the surgi-cal arm, we observed a continuous increase after RYGB during the 12 months of follow-up. Our results confirm previous observations that RYGB increases microbiome richness, not only in patients with morbid obesity, but also for a broader BMI range, including patients with a BMI 30–35 kg/m2 [29].
As expected, there was a strong inverse association between increase in microbial richness and improve-ment of clinical phenotype, including anthropometric, metabolic (waist circumference, diastolic blood pres-sure, A1c), and inflammatory (hsCRP) biomarkers. These results suggest that systemic and anatomical changes induced by RYGB can restore a putative loss of micro-bial richness with an improvement of metabolic profile. On the contrary, genus richness did not change in the standard medical therapy arm and ended-up being sig-nificantly lower at M12, with no differences in glycaemic profile, comparing to baseline. This suggests that stand-ard medical therapy optimisation does not target the gut microbiota, which reinforces the hypothesis that modu-lation of gut microbiota by pre or probiotics could be a complementary strategy for improving glycaemic status in this context.
Across enterotypes, there were no significant dif-ferences in genus richness, nor in clinical variables at baseline. We hypothesise that as the sequencing depth was relatively low in this study, it provided a low num-ber of observed genera, which significantly influenced the enterotyping outcome. Indeed, the evaluation of the Bray–Curtis distance is mostly driven by the most abun-dant genera, which affects the sensitivity of the analyses. Finally, the number of individuals in each group (four for the baseline K4 therapy, and five for the baseline K4 bypass) decreased the statistical power, making the inter-pretation difficult. However, we observe a significantly higher abundance of Bacteroides genus in the RYGB group in comparison with the medical group in baseline. This bacterial genus has been associated to a dysbiotic microbiome composition associated to low microbial diversity, low microbial cell density and enriched in sev-eral pathologies like Crohn disease, primary sclerosing cholangitis and Inflammatory Bowel Disease [24, 35]. This dysbiotic microbiome composition is also enriched in severe obese patients under RYGB before surgical intervention, decreasing progressively after bariatric sur-gery in parallel with improvements in microbial richness, clinical conditions and weight loss [36].
One year after surgery, we observed a significant decrease in three bacterial taxa belonging to the Firmi-cutes phylum (Ruminococcus,
Lachnospiraceae_unclas-sified and Faecalibacterium), which are recognised as
having anti-inflammatory properties with a benefi-cial impact on metabolic health [14, 29]. The decrease of Firmicutes lineages after bariatric surgery has been reported in different studies [37–39], whereas contra-dictory results are observed in different studies related to the presence of Faecalibacterium prausnitzii [30, 40,
41]. Some studies have also shown Roseburia inhibit pro-inflammatory cytokines (NF-kB) and was negatively asso-ciated with T2DM [42, 43]. In a recent study, Roseburia and Lachnospiraceae increase improved the likelihood of T2DM remission [44]. In our study, we did not find sig-nificant differences in Roseburia composition, though it was observed a Lachnospiraceae_unclassified decreased. This phenomenon might be associated with a diversity of genus inhabiting human gut, which turns strain-spe-cific effects. Furthermore, it has been demonstrated that despite the beneficial effects of bariatric surgery on gly-caemic control and weight reduction, compared to medi-cal therapy alone, both HbA1c and body weight tend to increase over time [45]. This leads us to hypothesise that, despite RYGB improving the metabolic status in T2D patients with mild obesity, RYGB did not have the ability to restore a healthy microbiome composition, especially if it started with a highly dysbiotic microbiome state.
We also observed an increase in abundance of bacteria of the phylum Proteobacteria (Klebsiella,
Gammaproteo-bacteria, Enterobacter, Gammaproteobacteria_unclassi-fied), one year after the surgical intervention, as well as of Veillonellaceae_unclassified (Firmicutes phyla). Increases
in Veillonella and other oral bacterial lineages after RYGB surgery has been reported in other studies associated to decrease of acid secretions consequence to the stomach size reduction, which could facilitate the intestinal colo-nization of oral bacteria [38, 41], whereas an increase in gamma-proteobacteria after bariatric surgery is a com-mon finding—both in humans and in mice [30, 37, 46]. In our study, we also observed an increase of the Pro-teobacteria/Firmicutes ratio after RYGB. The increase of bacteria belonging to the phylum Proteobacteria was associated with the improvement of metabolic and inflammatory parameters after bariatric surgery [47]. In an animal model, the increase of proteobacteria was also accompanied by a reduction in inflammatory response and glucose homeostasis improvement [48]. The phy-lum Proteobacteria is composed of facultative anaerobes, and consequently oxygen increase [49] combined with higher pH after RYGB (in the gut) could contribute to an increase of these bacteria in parallel with improvements on metabolic health. If this increase in proteobacterial
lineages after bariatric surgery have a direct contribution to improvement of health status of severe obese patients or is a response to the drastic anatomical changes in the gut environment consequence of the surgical procedure (high oxygen availability, higher pH, higher amounts of undigested nutrients in parallel to caloric restriction) would require further experiments with animal models in parallel with more precise characterization of enterobac-terial lineages increased after bariatric surgery at strain level with shotgun metagenomics data and de-novo sequence assembly for better understanding of its func-tional role.
On the other hand, we did not observe any significant differences with regards to ratio Firmicutes/Bacteroidetes (rFB). The concept that obesity is associated with a lower percentage of Bacteroidetes and a higher percentage of Firmicutes in obese individuals is contradicted by several studies, which demonstrate that there is no difference in relative abundance of Firmicutes and/or Bacteroides and no association of weight loss with the rFB [50, 51] in obese individuals. Furthermore, T2D has been linked to a decreased abundance of Firmicutes and an increase in bacteria belonging to Bacteroidetes and Proteobacteria, when compared to obese patients [52]. However, it is dif-ficult to validate these links from the results of our study, which included T2D patients with mild obesity, knowing the Firmicutes phylum and Bacteroides contain at least 250 and 20 genera, respectively. Higher taxonomic lev-els may not necessarily reflect specific bacteria changes, however, the results of our study are in line with those of Campisciano et al., as they corroborate that rFB is not a predictive biomarker of the outcome for metabolic sur-gery [53].
Strengths and limitations
This study assessed patients’ evolution at different points in time over the first year of follow-up, including the first and third months after interventions, contrary to the majority of published studies which lack comprehensive data regarding the first six months following baseline and through a 12-month period. These intermediate time-point assessments allowed us to monitor a clear evolu-tion of the clinical profile.
The sample size could have impaired to a degree the multivariate analysis or the effect size of metabolic sur-gery outcomes, and differences in baseline characteristics can limit observations; however, the adjusted pairwise analysis performed can help to obviate these differ-ences, as well as, the results throughout the timepoints were consistent with other studies. Of note is the fact that our observations can be limited by different tech-nical aspects of microbiome analysis, including the col-lection, generation, and quantification of the abundance
profiles. In addition, heterogeneity in dietary profiles and physical activity can also explain part of phenotypic out-comes during the treatment. Dietary data were mainly recorded for the medical arm, but not for the surgical arm throughout the different time-points, which limits our ability to control for food intake in the changes in microbiome profiles. Consequently, dietary analyses were not shown.
Currently anti-diabetic drugs have demonstrated to modulate and change gut microbiota and its metabolic capacity [54]. Conversely, gut microbiome can also influ-ence drug metabolism and its effects [55]. Understand-ing the dynamics of drug-microbiome crosstalk would offer important insights for the development of person-alized manipulation in the future, according to patients’ gut microbiota status. Unfortunately, our study was not designed to understand this bi-directional drug-microbi-ome interaction, which is a limitation of our study. Anti-biotics also affect gut microbiota composition [56]. In this regard, we cannot exclude an influence of peri-oper-ative antibiotics after bariatric surgery in gut microbiota changes, after metabolic surgery.
In conclusion, our research suggests that there is a remarkable phenotypic improvement after metabolic surgery which occurs simultaneously with gut microbiota changes. Nevertheless, gut microbiome changes alone cannot explain the beneficial metabolic health impact of RYGB. Other mechanisms such as diet, hormonal changes, bile acids metabolism, and physical activity need to be further explored in this equation in order to better explain the metabolic improvement of T2D patients with mild obesity after RYGB.
Abbreviations
T2DM: Type 2 diabetes mellitus; RYGB: Roux‑en‑Y gastric bypass; BMI: Body mass index; RCT : Randomised controlled clinical trial; CHSJ: Centro Hospitalar São João; ISRCTN: International Standard Randomised Controlled Trial Number Registry; ADA: American Diabetes Association; TC: Total cholesterol; HDL‑C: High‑density lipoprotein cholesterol; TG: Triglycerides; LDL‑C: Low‑density lipoprotein cholesterol; PCoA: Principal Coordinate Analysis; DMM: Dirichlet Multinomial Mixture; SD: Standard deviation; HOMA‑IR: Homeostasis model assessment of insulin resistance,; %WL: Percentage of total weight lost. Supplementary Information
The online version contains supplementary material available at https:// doi.
org/ 10. 1186/ s13098‑ 021‑ 00672‑1.
Additional file 1. Additional tables and figures. Acknowledgements
Not applicable Authors’ contributions
EL, MFM, DV and PF were responsible for the conception and the design of the study; EL, IB, FC, IM, CPV, ELC, AB and PF conducted the study; EP, EB, PP and MFM designed the analytical approach, processed and analysed the data;
EL, EP, EB, DC, MFM, KC, JD and PF reviewed data and wrote the paper; EL and EP had primary responsibility for final content. All authors read and approved the final manuscript.
Funding
This research was performed independently of any funding, as part of the institutional activity of the investigators.
Availability of data and materials
The datasets used during the current study are available from corresponding author.
Declarations
Ethical approval and informed consent All participants provided informed consent. Consent for publication
Not applicable. Competing interests
The authors declare that the research was conducted in the absence of any commercial or financial relationships that could be construed as a potential conflict of interest.
Author details
1 Department of Endocrinology and Nutrition, Centro Hospitalar de S. João, Alameda Professor Hernani Monteiro, 4200‑319 Porto, Portugal. 2 CINTESIS ‑ Center for Health Technologies and Information Systems Research ‑ Faculty of Medicine, University of Porto, Porto, Portugal. 3 Integromics, Institute of Cardiometabolism and Nutrition, ICAN, Paris, France. 4 I3S – Instituto de Investigação e Inovação em Saúde, Faculty of Medicine, University of Porto, Porto, Portugal. 5 Health Information and Decision Sciences Department ‑ Fac‑ ulty of Medicine, Porto University, Porto, Portugal. 6 Department of Biochemis‑ try, Centro Hospitalar de S. João, Porto, Portugal. 7 EpiUnit – Instituto de Saúde Pública, University of Porto, Porto, Portugal. 8 Department of Nutrition, Centro Hospitalar de S. João, Porto, Portugal. 9 Faculty of Nutrition and Food Science, Porto, Portugal. 10 Department of Pathology, Division of Microbiology, Faculty of Medicine, University of Porto, Porto, Portugal. 11 Surgery and Physiology, Cardiovascular Research Center, Faculty of Medicine, University of Porto, Porto, Portugal. 12 Department of Surgery, Centro Hospitalar de S. João, Porto, Portu‑ gal. 13 Sorbonne Université, INSERM, NutriOmics Research Unit, Pitié‑Salpêtrière Hopital, Paris, France. 14 Université Paris‑Saclay, INRA, MetaGenoPolis, AgroPar‑ isTech, MICALIS, 78350 Jouy‑en‑Josas, France. 15 Unité de Modélisation Mathé‑ matique et Informatique des Systèmes Complexes, IRD, Sorbonne Université, UMMISCO, Paris, France.
Received: 14 January 2021 Accepted: 30 April 2021
References
1. Collaborators TG 2015 O. Health Effects of Overweight and Obesity in 195 Countries over 25 Years. N Engl J Med. 2017;377(1):13–27. https:// doi. org/
10. 1056/ NEJMo a1614 362.
2. Cani P, Delzenne N. The role of the gut microbiota in energy metabolism and metabolic disease. Curr Pharm Des. 2009;15(13):1546–58.
3. Lau E, Marques C, Pestana D, Santoalha M, Carvalho D, Freitas P, et al. The role of I‑FABP as a biomarker of intestinal barrier dysfunction driven by gut microbiota changes in obesity. Nutr Metab (Lond). 2016;13:31. 4. Qin J, Li R, Raes J, Arumugam M, Burgdorf KS, Manichanh C, et al. A
human gut microbial gene catalogue established by metagenomic sequencing. Nature. 2010;464(7285):59–65. https:// doi. org/ 10. 1038/ natur
e08821.
5. Prakash S, Rodes L, Coussa‑Charley M, Tomaro‑Duchesneau C. Gut micro‑ biota: next frontier in understanding human health and development of biotherapeutics. Biologics. 2011;5:71–86.
6. Ley RE, Bäckhed F, Turnbaugh P, Lozupone CA, Knight RD, Gordon JI. Obesity alters gut microbial ecology. Proc Natl Acad Sci U S A. 2005;102(31):11070–5.
7. Qin J, Li Y, Cai Z, Li S, Zhu J, Zhang F, et al. A metagenome‑wide association study of gut microbiota in type 2 diabetes. Nature. 2012;490(7418):55–60. https:// doi. org/ 10. 1038/ natur e11450. 8. Ley RE, Turnbaugh PJ, Klein S, Gordon JI. Microbial ecology: human gut
microbes associated with obesity. Nature. 2006;444(7122):1022–3. 9. Cani PD, Possemiers S, Van De WT, Guiot Y, Everard A, Rottier O, et al.
Changes in gut microbiota control inflammation in obese mice through a mechanism involving GLP‑2‑ driven improvement of gut permeability. Gut. 2009;58:1091–103.
10. Cani PD, Bibiloni R, Knauf C, Waget A, Neyrinck AM, Delzenne NM, et al. Changes in gut microbiota control metabolic endotoxemia‑induced inflammation in high‑fat diet‑induced obesity and diabetes in mice. Diabetes. 2008;57(6):1470–81.
11. Mingrone G, Panunzi S, De Gaetano A, Guidone C, Iaconelli A, Leccesi L, et al. Bariatric surgery versus conventional medical therapy for type 2 diabetes. N Engl J Med. 2012;6(17):1577–85.
12. Schauer PR, Kashyap SR, Wolski K, Brethauer SA, Kirwan JP, Pothier CE, et al. Bariatric surgery versus intensive medical therapy in obese patients with diabetes. N Engl J Med. 2012;366(17):1567–76.
13. Cohen RV, Pinheiro JC, Schiavon CA, Salles JE, Wajchenberg BL, Cum‑ mings DE. Effects of gastric bypass surgery in patients with type 2 diabetes and only mild obesity. Diabetes Care. 2012;35(7):1420–8. 14. Furet J, Kong L, Tap J, Poitou C, Basdevant A, Bouillot J, et al. Differential
adaptation of human gut microbiota to bariatric surgery‑induced weight loss: links with metabolic and low‑grade inflammation markers. Diabetes. 2010;59(December):3049–57.
15. Kong L‑C, Tap J, Aron‑Wisnewsky J, Pelloux V, Basdevant A, Bouillot J‑L, et al. Gut microbiota after gastric bypass in human obesity: increased richness and associations of bacterial genera with adipose tissue genes. Am J Clin Nutr. 2013;98(1):16–24.
16. American Diabetes Association AD. Standards of medical care in diabe‑ tes–2014. Diabetes Care. 2014;37(Supplement 1):S14‑80.
17. Friedewald WT, Levy RI, Fredrickson DS. Estimation of the concentration of low‑density lipoprotein cholesterol in plasma, without use of the preparative ultracentrifuge. Clin Chem. 1972;18(6):499–502. 18. Klindworth A, Pruesse E, Schweer T, Peplies J, Quast C, Horn M, et al.
Evaluation of general 16S ribosomal RNA gene PCR primers for classical and next‑generation sequencing‑based diversity studies. Nucleic Acids Res. 2013;41(1):e1–e1.
19. J O. Vegan: community ecology package. R package vegan, vers. 2.2‑1 [Internet]. http:// outpu ts. world agrof orest ry. org/ cgi‑ bin/ koha/ opac‑ detail.
pl? bibli onumb er= 39154. Accessed 17 Apr 2019.
20. Holmes I, Harris K, Quince C. Dirichlet multinomial mixtures: genera‑ tive models for microbial metagenomics. Gilbert JA, editor. PLoS ONE. 2012;7(2):e30126. https:// doi. org/ 10. 1371/ journ al. pone. 00301 26. 21. Cotillard A, Kennedy SP, Kong LC, Prifti E, Pons N, Le Chatelier E, et al.
Dietary intervention impact on gut microbial gene richness. Nature. 2013;500(7464):585–8.
22. Le Chatelier E, Nielsen T, Qin J, Prifti E, Hildebrand F, Falony G, et al. Richness of human gut microbiome correlates with metabolic markers. Nature. 2013;500(7464):541–6.
23. Arumugam M, Raes J, Pelletier E, Le Paslier D, Yamada T, Mende DR, et al. Enterotypes of the human gut microbiome. Nature. 2011;473(7346):174–80.
24. Vandeputte D, Kathagen G, D’hoe K, Vieira‑Silva S, Valles‑Colomer M, Sabino J, et al. Quantitative microbiome profiling links gut community variation to microbial load. Nature. 2017;551(7681):507. https:// doi. org/
10. 1038/ natur e24460.
25. Koren O, Knights D, Gonzalez A, Waldron L, Segata N, Knight R, et al. A guide to enterotypes across the human body: meta‑analysis of microbial community structures in human microbiome datasets. Eisen JA, editor. PLoS Comput Biol. 2013;9(1):e1002863.
26. Knights D, Ward TL, McKinlay CE, Miller H, Gonzalez A, McDonald D, et al. Rethinking “Enterotypes.” Cell Host Microbe. 2014;16(4):433–7.
27. Costea PI, Hildebrand F, Arumugam M, Bäckhed F, Blaser MJ, Bushman FD, et al. Publisher correction: enterotypes in the landscape of gut microbial community composition. Nat Microbiol. 2018;3(3):388–388.
28. Arumugam M, Raes J, Pelletier E, Le Paslier D, Yamada T, Mende DR, et al. Enterotypes of the human gut microbiome. Nature. 2011;473(7346):174–80.
29. Aron‑Wisnewsky J, Prifti E, Belda E, Ichou F, Kayser BD, Dao MC, et al. Major microbiota dysbiosis in severe obesity: fate after bariatric surgery. Gut. 2018. https:// doi. org/ 10. 1136/ gutjnl‑ 2018‑ 316103.
30. Graessler J, Qin Y, Zhong H, Zhang J, Licinio J, Wong M‑L, et al. Metagen‑ omic sequencing of the human gut microbiome before and after bariatric surgery in obese patients with type 2 diabetes: correlation with inflammatory and metabolic parameters. Pharmacogenomics J. 2013;13(6):514–22.
31. Schmidt SK, Hemmestad L, MacDonald CS, Langberg H, Valentiner LS. Motivation and barriers to maintaining lifestyle changes in patients with type 2 diabetes after an intensive lifestyle intervention (The U‑TURN Trial): a longitudinal qualitative study. Int J Environ Res Public Health. 2020;17(20):7454.
32. Norris SL, Lau J, Smith SJ, Schmid CH, Engelgau MM. Self‑management education for adults with type 2 diabetes: a meta‑analysis of the effect on glycemic control. Diabetes Care. 2002;25(7):1159–71. https:// doi. org/ 10.
2337/ diaca re. 25.7. 1159.
33. Nelson KM, Reiber G, Boyko EJ. Diet and exercise among adults with type 2 diabetes: findings from the third national health and nutrition examina‑ tion survey (NHANES III). Diabetes Care. 2002;25(10):1722–8. https:// doi.
org/ 10. 2337/ diaca re. 25. 10. 1722.
34. Dao MC, Everard A, Aron‑Wisnewsky J, Sokolovska N, Prifti E, Verger EO, et al. Akkermansia muciniphila and improved metabolic health during a dietary intervention in obesity: relationship with gut microbiome rich‑ ness and ecology. Gut. 2016;65(3):426–36.
35. Vieira‑Silva S, Sabino J, Valles‑Colomer M, Falony G, Kathagen G, Caene‑ peel C, et al. Quantitative microbiome profiling disentangles inflamma‑ tion‑ and bile duct obstruction‑associated microbiota alterations across PSC/IBD diagnoses. Nat Microbiol. 2019;4(11):1826–31.
36. Aron‑Wisnewsky J, Prifti E, Belda E, Ichou F, Kayser BD, Dao MC, et al. Major microbiota dysbiosis in severe obesity: fate after bariatric surgery. Gut. 2019;68(1):70–82.
37. Tremaroli V, Karlsson F, Werling M, Ståhlman M, Kovatcheva‑Datchary P, Olbers T, et al. Roux‑en‑Y gastric bypass and vertical banded gastroplasty induce long‑term changes on the human gut microbiome contributing to fat mass regulation. Cell Metab. 2015;22(2):228–38.
38. Anhê FF, Varin TV, Schertzer JD, Marette A. The gut microbiota as a mediator of metabolic benefits after bariatric surgery. Can J Diabetes. 2017;41(4):439–47.
39. Zhang H, DiBaise JK, Zuccolo A, Kudrna D, Braidotti M, Yu Y, et al. Human gut microbiota in obesity and after gastric bypass. Proc Natl Acad Sci. 2009;106(7):2365–70.
40. Furet J‑P, Kong L‑C, Tap J, Poitou C, Basdevant A, Bouillot J‑L, et al. Differ‑ ential adaptation of human gut microbiota to bariatric surgery‑induced weight loss: links with metabolic and low‑grade inflammation markers. Diabetes. 2010;59(12):3049–57.
41. Palleja A, Kashani A, Allin KH, Nielsen T, Zhang C, Li Y, et al. Roux‑en‑Y gastric bypass surgery of morbidly obese patients induces swift and persistent changes of the individual gut microbiota. Genome Med. 2016;8(1):67.
42. Candela M, Biagi E, Soverini M, Consolandi C, Quercia S, Severgnini M, et al. Modulation of gut microbiota dysbioses in type 2 diabetic patients by macrobiotic Ma‑Pi 2 diet. Br J Nutr. 2016;116(1):80–93.
43. Inan MS, Rasoulpour RJ, Yin L, Hubbard AK, Rosenberg DW, Giardina C. The luminal short‑chain fatty acid butyrate modulates NF‑κB activity in a human colonic epithelial cell line. Gastroenterology. 2000;118(4):724–34. 44. Davies N, O’Sullivan JM, Plank LD, Murphy R. Gut microbial predictors
of type 2 diabetes remission following bariatric surgery. Obes Surg. 2020;30(9):3536–48. https:// doi. org/ 10. 1007/ s11695‑ 020‑ 04684‑0. 45. Schauer PR, Bhatt DL, Kirwan JP, Wolski K, Aminian A, Brethauer SA, et al.
Bariatric surgery versus intensive medical therapy for diabetes—5‑year outcomes. N Engl J Med. 2017;376(7):641–51. https:// doi. org/ 10. 1056/
NEJMo a1600 869.
46. Liou AP, Paziuk M, Luevano J‑M, Machineni S, Turnbaugh PJ, Kaplan LM. Conserved shifts in the gut microbiota due to gastric bypass reduce host weight and adiposity. Sci Transl Med. 2013;5(178):178ra41.
47. Kong LC, Wuillemin P‑H, Bastard J‑P, Sokolovska N, Gougis S, Fellahi S, et al. Insulin resistance and inflammation predict kinetic body weight
•fast, convenient online submission •
thorough peer review by experienced researchers in your field
• rapid publication on acceptance
• support for research data, including large and complex data types
•
gold Open Access which fosters wider collaboration and increased citations maximum visibility for your research: over 100M website views per year •
At BMC, research is always in progress. Learn more biomedcentral.com/submissions
Ready to submit your research
Ready to submit your research ? Choose BMC and benefit from: ? Choose BMC and benefit from: changes in response to dietary weight loss and maintenance in over‑
weight and obese subjects by using a Bayesian network approach. Am J Clin Nutr. 2013;1:1385–94.
48. Carvalho BM, Guadagnini D, Tsukumo DML, Schenka AA, Latuf‑Filho P, Vassallo J, et al. Modulation of gut microbiota by antibiotics improves insulin signalling in high‑fat fed mice. Diabetologia. 2012;55(10):2823–34. 49. Hartman AL, Lough DM, Barupal DK, Fiehn O, Fishbein T, Zasloff M, et al.
Human gut microbiome adopts an alternative state following small bowel transplantation. Proc Natl Acad Sci. 2009;106(40):17187–92. 50. Duncan SH, Lobley GE, Holtrop G, Ince J, Johnstone AM, Louis P, et al.
Human colonic microbiota associated with diet, obesity and weight loss. Int J Obes. 2008;32(11):1720–4.
51. Schwiertz A, Taras D, Schäfer K, Beijer S, Bos NA, Donus C, et al. Micro‑ biota and SCFA in lean and overweight healthy subjects. Obesity. 2010;18(1):190–5.
52. Larsen N, Vogensen FK, van den Berg FWJ, Nielsen DS, Andreasen AS, Pedersen BK, et al. Gut microbiota in human adults with type 2 diabetes differs from non‑diabetic adults. PLoS ONE. 2010;5(2):e9085. https:// doi.
org/ 10. 1371/ journ al. pone. 00090 85# pone‑ 00090 85‑ t002.
53. Campisciano G, Palmisano S, Cason C, Giuricin M, Silvestri M, Guerra M, et al. Gut microbiota characterisation in obese patients before and after bariatric surgery. Benef Microbes. 2018;9(3):367–73. https:// doi. org/ 10.
3920/ BM2017. 0152.
54. Gurung M, Li Z, You H, Rodrigues R, Jump DB, Morgun A, et al. Role of gut microbiota in type 2 diabetes pathophysiology. EBioMedicine. 2020;51:102590.
55. Whang A, Nagpal R, Yadav H. Bi‑directional drug‑microbiome interactions of anti‑diabetics. EBioMedicine. 2019;39:591–602.
56. Rodrigues RR, Greer RL, Dong X, DSouza KN, Gurung M, Wu JY, et al. Antibiotic‑induced alterations in gut microbiota are associated with changes in glucose metabolism in healthy mice. Front Microbiol. 2017.
https:// doi. org/ 10. 3389/ fmicb. 2017. 02306/ full.
Publisher’s Note
Springer Nature remains neutral with regard to jurisdictional claims in pub‑ lished maps and institutional affiliations.