HAL Id: hal-03167205
https://hal.archives-ouvertes.fr/hal-03167205
Submitted on 16 Mar 2021HAL is a multi-disciplinary open access
archive for the deposit and dissemination of sci-entific research documents, whether they are pub-lished or not. The documents may come from teaching and research institutions in France or abroad, or from public or private research centers.
L’archive ouverte pluridisciplinaire HAL, est destinée au dépôt et à la diffusion de documents scientifiques de niveau recherche, publiés ou non, émanant des établissements d’enseignement et de recherche français ou étrangers, des laboratoires publics ou privés.
Phenotypic diversity assessment wihin a major ex situ
collection of coffees in Madagascar
Aurore Rimlinger, Nathalie Raharimalala, Véronique Letort, Jean-Jacques
Rakotomalala, Dominique Crouzillat, Romain Guyot, Perla Hamon, Sylvie
Sabatier
To cite this version:
Aurore Rimlinger, Nathalie Raharimalala, Véronique Letort, Jean-Jacques Rakotomalala, Dominique Crouzillat, et al.. Phenotypic diversity assessment wihin a major ex situ collection of coffees in Madagascar. Annals of Botany, Oxford University Press (OUP), 2020, 126 (5), pp.849-863. �10.1093/aob/mcaa073�. �hal-03167205�
1 Original article
1 2 3
Phenotypic diversity assessment within a major ex situ collection of coffees in Madagascar 4
5
Aurore Rimlinger 1, Nathalie Raharimalala 2, Véronique Letort 3, Jean-Jacques 6
Rakotomalala 2, Dominique Crouzillat 4, Romain Guyot 5, Perla Hamon 5, Sylvie Sabatier 1* 7
8
1. CIRAD, UMR AMAP, F-34398 Montpellier, France 9
AMAP Univ Montpellier CIRAD, CNRS, INRAE, IRD, Montpellier 10
2. FOFIFA, BP 1444, Ambatobe, Antanarivo 101, Madagasca 11
3. Laboratoire de Mathématiques et Informatique pour la Complexité et les Systèmes, 12
CentraleSupélec, Université Paris-Saclay, 91190 Gif-sur-Yvette, France, 13
4. Nestlé Centre Tours, BP 49716, F-37097 Tours cedex 2, France 14
5. DIADE, Univ Montpellier IRD CIRAD Montpellier, France 15
16
Running title: Wild Madagascan coffee variation. 17
corresponding author: Sylvie Sabatier, CIRAD, UMR AMAP, 34398 Montpellier, France 18 mailto:sylvie-annabel.sabatier@cirad.fr 19 Tel: +33 (0)467616585 20 Fax: +33 (0)467644913 21 22 23
2 ABSTRACT
1 2
Background and aims. 3
Like other clades, the Coffea genus is highly diversified on the island of Madagascar. The 66 4
endemic species have colonized various environments and consequently exhibit a wide 5
diversity of morphological, functional, phenological features and reproductive strategies. The 6
trends of interspecific trait variation, which stems from interactions between genetically 7
defined species and their environment, still needed to be addressed for Malagasy coffee trees. 8
Methods. 9
The structure of endemic wild coffees was explored in terms of morphological, phenological, 10
and functional traits. The environmental (natural habitat) effect was assessed on traits in 11
species in distinct natural habitats. Phylogenetic signal (Pagel’s λ, Blomberg’s K) was used to 12
quantify trait proximities among species according to their phylogenetic relatedness. 13
Key result. 14
Phylogenetic signal was found to vary greatly across and even within trait categories. The 15
highest values being exhibited by the ratio of internode mass to leaf mass, the length of the 16
maturation phase anf the LDMC. By contrast, traits weakly linked to phylogeny were either 17
contrained by environment (leaf size) or under selective pressures. 18
Conclusions 19
This study brings insight into complex patterns of trait variability. The length of the 20
maturation phase, an adaptive trait, shows a strong phylogenetic signal as does the ratio 21
between the stem dry mass and leaf dry mass. 22
23
Keywords: phenology, LMA, LDMC, functional traits, Coffea, Rubiaceae 24
3 INTRODUCTION
1 2
Tropical rainforests of Africa and Madagascar harbor huge biodiversity characterized by great 3
species richness and endemicity (Myers, 2000; Yoder and Novak 2006, Vences et al. 2009). 4
In such context, for the genera that experienced radiative speciation, phenotypic divergence 5
can be important while the associated genetic differentiation could remain low resulting in 6
low congruency between genetic and phenotypic diversity, and in the recognition of 7
morphological units as species (Shaffer and Thomson, 2007). For instance, 58 and 47 Coffea 8
species (excluding ex-Psilanthus genus and Baracoffea grouping) respectively from 9
Madagascar and Africa were described (Davis et al. 2006, Couturon et al. 2016), although 10
three and seven species from Madagascar and Africa respectively are not yet formally 11
recognized. 12
For Coffee, clear relationships between species was not permitted by analysis conducted with 13
two ITS plus four plastid sequences (Maurin et al. 2007), nor with a limited number of 14
nuclear microsatellite markers (Razafinarivo et al. 2013). A completely resolved molecular 15
phylogenetic tree was obtained using 28,800 concatenated SNPs obtained from Genotyping-16
By-Sequencing (GBS) methodology (Hamon et al. 2017). The necessity to use GBS for 17
assessment of between-species genetic divergence could be explained by two non-exclusive 18
mechanisms: 1) the absence of strong genetic barrier and therefore the maintenance of gene 19
flow between species even at a low rate (Hey 2006, Nosil 2008, Niemiller et al 2008) and 2) 20
recent speciation coupled with rapid morphological divergence (Janssen et al. 2008). 21
Regarding Madagascar speciation, the general agreement states that “the importance of 22
dispersal to the assembly of the Malagasy flora cannot be denied”(Yoder and Nowak, 2006). 23
The high level of speciation seems to be associated with the existence of different small 24
4 niches side-by-side. Therefore, the resulting species should be highly differentiated at the 1
phenotypic level but not, or less, at the genetic one (Yoder and Nowak, 2006). 2
3
In addition to environmental selective pressures, traits (i.e. individual heritable features, as 4
defined by Garnier and Navas 2012) are also shaped by developmental (i.e. structural 5
limitation on phenotypic variability, as defined by Smith et al. 1985), functional and genetic 6
constraints. 7
Common evolutionary origin or, at the opposite, evolutionary convergence could be the result 8
of similar trait values for two species, or of correlations between traits. Hence, functionally 9
similar species may belong to the same clade or may be phylogenetically distant. Regarding 10
leaf functional traits such LMA, leaf mass per area, and LDMC (ratio dry leaf mass/fresh leaf 11
mass); high LMA values characterize plants with low growth producing large leaves but 12
whose longevity is low (Westoby et al 2002); high LDMC values characterize plants whose 13
foliar organs accumulate nutrients and constitute important storage pools with low tissue 14
turnover. Therefore, the study of their relationship permits to test whether there is 15
compensatory effect between these two traits and whether this correlation still exists in case 16
of evolutionary trade off. 17
The most recent Coffea molecular phylogeny highlighted independent and parallel 18
diversification in the two landmasses Africa and Madagascar (Hamon et al. 2017) resulting in 19
total endemism in these main regions. More widely, none of the species occurring in West 20
and Central Africa is found in East Africa, in the Western Indian Ocean Islands, nor in Asia 21
(broad sense) and conversely. Another important characteristic concerns the great 22
vulnerability of Coffea species, as their distribution is generally restricted to one or a few 23
forests (Davis et al., 2006; http://publish.plantnet-project.org/project/wildcofdb). In such 24
context, forest cutovers and burns, human activities, and natural hazard (cyclones, fires) could 25
5 dramatically decrease Coffea richness both at the population and species levels. As a 1
consequence, more than 80% of Coffea species are present on the red list of endangered 2
species of the IUCN (from nearly threatened to critically endangered, Davis et al. 2006). Yet, 3
wild Madagascan species constitute highly valuable genetic resources (Andrianasolo et al. 4
2013). A large part of the Malagasy species are grouped together in an ex situ collection. Such 5
collection is especially important for coffees since some of them have already disappeared 6
from their natural habitat (Krishnan et al. 2013). As part of the study, we were able to carry 7
out in situ and ex situ comparisons of genetic diversity for four species and two populations 8
per species. This study showed a strong genetic diversity in the ex situ collection 9
(Andrianasolo et al., 2013). The plants in collection are very valuable for studies on 10
interspecific variability. 11
12
Madagascan Coffea show different growth habits, growing as ligneous shrubs, treelets or 13
trees. They are mainly plants, with only monopodial growth, axillary inflorescences and 14
evergreen leaves (66 species at all; Davis et al., 2006, Couturon et al., 2016, 15
http://publish.plantnet-project.org/project/wildcofdb). But some species have a sympodial 16
growth (Davis and Rakotonasolo, 2008). Most Coffea species conform to the Roux’s 17
architectural model with rhythmic growth and continuous branching, and lateral flowering on 18
the plagiotropic branches (Hallé et al., 1978). In Coffea species, stem growth occurs phytomer 19
by phytomer, with a phyllochron that varies depending on seasonality (Varossieau, 1940). 20
Another striking example of adaptation lies in their phenological traits. For all species, 21
inflorescence and flower development require the dry season to be followed by a an adequate 22
rainfall (Portères, 1946).The number of days from this triggering rain to the opening of the 23
flower bud (anthesis) is genetically determined and depends on the species considered (Le 24
Pierrès, 1995; Noirot et al, 2016). A better knowledge of the reproductive strategies is an 25
6 important first step for the development of appropriate conservation strategies. The length of 1
the maturation phase which correspond to the time between the seed emission and the seed 2
germination is very variable between species according to the plant habitat. 3
4
Within the past few years, as more phylogenetic data got available, a number of studies have 5
connected phylogenetic analyses with phenotypic, physiological, or phenological traits 6
(Reginato and Michelangi, 2016; Bacon et al., 2016). Several descriptive statistics have been 7
introduced to gauge phylogenetic signal as a quantity that could thus help compare different 8
traits across phylogenies (Pagel 1999; Blomberg et al. 2003). Not all traits behave similarly 9
for closely-related species: while some traits stay stable throughout the phylogeny (Davies et 10
al., 2013), others are highly labile (Cavender-Bares et al., 2009). Owing to shared ancestry, 11
non-independence caused by evolutionary history is expected from species traits. 12
Phylogenetic signal measures this tendency for related species (Blomberg and Garland, 2002): 13
the stronger the signal, the larger the influence of the phylogenetic structure on the species 14
traits. 15
16
In this study, the availability of Coffea molecular phylogeny and phenotypic data for a large 17
set of Madagascan wild coffees allows us to address the following questions: How is the 18
phenotypic variation distributed among Madagascan wild coffee species and which are their 19
phenotypic relationships? Are there different reproductive strategies? Are there phenotypic 20
traits associated with species evolution, and thus expressing phylogenetic signal? 21
22 23
MATERIALS AND METHODS 24
7 Plant Material
1
Plant material comes from the ex situ Coffea collection at the Kianjavato Coffee Research 2
Station (KCRS) in Madagascar, (coordinates S 21°22'28", E 47°52'02"). The collection is
3
situated 550 km away from Antananarivo, at altitudes ranging from 50 to 400 m above sea
4
level. The collection is mainly constituted by Madagascan wild Coffea species (Chevalier, 5
1942) excluding the Baracoffea group from the Western coast described by Davis and 6
Rakotonasolo (2008). They are representatives of the five botanical series from the Great 7
Island, which were classified by Charrier (1978) according to floral and leaf traits. These 8
series are named Garcinioides, Millotii complex, Multiflorae, Subterminales and Verae. 9
The coffee trees sampled are adult trees mainly collected between 1960s and 1980s, growing 10
under natural forest cover. Details on plant material (such as species name, botanical series, 11
geographic origin, and coordinates) are provided in Table 1. 12
13
Phenotypic records 14
Records were done during years 2010-2011, 2013-2014 on a total of 364 plants from 63 15
populations corresponding to 36 species. Descriptive (such as, leaf shape and color, domatia 16
position, aperture shape and pubescence) and quantitative traits on the numbers, leaves, fruits, 17
seeds size and phenology (number of days between the triggering rain and blossoming, 18
between flowering and ripening, number of flowers per inflorescence) were recorded. 19
Excepting for leaves, fruits and seeds measurements, the trait records were done on a 20
maximum of ten trees (depending on the availability) per population. 21
Mature leaves measurements were performed on five leaves (picked on the fifth branching 22
from the top) and five trees per population. 23
Measurements for fruits (including 100-seed weight and fruit disc diameter) were done on 20 24
and 40 seeds and fruits respectively per population. Four additional variables were calculated: 25
8 i) the shape index of leaves as the ratio of length to width; ii) the surface index as length x 1
width; volume indices of iii) fruits and iv) seeds as length x width x thickness. The 28 2
variables and range of variation are listed in Table S1. 3
The number of days for maximum seed germination was obtained after sowing between 68 4
and 120 seeds per harvest in nurseries at Kianjavato. This trait was recorded for 47 5
populations corresponding to 28 species. 6
Two functional attributes, leaf mass per area (LMA, recorded for 39 populations either 33 7
species) and leaf dry matter content (LDMC, i.e. the ratio of leaf dry mass to leaf fresh mass) 8
which was recorded for 30 populations either 29 species, were added, as well as two 9
physiological attributes: stomata density and stomata length, as measured in Razafinarivo et 10
al. (2012) were recorded for 56 populations either 35 species. The Leaver module was used to 11
extract leaf area with the plugin Toaster (Tree and plant organs and structures analyzer, 12
Borianne, 2012) run in the ImageJ software. The leaf dry mass was obtained after being dried 13
four days in the oven (60°C). For all species, in order to compare even-aged organs, the 14
measurements of size leaf and internode have been made on the more recent metamer at the 15
branch extremity and in full light. These metamer were green and without secondary growth. 16
17
Environmental parameters 18
Climatic data were extracted from GPS coordinates of each species (Table 1) and from 19
worldclim information (http://www.worldclim.org). The “habitat class”, (Table 1) is obtained 20
from a distribution of the number of dry months of each species original habitat. 21
Among the 19 available bioclimatic variables, five (Annual Mean Temperature, Max 22
Temperature of Warmest Month, Min Temperature of Coldest Month and Annual 23
Precipitation) were retained for this study. Additional climate data such as Annual Potential 24
evapotranspiration, Climatic Water Deficit and, Number of Dry Months were extracted from 25
9 MadaClim (https://madaclim.cirad.fr/). An Index of Aridity was also calculated as annual 1
precipitation minus annual potential evapotranspiration (Table 2). 2
3
Statistical analyses
4
Relationships among Madagascan wild coffees 5
Given that the recorded traits are quantitative and qualitative, quantitative traits (at all 14) 6
were transformed into either similar size classes or well distinct range classes depending on 7
the distribution of the trait. For the qualitative trait, each modality became a new trait. 8
Therefore, from the 28 initial variables, a total of 107 new variables were obtained and 9
encoded 1-0 for presence-absence. With the aim to assess the relationships between 10
individuals within populations, populations within species and between species, a Neighbour 11
Joining (NJ) tree based on matrix of Dice’s dissimilarities indices and 200 bootstraps was 12
constructed using DARwin v.5 (Perrier and Jacquemoud-Collet, 2006). 13
For quantitative traits (reproductive, vegetative, phenological, physiological and functional 14
leaf traits), we used standardized data to visualize for each trait and each species the deviation 15
to the mean of the values obtained for all the species. The results for each species are ordered 16
following the rooted molecular phylogenetic tree extracted from Hamon et al. (2017). 17
18
Relationships between phenotypic and bioclimatic traits 19
Three habitat classes of species were defined according to the number of dry months from the 20
original population location: 0-1 dry month for S1, 2-6 dry months for S2 and >6 months for 21
S3. Comparisons were performed on seven traits recorded for all populations investigated (63 22
populations corresponding to 36 species). For 15 traits, data were obtained for 54 to 61 23
populations. Six traits were recorded for 30 to 39 populations corresponding to at least 29 24
10 species. Mean comparisons between subsets were performed with ANOVA using R (R Core 1
Team, 2015). 2
3
Analysis of interspecific and intra specific (population) diversity 4
We summarized the interspecific and intraspecific (population) trait variation in the table S2 5
(Supplementary material), showing the mean trait values for a set of species. Differences 6
between populations were analyzed by one-way ANOVA and the Tukey test. We also verified 7
the contribution of the population level to the total trait variation by decomposing the variance 8
of each trait using a linear mixed model that took into account the nested structure of the 9
sampling design (package lme4, Bates et al., 2015).. 10
11
The phylogenetic signal 12
The phylogenetic signal allows a better understanding of the evolutionary traits within a 13
group. The phylogeneticPagel’s λ (Pagel, 1999) and Blomberg’s K indices (Blomberg et al., 14
2003) were selected after assessment of their respective performance and shortcomings. 15
Pagel’s λ estimated by a maximum-likelihood approach provides the most probable 16
description of the observed trait distribution given Brownian model for trait evolution (BM). 17
A value of λ equal to 1 indicates that the trait evolves exactly as suggested from the original 18
topology of phylogeny while a value of λ equal to 0 means an absence of phylogenetic signal. 19
Blomberg’s statistic (K) quantifies phylogenetic signal. It is a descriptive statistical parameter 20
to describe the degree of the difference between the F-statistic of simulated data and observed 21
F-statistic distribution by the ratio of the observed mean squared error derived from a 22
phylogenetically corrected mean and the expected mean square error obtained from the 23
analysis by considering tree topology and branch length information. A K value inferior to 24
one suggests that the trait evolution was independent of phylogeny (i.e. the phylogenetic 25
11 signal is low). A K value equal to 1 suggests that the trait has evolved at a constant rate during 1
species evolution, while K > 1 indicates a higher phylogenetic signal for the considered trait 2
(i.e. the trait is more similar for related species than expected by the evolutionary model). The 3
significance of K is obtained from 999 permutations. Phylogenetic signal was only considered 4
significant for a trait when both Pagel’s λ and Blomberg’s K gave consistent results with the 5
following thresholds for the p-values: pλ < 0.05 and pK < 0.1. Phylogenetic signals were 6
estimated with the function phylosig in package ‘phytools’ (Revell, 2012) from mean values 7
data per species for 29 to 36 species depending on the trait. 8
Statistical tests (normality, independence and homoscedasticity of residuals) for validation of 9
the linear model were performed using package lmtest (Zeileis and Hothorn, 2002). 10
Calculations were performed with the function pgls of the R package ‘caper’ (Orme et al., 11
2012). Figures drawings are performed within R 3.2.5. 12
13
RESULTS 14
Structuring of wild coffees based on traits
15
Individual phenotypic relationships showed that globally, intraspecific variation was lower 16
than interspecific variation, which can be seen in the table S2 (Supplementary material) with 17
ANOVA results on interspecific variation compared to intraspecific (population) variation. 18
The deviation to the mean was lower for intraspecific variation, and populations were 19
generally pooled into fewer groups than did species. The contribution of intraspecific 20
diversity to the variance of species traits (table S3, Supplementary material) varied between 21
traits, being fairly high (leaf length , number of flowers per inflorescence), moderate (shape 22
index, petiole length) or low (length of the maturation phase). 23
12 The estimation of dissimilarity indices within populations lower than between species (Figure 1
1). As an example, C. resinosa individuals were grouped close to each another, even if they 2
are exhibiting an important phenotypic variability. 3
Only two Charrier’s series (the Millotii complex and the Garcinioides) appeared very 4
homogenous but no overall structuring according to the botanical series classification is 5
obvious. Using standardized data for each trait permitted to discern some trends following 6
phylogenetic species relationships (Figure 2). The ratio between internode mass and leaf mass 7
was higher for three species: C. vohemarensis and C. vatovavyensis (Subterminale serie) and 8
C. bertrandii (Multiflorae serie) that are highly branched and bear small leaves. 9
Another grouping of sister species (Figure 2, in red) was characterized by long petiole and 10
leaves, thick and long internodes, large leaf area, large fruits and seeds (Figure 3A). Similarly, 11
a grouping of northern species (Figure 2, in yellow) was characterized by a long maturation 12
phase and included two species easy to identify from their fruit shape (C. tsirananae, Figure 13
3B) or their leaf shape (C. heimii, Figure 3C). The latter species also exhibited the highest 14
value for LMA. 15
Reproductive traits and strategies 16
Madagascan wild coffee trees exhibited a wide range of number of days between the 17
triggering rain and the flowering (from 4 to 13 days). Two series, Garcinioides and Millotii 18
complex, were characterized by a long duration from rainfall to flowering (10-13 days) while 19
the Verae exhibited a short to medium duration (4-7 days). Regarding the three bioclimatic 20
subsets of species S1, S2 and S3, the range of the number of days between the trigger rain and 21
blossoming was large for the three subsets going from four to 10 ( S2) or 13 (S1) days and, 22
from seven to 12 for S3 (Figure 4A). The Multiflorae appeared as the most diverse series with 23
from short (4 days) to long (10 days) durations (Figure 4B). 24
13 Maturation phase lengths were also diverse and ranged from 59 to more than 350 days. In 1
very humid habitats (0 to 1 dry month) as well as in intermediate habitats (2 to 6 dry months), 2
species ripen in 2 to 6 months. In very dry habitats (>6 dry months), species ripened in 3
contrasted time, either 2-3 months (for the majority), either around one year (Figure 5A). 4
Dates for harvest went around the year from January to December (Figure 5B). Early species 5
(all Verae, and majority of Subterminales and Multiflorae) were harvested from January to 6
February. Medium species (mainly Millotii) were harvested from March to May and very late 7
species (all Garcinioides) from mid-November to December. The sequence of harvest was 8
nearly invariable whatever the year. Considering seed germination; generally there was either 9
no dormancy or germination after a couple of months. 10
In humid (S1) and intermediate (S2) habitats, maturation phase and seed germination took 11
place during the hot rainy season with short time between the two physiological steps. 12
However, in dry habitats (S3), two behaviors were found. Either species (such as C. 13
boiviniana) had a very short maturation phase followed by seed germination few weeks after, 14
either species such as C. tsirananae had a long maturation phase (around one year) followed 15
by immediate seed germination (occurring during the rainy season at year n+1 after the 16
flowering). An overview of the timing of the different reproductive phases considered as 17
reproductive strategies is given in Figure 6. 18
19
Environmental effect 20
Given the distribution of the number of dry months in their natural habitats, three habitat class 21
of species were defined from the bioclimatic parameters of their natural habitat. The main 22
features of these habitat class of species are given in Table 2. 23
Higher the number of dry months, higher the range of the average temperature of the coldest 24
month and higher the annual potential evapotranspiration as a result of warm temperature. 25
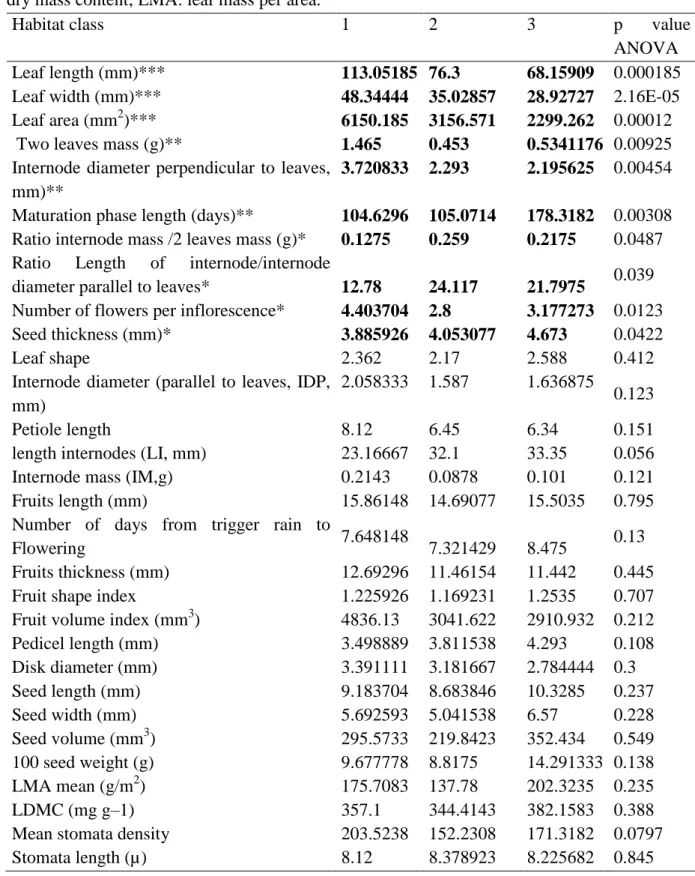
14 Regarding biological trait, mean comparisons between habitat class for each trait showed 1
significant differences between the three habitat class as described in Table 3 for vegetative 2
traits (leaf length, leaf width and leaf area, two leaves mass and internode diameter 3
perpendicular to leaves, ratio of internode mass/two leaves mass, ratio of internode 4
length/diameter, Ratio Length of internode/internode diameter parallel to leaves), and 5
reproductive traits (number of flowers per inflorescence,maturation phase length, and seed 6 thickness). 7 8 Phylogenetic signal 9
The phylogenetic signal allows a better understanding of the evolutionary traits within a 10
group. Phylogenetical signal was assessed using Pagels’ λ and Blomberg’s K parameters to 11
describe the degree of the difference between the F-statistic of simulated data obtained from 12
999 permutations and observed F-statistic distributions. 13
We found that 9 traits (ratio of internode mass/leaf mass, petiole length, parallel internode 14
diameter, ratio of internode length/diameter, leaf length, the length of the maturation phase, 15
seed shape index, LDMC, stomata length and stomata density) evolved in relation with 16
species evolution (Figure 7). 17
18
DISCUSSION 19
Reproductive strategies and limitation of gene flow 20
Our study showed that phenology parameters (the number of days for blossoming after the 21
trigger rain and the maturation phase length, see Fig 4 and 5) did not correlate with natural 22
habitat type; similar range of variation was observed in the three types. For coffees, flowering 23
requires two important steps. The first one is the buds inducing that is set up after a dry 24
period. It is climate dependent as was reported in New-Caledonia by Gomez et al. (2016). 25
15 Indeed, flowering patterns for the three cultivated Coffea species (C. canephora, C. liberica 1
and C. arabica) introduced during the beginning of 19 century followed the timing and 2
sequence of precipitation in the study area. The second step corresponds to the development 3
of the flower buds following a trigger rain (of at least 10 mm, Portères, 1946). It is genetically 4
determined since the average number of days between the trigger rain and the blossoming is 5
fixed for each species and ranged here between 5 and 13 days (Noirot et al., 2016). These 6
values remained invariable whatever the growing place as was observed in New-Caledonia 7
for the three introduced species (Gomez et al. 2016). In such conditions, climate changes or 8
new climate growing environment should affect only buds inducing and then, as a 9
consequence, the quality of blossoming that depends on the intensity of the trigger rain. Under 10
climatic changes, flowering could be disturbed. Erratic flowerings might open the way for 11
flowering synchronization of usually non-synchronous flowering species and thus favoring 12
unusual gene flow. However, the loss of species integrity involve also cross-species 13
hybridization success and capability to produce fertile progenies. This phenomenon is 14
probably at the origin of the natural cross between two wild species, producing the famous 15
Arabica coffee (Carvalho, 1952; Lashermes et al, 1999). 16
17
Within tropical forests, a broad spectrum of flowering patterns has been found (Sakai 2001), 18
and observed variations in phenology may arise from phenotypic plasticity or from 19
genetically based local adaptations or a combination thereof (e.g., Zalamea et al. 2011; 20
Anderson et al. 2012). Coffee flowering phenology has been characterized as highly 21
dependent on climatic factors such as precipitation (Crisosto et al. 1992), and temperature 22
(Lin 2008), and it is genetically controlled (Le Pierrès 1995). The time between this rain and 23
the flowering date was well conserved, strictly species-dependent and followed a clear 24
16 sequence in which C. liberica flowered first, followed by C. canephora and then C. arabica 1
both in Africa and New-Caledonia (Gomez et al. 2016). 2
For Madagascan wild coffees, the sequence of flowering is also well-conserved starting in 3
September by C. sp. ‘Sambava-Diego’ (described in Couturon et al. 2016 and in 4
http://publish.plantnet-project.org/project/wildcofdb) and C. vatovavyensis. This is followed 5
in October by a part of Subterminales, Millotii complex and Multiflorae species, followed in 6
November by the late-flowering species belonging to Millotii complex and Multiflorae, all the 7
Garcinioides and C. boiviniana, C. alleizettii, C. augagneuri, C. ratsimamangae and C. 8
sakarahae (Subterminales) and finishing in December with the very late-flowering C. 9
tsirananae (Subterminales). 10
Flowering patterns in Coffea thus appear to have a strong genetic component, causing the 11
flowering times of each species to remain distinct (Akaffou et al. 2014). Partly asynchronous 12
responses among species to key environmental factors would thus be expected to act as 13
prezygotic barriers. The lack of a well-marked dry season is considered to influence flower 14
bud formation by creating different levels of induction (Crisosto et al. 1992) and favoring 15
multiple flowering events during a season (Allan, E., and J. R. Pannell. 2009). However, we 16
do not know whether adaptive evolution will allow populations to reach new phenotypic 17
optima rapidly enough to keep pace with climate change (Anderson et al., 2012). 18
19
Reproductive barriers due to no overlap of flowering is very important for sympatric species. 20
This is all the more important given that hand-cross fertilizations in coffees were done in 21
Ivory Coast and in Madagascar (Louarn 1992, Charrier 1978). Despite differences in F1 22
hybrids and F1 fertility rates, the authors concluded that coffees share the same nuclear 23
genome. Therefore, in natural conditions, species integrity in sympatry conditions should be 24
mainly maintained by no flowering overlapping. So, the differences in days between the 25
17 trigger rain and blossoming are an essential component. However, this physiologic barrier is 1
not absolute. Buds inducing is highly dependent on climate parameters (alternating dry and 2
rainy periods). Reproductive strategies involve mechanisms that favor species integrity 3
(physiologic flow gene barrier), and species survival in climate changes and during new niche 4
colonization. 5
For species survival, legitimate seed germination must benefit from rains to produce plantlets 6
that can skip the dry season without damage. In Africa, short maturation phases are only 7
observed in the lowlands of East Africa while long maturation phase are recorded in West and 8
Central Africa plus high-altitudes of East Africa. In Madagascar, northern species among 9
Subterminales have either very short maturation phase either very long maturation phase. This 10
indicates two opposite strategies to avoid the dry season. Three behavior have been observed 11
in Seasonally Dry Tropical Forest: (1) flowering and fruiting exclusively in in the rainy 12
season or (2) flowering in the rainy season and fruiting in the dry season or (3) flowering and 13
fruiting in the dry season (Luna-Nieves et al., 2017). The seasonal variation of irradiance 14
influenced seed development times (Zimmerman et al; 2007). 15
16
Climate effect on traits related to plant development. 17
Ours results shown that the climatic factors affect leaf size and mass, the diameter of green 18
internodes which is a proxy of the size of meristem (see Table 3). These features decreased 19
with increasing aridity. The size of leaves is an adaptive trait to drought (Westoby et al., 20
2002; Wright et al., 2017). In dry climate, the leaves are small and thick with a high LMA 21
(Niinemets, 2001). 22
The leaves of Coffea species of humid region have short internodes and large internode 23
diameter and therefore a weak ratio of internode length to diameter. On the contrary, the 24
species of arid region have long internode and small internode diameter and thus a high ratio 25
18 of internode length-to-diameter. Our results are in line with Corner's rules on the leaf/stem 1
size: the species with a large leaves have a thick stem and large fruits and weak branching 2
while the species with small leaves have a thin stem and small fruits and high branching 3
(Corner, 1949). In wild Coffea, our results show that the species with large leaves have large 4
green internode diameter, proxy of the size of apical meristem. 5
6
A positive relationship was found between the leaf size and the internode diameter. Leaves 7
intercept light and acquire carbon, while stems transport water with nutrients and 8
mechanically support the leaves, thus leaf and stem traits are expected to be highly 9
coordinated biomechanically and physiologically (Westoby et al., 2002). 10
11
The climatic factors influence the value of ratio between internode mass and leaf mass which 12
are higher for species growing in intermediate and arid regions (see table 3). Thus, these 13
species allocate more to the stem than to the leaves. In arid environment, the species with 14
small leaves are favored because they have a high LMA and thus a better photosynthetic 15
capacity (Westoby et al., 2002). The mechanical cost is the lowest for the species with small 16
leaves (Givnish 1987). The small leaves are dense and thick (Niinemets 2001) with a low 17
transpiration (Westoby et al., 2002). 18
19
Phylogenetic signal 20
The phylogenetical signal of ratio of internode mass to leaf mass was highly significant (see 21
fig. 7). This ratio illustrates the variability in stem vs leaves biomass allocation between 22
species. The phylogenetic signal of the leaf dry matter content (LDMC) is significant. The 23
LMDC is an indicator of the use of plant resources, a trade-off between a rapid assimilation 24
and growth and an efficient conservation of resources within well-protected tissues (Vaieretti 25
19 et al., 2007). The strong conservatism of LDMC is known (Purschke et al., 2013; Kazakou et 1
al., 2014; Fort et al., 2015; Poorter et al., 2018). The stomatal length and stomata density have 2
a significant phylogenetic signal. In the Coffea genus, generally, the smaller genome species 3
have smaller leaves with larger stomata and grows on the dry environment while the larger 4
genome species from humid habitats have longer leaves with a higher stomata density 5
(Razafinarivo et al., 2013). 6
LMA reflects the cost of leaf construction, the light interception and the plant fitness with a 7
low phylogenetic signal (Flores et al., 2014). LMA is linked to leaf lifespan and to 8
photosynthetic capacity per mass unit (Am). The species with low LMA have generally fast 9
growth rate (Flores et al., 2014). 10
The phylogenetical signal of leaf petiole length, leaf length, leaf area and leaf width was 11
weakly significant. The size of the leaves is mainly controlled by global climatic factors 12
(Wright et al., 2017). The phylogenetical signals of the ratio internode length-to-diameter are 13
weakly significant too. The stem size is species dependent within Coffea. 14
The length of the maturation phase shows a high significant phylogenetic signal. It is well 15
known that the phenology is an adaptive trait (Chuine, 2010). These results highlight the 16
assumption that the phenological sensitivity was a significant predictor of species adaptation 17
to climate change (Cleland et al., 2012). 18 . 19 20 CONCLUSIONS 21
For Madagascan wild coffees as for African species, the flowering is influenced by both the 22
climatic conditions (dry period followed by a trigger rain) and genetic parameters at the 23
species level. Phenology parameters (number of days for blossoming after the trigger rain and 24
20 maturation phase length) did not correlate with natural habitat type. However, a high 1
variability of length of the maturation phase (from 59 to 360 days) with a strong phylogenetic 2
signal is noted. In drier environment, two opposite strategies to avoid the dry season are 3
observed either very short as C. boiviniana (59 days) or very long as C. tsirananae (360 days) 4
that raise questions on the adaptive meaning of this trait. Reproductive strategies involve 5
mechanisms that favor species integrity (reduced gene flow and reduced hybrids growth or 6
fertility) and species survival in climate changes. The climatic factors affect leaf size and 7
mass, the diameter of green internodes, which is a proxy of the size of meristem. The ratio 8
between the stem dry mass and leaf dry mass shows a high phylogenetic signal. To our 9
knowledge, there are few studies on such phylogenetic signal. 10
11
ACKNOWLEDGEMENT 12
This work is a part of a collaborative project with the National Center of Applied Research and Rural 13
Development (FOhibem-pirenena momba ny FIkarohana ampiharina amin'ny Fampandrosoana ny eny 14
Ambanivohitra: FOFIFA), in Madagascar and two French research institutes (Cirad and IRD, 15
Montpellier France). We thank the FOFIFA staff at the Kianjavato Coffee Research Station (KCRS), 16
Madagascar. We thank Yves Caraglio (UMR AMAP) for his critical and valuable comments on the 17 manuscript. 18 19 FUNDING INFORMATION 20
This work was supported by the Agropolis Foundation (grant n° 0902-009) and by funds from the 21
Botany and Computational Plant Architecture, joint research unit (UMR AMAP) and by funds from 22
the Diversity, Adaption and Plant Development, joint research unit (UMR DIADE). 23
21 LITERATURE CITED
1 2
Akaffou DS, I. Konate I, R.S. Sié RS, Poncet V, Zoro Bi IA, Keli J, et al. 2014. Flowering
3
phenology and yield-related traits in the interspecific cross between Coffea 4
pseudozanguebariae Bridson and C. canephora Pierre. Australian Journal of Crop Science. 5
8:1272 – 1280.
6
Allan E and Panell JR. 2009. Rapid divergence in physiological and life-history traits
7
between northern and southern populations of the British introduced neo-species,Senecio 8
squalidus. Oikos 118: 1053-1061, 2009 doi: 10.1111/j.1600-0706.2009.17135.x, 9
Anderson JT. Inouye DW. McKinney AM. Colautti RI, and Mitchell-Olds T. 2012.
10
Phenotypic plasticity and adaptive evolution contribute to advancing flowering phenology in 11
response to climate change. Proceeding of the Royale Society. 279:3843–3852. 12
Andrianasolo D, Davis AP, Razafinarivo NJ, Hamon, S, Rakotomalala, JJ, Sabatier S,
13
Hamon, P. 2013. High genetic diversity of in situ and ex situ populations of Madagascan
14
coffee species: further implications for the management of coffee genetic resources. Genetics 15
and Genomes, 9: 1295-1312. DOI 10.1007/s11295-013-0638-4 16
Bacon CD, Velásquez-Puentes F, Flórez-Rodríguez A, Balslev H, Galeano G, Bernal R,
17
Antonelli A. 2016. Phylogenetics of Iriarteeae (Arecaceae), cross-Andean disjunctions and
18
convergence of clustered infructescence morphology in Wettinia. Botanical Journal of the 19
Linnean Society, 182 (2): 272–286. 20
Bates D., Mächler M, Bolker B, Walker S. 2015. Fitting Linear Mixed – Effects Models
21
Using Lme4. Journal of Statistical Software 67. 22
Blomberg SP and Garland Jr T. 2002. Tempo and mode in evolution: phylogenetic inertia,
23
adaptation and comparative methods. Journal of Evolutionary Biology, 15:899–910. 24
22
Blomberg S, Garland Jr T, Ives A. 2003. Testing for phylogenetic signal in comparative
1
data: behavioral traits are more labile. Evolution, 57: 717–745 2
Borianne P. 2012. Automated valuation of leaves area for large-scale analysis needing data
3
coupling or petioles deletion, In Guo, Y., Kang, M. Z., Dumont, Y. (eds), Plant growth 4
modeling, simulation, visualization and applications. Shanghai, China, 50-57. 5
Carvalho A. 1952. Taxonomia de Coffea Arabica L. Cracteres morfologicos dos haploides.
6
Bragantia 12: 201-212. 7
Cavender-Bares J, Kozak KH, Fine PVA, Kembel SW. 2009. The merging of community
8
ecology and phylogenetic biology. Ecology Letters, 12:693–715 9
Charrier A. 1978. La structure génétique des caféiers spontanés de la région malgache
10
(Mascarocoffea). Leurs relations avec les caféiers d’origine africaine (Eucoffea). PhD Thesis, 11
Université Paris-Sud Orsay, Paris, France. 12
Chevalier A. 1942. Les caféiers du globe. Caféiers sauvages et cultivés. Encyclopédie
13
biologique. XXII Fas. II: 1-33. 14
Chuine I, 2010. Why does phenology drive species distribution? Philosophical. Transactions 15
of Royal Society B (2010) 365, 3149–3160. 16
Cleland EE,. Allen JM,. Crimmins TM,. Dunne JA, Pau S, Travers SE, et al. 2012.
17
Phenological tracking enables positive species responses to climate change. Ecology 18
93:1765–1771.
19
Corner EJH. 1949. The Durian theory or the origin of the modern tree. Annals of Botany,
20
13(52): 367-414.
21
Couturon E, Raharimalala NE, Rakotomalala JJ, Hamon S, de Kochko A, Guyot R,
23
Hamon P. 2016. Caféiers sauvages - Un trésor en péril au cœur des forêts tropicales ! Wild
1
coffee-trees - A threatened treasure in the heart of tropical forests ! Edition Association 2
Biodiversité – Ecovalorisation et Caféiers, Montpellier. 3
Crisosto CH, Grantz DA, and Meinzer FC. 1992. Effects of water deficit on flower
4
opening in coffee (Coffea arabica L.). Tree Physiology. 10:127–139. 5
Davis AP, Govaerts R, Bridson DM, Stoffelen P, 2006. An annotated taxonomic conspectus
6
of the genus Coffea (Rubiaceae). Botanical Journal of the Linnean Society, 152(4): 465–512. 7
Davis AP, Rakotonasolo F. 2008. A taxonomic revision of the baracoffea alliance: nine
8
remarkable Coffea species from western Madagascar. Botanical Journal of the Linnean 9
Society 158, 355-390. 10
Davies TJ, Wolkovich EM, Kraft NJB, Salamin N, Allen JM, Ault TR, Betancourt JL,
11
Bolmgren K, Cleland EE, Cook BI, Crimmins TM, Mazer SJ, McCabe GJ, Pau S,
12
Regetz J, Schwartz MD, Travers SE. 2013. Phylogenetic conservatism in plant phenology.
13
Journal of Ecology, 101(6): 1520–1530. 14
Fort F, Jouany C, Cruz P. 2015. Hierarchical traits distances explain grassland Fabaceae
15
species' ecological niches distances. Frontiers in Plant Science, 6: 1-11 16
Flores O, Garnier E,Wright IJ et al. 2014. An evolutionary perspective on leaf economics:
17
phylogenetics of leaf mass per area in vascular plants. Ecology and Evolution, 4 (14): 2799-18
2811. 19
Garnier E. and Navas ML, 2012. A trait-based approach to comparative functional plant
20
ecology: concepts, methods and application for agroecology. A review. Agronomy 21
Sustainable development; 32:365-399. 22
24
Givnish TJ. 1987. Comparative studies of leaf form assessing the relative roles of selective
1
pressures and phylogenetic constraints. New Phytologist. 106 (Suppl.): 131-160. 2
Gomez C, Despinoy M, Hamon S, Hamon P, Salmon D, Akaffou SD, Legnate H, de
3
Kochko A, Mangeas M, Poncet V. 2016. Shift in precipitation regime promotes interspecific
4
hybridization of introduced Coffea species. Ecology and Evolution : 6(10): 3240– 3255 5
Hallé F, Oldeman RAA, Tomlinson PB. 1978. Tropical trees and forests: an architectural
6
analysis. New York: Spring 7
Hamon P, Grover CE, Davis AP et al. 2017. Genotyping-by-sequencing provides the first
8
well-resolved phylogeny for coffee (Coffea) and insights into the evolution of caffeine content 9
in its species. Molecular Phylogenetics and Evolution 109: 351-361. 10
Hey J. 2006. Recent advances in assassing gene flow between diverging populations and
11
species. Current Opinion in Genetics and Development, 16: 592-596. 12
Janssen T, Bystriakova N, Rakotondrainibe F, Coomes D, Labat JN, Schneider H. 2008.
13
Neoendemism Madagascan scaly tree ferns results from recent, coincident diversification. 14
Evolution 62: 1876-1889. 15
Kazakou E, Violle C, Roumet C, Navas ML, Vile D, Kattge J, Garnier E. 2014. Are
16
trait-based species rankings consistent across data set and spatial scales? Journal of vegetation 17
science 25: 235-247. 18
Krishnan S, Ranker TA, Davis AP, Rakotomalala JJ, 2013. The study of genetic diversity
19
patterns of Coffea commersoniana,an endangered coffee species from Madagascar: a model 20
for conservation of other littoral forest species. Tree Genetics & Genomes 9:179–187. 21
Lashermes P, Combes MC, Robert J, Trouslot P, D'Hont A, Anthony F, Charrier
22
A. 1999. Molecular characterisation and origin of the Coffea arabica L. genome. Molecular
23
and General genetics 261: 259-266. 24
25
Le Pierres, D. 1995. Etude des hybrides interspecifiques tetraploïdes de premiere generation
1
entre Coffea arabica L. et les cafeiers diploïdes. PhD Thesis University Paris XI, Orsay 2
(France). 3
Lin BB. 2008. Microclimate effects on flowering success in coffee agroforestry systems.
4
American Eurasian Journal of Agriculture Environnemental Science. 3:148–152. 5
Louarn, J. 1992. La fertilité des hybrides interspecifiques et les relations genomiques entre
6
caféiers diploïdes d’origine africaine (Genre Coffea L. sous-genre Coffea). PhD Thesis, 7
University Montpellier. 8
Luna-Nieves AL, Meave JA, Morellato LPC, Ibarra-Manriquez, 2017. Reproductive
9
phenology of usefull Seasonnally Dry Tropical Forest trees: Guiding patterns for seed 10
collection and plant propagation in nurseries. Forest Ecology and Management 393: 52-62 11
Maurin O, Davis AP, Chester M, Mvungi EF, Jaufeerally-Fakim Y, Fay MF. 2007.
12
Towards a phylogeny for Coffea (Rubiaceae) : identifying wellsupported lineages based on 13
nuclear and plastid DNA sequences. Annals of Botany 100: 1565-1583. 14
Myers N, Mittermeier RA, Mittermeier CG, da Fonseca G.A.B, Kent J. 2000.
15
Biodiversity hotspots for conservation priorities. Nature, 403: 853–858. 16
Niemiller ML, Fitzpatrick BM, Miller BT, 2008. Recent divergence-with-gene-flow in
17
Tennessee cave salamanders (Plethodontidae: Gyrinophilus) inferred from gene genealogies. 18
Molecular Ecology, 17: 2258-2275.
19
Niinemets U, 2001. Globe-scale climatic controls of leaf dry mass per area, density, and
20
thickness in trees and shrubs. Ecology, 82(2): 453-469. 21
Noirot M, Charrier A, Stoffelen P, Anthony F. 2016. Reproductive isolation, gene flow and
22
speciation in the former Coffea subgenus: a review. Trees, 30: 597-608.
23
Nosil P, 2008. Speciation with gene flow could be common. Molecular Ecology 17(9):
2103-24
2106. 25
26
Orme D, Freckleton RP, Thomas GH, Petzoldt T, Fritz SA, Isaac NJB, Pearse W. 2012.
1
caper: comparative analysis of phylogenetics and evolution in R. Methods in Ecology and 2
Evolution, 3:145-151. 3
Pagel M. 1999. Inferring the historical patterns of biological evolution. Nature, 401: 877–
4
884. 5
Perrier X, Jacquemoud-Collet J-P. 2006. DARwin software http://darwin.cirad.fr
6
Poorter L, Castilho CV, Schietti J, Oliveira RS, Costa FRC, 2018. Can traits predict
7
individual growth performance? A test in a hyperdiverse tropical forest. New Phytologist 8
219 : 109-121.
9
Portères R. 1946. Action de l’eau, après une période sèche, sur le déclenchement de la
10
floraison chez Coffea arabica L. L’Agronomie Tropicale, 1(3-4): 148-158. 11
Purschke O, Schmid BC, Sykes MT, Poschlod P, Michalski SG, Durka W, Kühn I,
12
Winter M and Prentice HC. 2013. Contrasting changes in taxonomic, phylogenetic and
13
functional diversity during a long-term succession: insights into assembly processes. Journal 14
of Ecology, 101: 857-856. 15
Rakotomalala J-J, Cros E, Clifford MN, Charrier A. 1992. Caffeine and theobromine in
16
green beans from Mascarocoffea. Phytochemistry 31(4):1271–2. 17
Razafinarivo NJ, Rakotomala JJ, Brown SC, de Kochko A, Poncet V,
Dubreuil-18
Tranchant, C, Couturon E, Guyot R, Hamon P, 2012. Geographical gradients in the
19
genome size variation of coffee trees (Coffea) native to Africa and Indian Ocean islands.Tree 20
genetics & genomes, 8 (6): 1345-1358. 21
Reginato M, Michelangeli FA, 2016. Diversity and constraints in the floral morphological
22
evolution of Leandra s.str. (Melastomataceae). Annals of Botany, 118(3): 445-458. 23
27
Revell LJ. 2012. phytools: An R package for phylogenetic comparative biology (and other
1
things). Methods in Ecology and Evolution, 3: 217-223. 2
Sakai, S. 2001. Phenological diversity in tropical forests. Population Ecology. 43:77–86.
3
Shaffer HB and Thomson RC, 2007. Delimiting Species in Recent Radiations. Systematic
4
Biology 56(6): 896-906. 5
Smith JM, Burian R, Kauffman P, Alberch P, Campbell J, Goodwin B, Lande R, Raup
6
D, Wolpert L. 1985. Developmental constraints and evolution. Quarterly Review of Biology,
7
60: 265–287.
8
Vaieretti MV, Diaz S, Vile D, Garnier E. 2007. Two measurement methods of leaf dry
9
matter content produce similar results in a broad range of species. Annals of Botany: 99: 955-10
958. 11
Varossieau WW. 1940. On the development of the stem and the formation of leaves in
12
Coffea species. Annales du Jardin Botanique de Buitenzorg, 50: 115-198. 13
Vences M, Wollenberg KC, Vieites DR, Lees DC. 2009. Madagascar as a model region of
14
species diversification. Trends in Ecology and Evolution, 24: 456–65 15
Westoby M, Falster DS, Moles TA, Vesk PA, Wright IL, 2002 ; Plant ecological
16
strategies : some leading dimension of variation between species. Annual review of ecology 17
systematic, 33: 125-159. 18
Wright IL, Dong N, Maire V, Prentice IC et al, 2017. Global Climatic drivers of leaf size
19
Science 357, 917–921 20
28
Yoder AD, and Nowak MD, 2006. Has Vicariance or Dispersal Been the Predominant
1
Biogeographic Force in Madagascar? Only Time Will Tell. Annual Review of Ecology, 2
Evolution,and Systematics Vol.37:405-431. 3
Zalamea PC, Munoz F, Stevenson PR, Paine CET, Sarmiento C, Sabatier D, Heuret P.
4
2011. Continental-scale patterns of Cecropia reproductive phenology : evidence from
5
herbarium specimens. Proceedings of the Royal Society. doi: 10.1098/rspb.2010.2259. 6
Zeileis A and Hothorn T. 2002. Diagnostic Checking in Regression Relationships. R News,
7
2(3): 7-10.
8
Zimmerman JK, Wright SJ, Calderon O, Pagan MA Paton S, 2007. Flowering and
9
fruiting phenologies of seasonal and aseasonal neotropical forest: the role of annual changes 10
in irradiance. Journal of tropical Ecology 23: 231-251. 11
29 1 2 TABLES 3 4
Table 1. Coffee species examined, with population code, species name, botanical series (from
5
Charrier 1978), origin, province, GPS coordinates, habitat class. Habitat class: 1: < 2 dry 6
months; 2 : from 2 to 6 dry months; 3 : > 6 dry months. 7
8
ID populat ion
species name botanical
series
Origin/Locality Province latitude
coordina tes longitude coordinat es habitat class A964 C.dubardii Jum. Garcinioid es
Anivorano Nord Antsiran
ana (North) S12°44' E49°09' 3 A969 C.dubardii Jum. Garcinioid es North of Vohemar (Diégo-Suarez) Antsiran ana (North) S13°20' E49°57' 3 A516 C.heimii J.-F.Leroy Garcinioid es
Diégo-Suarez (Sahafary) Antsiran
ana (North) S12°35' E49°26'3 0'' 3 A40 C. mogenetii Dubard Garcinioid es
Montagne d'Ambre Antsiran
ana (North) S49°12' E12°26' 3 A252 C. tetragona Jum. & H.Perrier Garcinioid es Behangony (Est de Maromandia) Mahajan ga (Northwe st) S14°13'3 0'' E48°09' 3 A601 C. abbayesii J.-F.Leroy Millotii complex Fort-Dauphin (Isaka-Ivondro) Toliara (Southea st) S24°45'1 5'' E46°51'4 5'' 2 A572 C. ambodiriane nsis Portères Millotii complex
reserve Ambodiriana Toamasi
na (East) S18°27'0 8" E48°56'3 6" 1 A206 C. dolichophyll a J.-F.Leroy Millotii complex Nosy Varika Vohimanoro), Ambodilafa Fianarant soa (Southea st) S20°29' E48°10'3 0'' 1 A208 C. farafanganen sis J.-F.Leroy Millotii complex Farafangana (Amboangibe) Fianarant soa (Southea st) S22°53' E47°48' 1 A212 C. millotii J.-F.Leroy Millotii complex Vatovavy Fianarant soa (Southea st) S21°24'3 '' E47°56'3 2'' 1 A219 C. millotii J.-F.Leroy Millotii complex Ambatovaky Fianarant soa (Southea st) S21°22'4 8" E47°53'0 6" 1
30
A222 C. millotii
J.-F.Leroy
Millotii complex
Mananjary (Tolongoina) Fianarant
soa (Southea st) S21°31' E47°25' 2 A721 C. millotii J.-F.Leroy Millotii complex Ampasinambo (Nosy Varika) Fianarant soa (Southea st) S 20° 31' 15" E 48°01'75 " 1 A575 C. richardii J.-F.Leroy Millotii complex
Fenerive-Est (Tampolo) Toamasi
na (East) S17°17' E49°25' 1 A817 C. richardii J.-F.Leroy Millotii complex
Soanierana Ivongo Toamasi
na (East) S16°45' E49°35' 1 A227 C. andrambovat ensis J.-F.Leroy Multiflora e Tolongoina Toamasi na (East) S21°46'1 5" E47°57'0 7" 1 A310 C. andrambovat ensis J.-F.Leroy Multiflora e Vatovavy Fianarant soa (Southea st) S21°24'3 '' E47°56'3 2'' 1 A529 C. ankaranensis J.-F.Leroy ex A.P.Davis & Rakotonas. Multiflora e
Standoko (Diégo-Suarez) Antsiran
ana (North) S12°45'1 3'' E49°08'4 8'' 3 A808 C. ankaranensis J.-F.Leroy ex A.P.Davis & Rakotonas. Multiflora e
Ankarana (Diégo-Suarez) Antsiran
ana (North) S12°50'5 7" E49°32'3 6" 3 A403 C. arenesiana J.-F.Leroy Multiflora e Moramanga (Ambodivato) Toamasi na (Centre) S18°56' E48°12' 2 A303 C. bertrandii A.Chev. Multiflora e
Italy (Fort-Dauphin) Toliara
(Southea st) S25°02′ E46°59′ 3 A5 C. bertrandii A.Chev. Multiflora e Mahampoana (Fort-Dauphin) Toliara (Southea st) S 25°01' E 46°38' 3 A956 C. costei sp. nov. Ined. Multiflora e
Route côtière Sambava Antsiran
ana (North) S13°45'1 3'' E50°0'48' ' 2 A570 C. coursiana J.-F.Leroy Multiflora e Tamatave (Betampona RNI n°1) Toamasi na (East) S17°53' E49°13' 1 A315 C. leroyi A.P.Davis Multiflora e Ifanadiana (Ambodiarafia) Fianarant soa (Southea st) S21°20' E47°45' 1
31 A18 C. mangoroensi s Portères Multiflora e Ambatondrazaka Toamasi na (East) S19°16'3 " E48°24'0 9" 1 A401 C. mangoroensi s Portères Multiflora e
Mangoro (Moramanga) Toamasi
na (East) S18°55' E48°14' 2 A402 C. mangoroensi s Portères Multiflora e
Mangoro (Moramanga) Toamasi
na (East) S18°56' E48°13' 2 A321 C. montis-sacri A.P.Davis Multiflora e Vatovavy Fianarant soa (Southea st) S21°24'3 5'' E47°56'3 2'' 1 A12 C. perrieri Drake ex Jum. & H.Perrier Multiflora e Fort-Dauphin (Amboasary-Atsimo Toliara (Southea st) S24°50' E46°33'5 5'' 3 A421 C. perrieri Drake ex Jum. & H.Perrier Multiflora e Ihosy Fianarant soa (Southea st) S22°33'0 3" E46°07'4 0" 3 A730 C. perrieri Drake ex Jum. & H.Perrier Multiflora e Tsaratanàna Mahajan ga (Northwe st) S16°47' E47°39' 3 A71 C. resinosa (Hook.f.) Radlk. Multiflora e Maroantsetra (Forêt Farakaraina) Toamasi na S 15°26' E 49°44' 1 A8 C. resinosa (Hook.f.) Radlk. Multiflora e
Nosy Varika Fianarant
soa (Southea st) S 20°36'26 .6" E 48°31'56. 5" 1 A827 C. resinosa (Hook.f.) Radlk. Multiflora e Fananehana Toamasi na S15°53'2 6" E49°42'1 9" 1 A906 C. resinosa (Hook.f.) Radlk. Multiflora e Tanambao Antsiran ana (North) S17°43'3 8" E48°49'5 9" 2 A910 C. resinosa (Hook.f.) Radlk. Multiflora e
North Soanierana Ivongo Toamasi
na (East) S16°55'1 7" E49°35'0 7" 1 A913 C. resinosa (Hook.f.) Radlk. Multiflora e Manompana Toamasi na (East) S16°40'5 8" E49°45'1 7" 1 A915 C. resinosa (Hook.f.) Radlk. Multiflora e Ivontaka Toamasi na (East) S16°18' E49°49'0 0'' 1 A538 C. sahafaryensis J.-F.Leroy Multiflora e
Sahafary (Diégo-Suarez) Antsiran
ana (North)
S12°53'1 8"
32 A978 C. sahafaryensis J.-F.Leroy Multiflora e
North of Vohémar Antsiran
ana (North) S13°17'2 0'' E49°57' 3 A20 C. vianneyi J.-F.Leroy Multiflora e Ampasinambo (Nosy Varika) Fianarant soa (Southea st) S20°32'5 3" E48°07'5 0" 1 A946 C. vianneyi J.-F.Leroy Multiflora e Moramanga Toamasi na (Centre) S18°56' E48°15' 2 A966 C. augagneurii Dubard Subtermin ales
Anivorano Nord Antsiran
ana (North) S12°43' E49°10' 3 A973 C. boiviniana (Baill.) Drake Subtermin ales Nafokovo (Nord Vohémar) Antsiran ana (North) S13°22'1 3'' E49°58'1 2'' 3 A980 C. boiviniana (Baill.) Drake Subtermin ales Vohémar Antsiran ana (North) S13°21' E49°52'4 8'' 3 A535 C. bonnieri Dubard Subtermin ales Diego-Suarez (Forêt d'Ambre) Antsiran ana (North) S12°29'3 0'' E49°10'4 0'' 3 A974 C. jumellei J.-F.Leroy Subtermin ales Nafakovo (North Vohémar) Antsiran ana (North) S13°22'1 3'' E49°58'1 2'' 3 A957 C. pervilleana (Baill.) Drake Subtermin ales
Route côtière Sambava - Diégo Suarez Antsiran ana (North) S13°49'1 7" E50°02'0 4" 2 A958 C. pervilleana (Baill.) Drake Subtermin ales
Route côtière Sambava - Diégo Suarez Antsiran ana (North) S13°49'1 7" E50°02'0 4" 2 A528 C. ratsimamang ae J.-F.Leroy ex A.P.Davis & Rakotonas. Subtermin ales Sandokoto (Diégo-Suarez) Antsiran ana (North) S13°48'3 0" E49°17'3 9'' 2 A967 C. ratsimamang ae J.-F.Leroy ex A.P.Davis & Rakotonas. Subtermin ales
Anivorano Nord Antsiran
ana (North) S12°44' E49°14' 3 A307 C. sakarahae J.-F.Leroy Subtermin ales
Iakora (Ihosy) Fianarant
soa (South) S23°06' 46°39′E 3 A515 C. tsirananae J.-F.Leroy Subtermin ales Diégo-Suarez (Cap d'Ambre) Antsiran ana (North) S11°58' E49°16' 3
33 A308 C. vatovavyensi s J.-F.Leroy Subtermin ales Vatovavy Fianarant soa (Southea st) S21°24' E47°56' 2 A830 C. vatovavyensi s J.-F.Leroy Subtermin ales
unknown unknown unknow
n unknown NA A977 C. vohemarensi s A.P.Davis & Rakotonas. Subtermin ales
North of Sambava Antsiran
ana (North) S14°14' E50°8'30' ' 2 A574 C. homollei J.-F.Leroy
Verae Réserve Ambodiriana
(Tamatave) Toamasi na (East) S17°59'1 3'' E49°17'4 8'' 1 A213 C.kianjavate nsis J.-F.Leroy
Verae Vatovavy Fianarant
soa (Southea st) S21°24'3 0'' E47°56'3 0'' 1 A602 C.kianjavate nsis J.-F.Leroy
Verae Fort-Dauphin Toliara
(Southea st) S 24°45'15 ", E 46°51'45 " 2 A320 C. lancifolia A.Chev. Verae Mananjary (Madiorano/Tolongoina ) Fianarant soa (Southea st) S21°31' E47°29' 1 A405 C. lancifolia A.Chev.
Verae Tolongoina (Kararaika
forest) Fianarant soa (Southea st) S22°57'0 2" E47°22'5 6" 2 A571 C. lancifolia A.Chev.
Verae Reserve Ambodiriana Toamasi
na (East) S18°27'0 8" E48°58'3 6" 1 1 2
34
Table 2: Physical parameters of habitats corresponding to habitat class of species 1 to 3 as
1
defined by the number of dry months. 2 Habitat class Number of dry months Annual precipitation in mm Temperature of the coldest month in °C Temperature of the warmest month in °C Annual potential evapotranspiration in mm Aridity index in mm 1 0 - 1 2051 to 3360 11.6 to 19.9 26.3 to 30.9 945 to 1289 1081 to 2142 2 2 - 6 1260 to 2265 10.6 to 20.7 23.1 to 30.9 814 to 1370 175 to 1111 3 >6 552 to 1829 10.2 to 22.8 28 to 33.1 950 to 1627 -691 to 379 3 4