HAL Id: inserm-01391925
https://www.hal.inserm.fr/inserm-01391925
Submitted on 4 Nov 2016
HAL is a multi-disciplinary open access
archive for the deposit and dissemination of
sci-entific research documents, whether they are
pub-lished or not. The documents may come from
teaching and research institutions in France or
abroad, or from public or private research centers.
L’archive ouverte pluridisciplinaire HAL, est
destinée au dépôt et à la diffusion de documents
scientifiques de niveau recherche, publiés ou non,
émanant des établissements d’enseignement et de
recherche français ou étrangers, des laboratoires
publics ou privés.
Meryem Tardivel, Séverine Bégard, Luc Bousset, Simon Dujardin, Audrey
Coens, Ronald Melki, Luc Buée, Morvane Colin
To cite this version:
Meryem Tardivel, Séverine Bégard, Luc Bousset, Simon Dujardin, Audrey Coens, et al..
Tunnel-ing nanotube (TNT)-mediated neuron-to neuron transfer of pathological Tau protein assemblies.
Acta Neuropathologica Communications, 2016, 4 (1), pp.117. �10.1186/s40478-016-0386-4�.
�inserm-01391925�
R E S E A R C H
Open Access
Tunneling nanotube (TNT)-mediated
neuron-to neuron transfer of pathological
Tau protein assemblies
Meryem Tardivel
1, Séverine Bégard
1†, Luc Bousset
2†, Simon Dujardin
1,3†, Audrey Coens
2, Ronald Melki
2,
Luc Buée
1,4*†and Morvane Colin
1,4*†Abstract
A given cell makes exchanges with its neighbors through a variety of means ranging from diffusible factors to
vesicles. Cells use also tunneling nanotubes (TNTs), filamentous-actin-containing membranous structures that bridge
and connect cells. First described in immune cells, TNTs facilitate HIV-1 transfer and are found in various cell types,
including neurons. We show that the microtubule-associated protein Tau, a key player in Alzheimer
’s disease, is a
bona fide constituent of TNTs. This is important because Tau appears beside filamentous actin and myosin 10 as a
specific marker of these fine protrusions of membranes and cytosol that are difficult to visualize. Furthermore, we
observed that exogenous Tau species increase the number of TNTs established between primary neurons, thereby
facilitating the intercellular transfer of Tau fibrils. In conclusion, Tau may contribute to the formation and function of
the highly dynamic TNTs that may be involved in the prion-like propagation of Tau assemblies.
Introduction
Understanding the transmission of an infectious agent
from one cell to another was a challenge of the last
century. The involvement of cell-surface receptors has
been shown, but other routes have also been described.
Tunneling nanotubes (TNTs) form one such path. TNTs
have been described in various cell types, including
neuronal and immune cells. They are
filamentous-actin-containing membranous structures with a diameter of
50 to 800 nm, not always linked to the substrate, and
forming bridges that connect remote cells [1
–6]. For
in-stance, TNTs physically connect T cells, presenting a
new pathway for HIV-1 transmission [7]. In such cells,
the tip of the TNT is an active zone of actin cytoskeleton
reorganization and contains ezrin, Exo70, myosin 10
and N-WASP, suggesting a regulation at the cellular
level [8, 9]. Extrinsic factors such as arachidonic acid in
endothelial cells [10], HIV-1 infection in macrophages
[11], oxidative stress [12] and prion-like proteins (e.g.,
Huntingtin fibrils, TDP-43) in neuronal cells [6, 13, 14]
have been shown to trigger TNT formation.
Many protein aggregates have prion-like properties:
they can act as self-propagating templates. They disrupt
cellular proteostasis, eventually leading to
neurodegener-ative disorders such as Alzheimer
’s disease (AD),
Parkinson
’s disease (PD), amyotrophic lateral sclerosis
(ALS), or transmissible spongiform encephalopathies
(TSEs) [15
–17]. The exact mechanisms of the
cell-to-cell spreading of pathological species are still subject to
intense investigation. Among others, the role of TNTs in
such propagation has been suggested in Huntington
’s
disease, Parkinson
’s disease and ALS/fronto-temporal
dementia [18]. Regarding Alzheimer
’s disease, the
amyl-oid A
β peptide has been shown to traffic through TNTs
and to induce cytotoxicity [12]. The role of TNTs in
ag-gregated Tau spreading has not yet been documented.
In the present work, using two different cellular models
(CAD neuronal cells and rat primary embryonic cortical
neurons), we demonstrate that extracellular Tau species
acts as an extrinsic factor leading to increased formation
of TNTs, which in turn facilitate the intercellular spread
of pathological Tau.
* Correspondence:luc.buee@inserm.fr;morvane.colin@inserm.fr
†Equal contributors
1Université Lille, Inserm, CHU-Lille, UMR-S1172, Alzheimer & Tauopathies,
59000 Lille, France
Full list of author information is available at the end of the article
© The Author(s). 2016 Open Access This article is distributed under the terms of the Creative Commons Attribution 4.0 International License (http://creativecommons.org/licenses/by/4.0/), which permits unrestricted use, distribution, and reproduction in any medium, provided you give appropriate credit to the original author(s) and the source, provide a link to the Creative Commons license, and indicate if changes were made. The Creative Commons Public Domain Dedication waiver (http://creativecommons.org/publicdomain/zero/1.0/) applies to the data made available in this article, unless otherwise stated.
Materials and methods
Ethics statement-
Animals were provided by Janvier
Laboratories and had access to food and water ad libitum.
Animal experiments were performed in compliance with
and with the approval of the local ethics committee
(agreement CEEA 062010R), standards for the care and
use of laboratory animals, and the French and European
Community guidelines.
Cell culture
Primary Embryonic Neuronal Culture- Rat primary
embryonic cortical neurons (primary neurons) were
prepared from 17–18-day-old Wistar rat embryos as
fol-lows. The brain and meninges were removed. The cortex
was dissected out and mechanically dissociated in
culture medium by trituration with a polished Pasteur
pipette. Once dissociated and after blue trypan counting,
cells were plated in Ibidi
μ-Dishes (Biovalley) or Lab-Tek
four-well chamber slides (Becton Dickinson) coated with
poly-D-lysine (0.5 mg/mL) and laminin (10
μg/ml). For
dis-sociation, plating, and maintenance, we used Neurobasal
medium supplemented with 2 % B27 and containing
200 mM glutamine and 1 % antibiotic-antimycotic agent
(Invitrogen). Primary neurons at 7 days in vitro (DIV7)
were infected with lentiviral vectors (LVs) encoding GFP/
mCherry actin, tubulin or human wild type Tau (hTau1N4R
containing a V5 tag; V5-hTau1N4R).
Cell lines- Mouse neuronal CAD cells (mouse
cate-cholaminergic neuronal cell line, Cath.a-differentiated)
were cultured in Opti-MEM (Invitrogen) with 10 % fetal
bovine serum, penicillin/streptomycin (1 %) and
L-glutamine (1 %). Neuronal CAD cells were plated
over-night in poly-D-lysine (0.5 mg/mL) coated Ibidi
μ-Dishes for live imaging or Lab-Tek four-well chamber
slides for immunostaining. Neuronal CAD cells were
in-fected with LVs encoding GFP-actin, mCherry-tubulin or
human wild-type Tau (hTau1N4R containing a V5 tag;
V5-hTau1N4R).
Viral vectors-
The procedures to produce the
lenti-viral vectors (LVs) and to control their lenti-viral titers and
the absence of competent retroviruses have been
de-scribed previously [19]. All viral batches were produced
in appropriate areas in compliance with institutional
protocols for genetically modified organisms according
to the
“Comité Scientifique du Haut Conseil des
Biotechnologies” (Identification Number 1285).
Antibodies-
As part of this work, various primary
anti-bodies were used: mouse anti-
α acetylated Tubulin
(Sigma; 1:200 for immunocytochemistry); rabbit
poly-clonal antibody to V5 (Merck Millipore; 1:10,000 for
im-munocytochemistry); rabbit polyclonal antibody against
the C-terminal part of Tau (C-ter, raised in-house; 1:800
for immunocytochemistry and 1:10,000 for biochemistry)
[20]; rabbit polyclonal antibody M19G, which recognizes
the N-terminal part of Tau (N-ter, raised in-house;
1:10,000 for biochemistry) [21]; and rabbit polyclonal
raised against human anti-myosin 10, which detects
myosin 10 from multiple species, including mouse and rat
(Sigma; 1:200 for immunocytochemistry). These
bodies were visualized using appropriated secondary
anti-bodies coupled to Alexa 488 or 647 (Life Technologies;
1:1000 for Alexa 488 and 1:500 for Alexa 647).
Immunofluorescence-
Neuronal CAD cells and
pri-mary neurons were washed with pre-warmed PBS, fixed
with 4 % paraformaldehyde (PFA) for 20 min at room
temperature, permeabilized with 0.2 % Triton X-100 for
20 min at room temperature and blocked for 45 min at
room temperature using blocking solution (Bovine
Serum Albumin (BSA) 2 % in PBS). Cells were then
in-cubated overnight at 4 °C with primary antibody diluted
in blocking solution before being carefully washed and
incubated for 30 min at room temperature with the
ap-propriate Alexa Fluor-conjugated secondary antibody.
Cells were washed and mounted with VectaShield/4
′,6-diamidino-2-phenylindole (DAPI, Vector Laboratories)
to label nuclei.
Tubulin tracker staining for live imaging-
Neuronal
CAD cells were plated overnight at 100,000 per 35 mm
glass-bottomed culture
μ-dish (Biovalley, France), washed
with pre-warmed PBS and incubated 30 min at 37 °C with
tubulin Tracker green (Life Technology; 1:1000 dilution)
diluted in HBSS buffer and rinsed 3 times with
pre-warmed PBS before imaging.
Fluorescence imaging-
Immunofluorescence and short
time-lapse acquisitions were performed using an inverted
confocal microscope (LSM 710, Zeiss, Jena, Germany)
with a 40× oil-immersion lens (NA 1.3 with an optical
resolution of 176 nm) with an optical resolution of X nm.
DAPI, Alexa 488/GFP, mCherry and Alexa 647 were
im-aged using UV, Argon 488 nm, DPSS 561 nm and
He-lium/Neon lasers 633 nm. Images were processed with
ZEN
software.
Long
time-lapse
acquisitions
were
performed using an inverted Yokogawa Spinning Disk
confocal microscope with a 63× oil-immersion lens (NA
1.4 with with an optical resolution of 164 nm) and
epi-fluorescence microscope (Eclipse Ti-E, Nikon, Tokyo,
Japan) with a 40× air-immersion lens (NA 0.9 with an
op-tical resolution of 338 nm). Images were processed with
ZEN software and NIS software. To reduce noise, the signal
was subjected to line averaging to integrate the signal
col-lected over four lines. The confocal pinhole was adjusted to
facilitate a minimum field depth. A focal plane was
col-lected for each specimen. Cells were maintained at 37 °C
and 5 % CO
2during real time acquisitions. All setups, using
similar illumination and recording conditions (detector
fre-quency, gain, and laser intensity), were applied to
non-treated primary neurons to avoid misinterpretation due to
non-specific labeling (Additional file 1: Figure S1 d-e).
Human Tau1N4R purification
Full-length human Tau1N4R cDNA was cloned in the
pET14b vector. hTau1N4R was expressed in
E. coli BL21
DE3 CodonPlus cells (Stratagene). Cells were grown in
LB medium to an optical density at 600 nm of 0.8
ab-sorbance units. hTau1N4R expression was induced with
0.5 mM IPTG for 3 h. The cells were then harvested by
centrifugation (4000 g, 10 min). The bacterial pellets
were resuspended in lysis buffer (20 mM MES pH 6.8,
500 mM NaCl, 1 mM EGTA, 0.2 mM MgCl
2, 5 mM
di-thiothreitol, 1 mM PMSF + 1 tablet of Complete
(Roche)) per liter and lysed by sonication. Cell extracts
were clarified by centrifugation at 14,000 g, 30 min. The
lysate was heated to 80 °C for 20 min and centrifuged at
14,000 g for 30 min. The supernatant was dialyzed
against 100 volumes of buffer A (20 mM MES pH 6.8,
50 mM NaCl, 1 mM EDTA, 1 mM MgCl
2, 2 mM DTT,
0.1 mM PMSF) at 4 °C. The dialyzed protein mixture
was loaded on an SP Sepharose column (60 ml bed
vol-ume). Proteins were separated with a linear gradient of 0
to 100 % buffer B (20 mM MES pH 6.8, 1 M NaCl,
1 mM EGTA, 1 mM MgCl
2, 2 mM DTT, 0.1 mM
PMSF). Fractions were analyzed via SDS-PAGE stained
with Coomassie blue. Fractions containing hTau were
pooled and dialyzed against 100 volumes of PBS buffer
containing 1 mM DTT. The hTau concentration was
de-termined spectrophotometrically using an extinction
co-efficient at 280 nm of 7450 M
−1.cm
−1. Pure hTau1N4R
at a concentration of 50 to 100
μM. Fibrillar samples
were sonicated for 5 min on ice in 2-ml Eppendorf tubes in
a VialTweeter powered by an ultrasonic processor UIS250v
(250 W, 2 4 kHz; Hielscher Ultrasonic, Teltow, Germany)
set at 75 % amplitude, 0.5 s pulses. Aliquots were stored at
−80 °C. Length distribution of sonicated Tau fibrils has
been obtained by measuring the length of 227 fibrils in
negatively stained TEM samples (15 to 85 nm with a mode
size of 55 nm) (Additional file 2: Figure S2).
Human Tau1N4R assembly and labeling
Fibrillation of hTau1N4R was achieved at 40
μM in the
presence of 10
μM heparin by shaking 0.5 ml solution
ali-quots at 37 °C in an Eppendorf Thermomixer set at
600 rpm for 4 days. Fibrils were spun for 20 min at 20 °C
and 16,000 rpm. The amount of fibrillar material was
esti-mated by subtraction of the soluble fraction remaining
after centrifugation from the initial concentration. The
pelleted material was resuspended in PBS at an equivalent
monomeric hTau1N4R concentration of 100
μM.
Labeling of hTau1N4R fibrils was achieved by the
addition of 2 molar equivalents of lysine-reactive ATTO
488, ATTO 568 or ATTO 647 (Life Technologies
#A20003) for 1 h at room temperature. The unreacted
fluorophore was removed by two cycles of centrifugation
at 15,000 g for 10 min and resuspension of the pellet in
PBS.
Sup35NM purification and assembly
Purification and assembly of Sup35NM were performed
as described in Krzewska et al. [22]. Labeling of
Sup35NM fibrils was performed identically to that of
Tau fibrils.
Electron microscopy
The nature of hTau1N4R and Sup35NM assemblies was
assessed using a JEOL 1400 transmission electron
micro-scope following adsorption onto carbon-coated
200-mesh grids and negative staining with 1 % uranyl acetate.
The images were recorded with a Gatan Orius CCD
camera (Gatan).
TNTs activation-
For TNT activation experiments,
neuronal CAD cells and primary neurons were
incu-bated for 5 min at 37 °C with 1
μM recombinant
hTau1N4R fibrils labeled with ATTO 647 or unlabeled.
Rinses with pre-warmed PBS were performed (3×)
be-fore immunostaining or real-time imaging.
Antibody saturation-
Before incubation with cells,
C-ter antibodies were incubated (24 h/4 °C/orbital
agita-tion) with blocking solution containing either saturating
concentrations of recombinant hTau1N4R fibrils (100×)
or BSA (100×) as a control. Cells were immunolabeled
as described above.
Uptake and transfer of hTau1N4R fibrils-
Neuronal
CAD cells were plated overnight at 60,000 cells per well in
poly-D-lysine-coated Lab-Tek four-well chamber slides
(Becton Dickinson). Cells were infected with LVs encoding
mCherry-Actin. ATTO 488-hTau1N4R fibrils were diluted
at 1
μM in 100 μL of OptiMEM (Gibco). Then, 96 μL of
OptiMEM and 4
μL of Lipofectamine-2000 (Invitrogen)
were added to the ATTO 488-hTau1N4R fibrils to a final
volume of 200
μL for 20 min before the mixture was
added to the cells. For primary neurons, 50,000 cells were
plated in poly-D-lysine- and laminin-coated Lab-Tek
four-well chamber slides (Becton Dickinson). Cells were
infected at DIV7 with LVs encoding mCherry-Actin.
ATTO 488-hTau1N4R fibrils were diluted at 1
μM in
100
μL of Neurobasal medium (Gibco). Then, 96 μL of
Neurobasal medium and 4
μL of Lipofectamine-2000
(Invi-trogen) were added to the ATTO 488-hTau1N4R fibrils to
a final volume of 200
μL for 20 min before the mixture was
added to the cells. Six hours later, cells were rinsed with
pre-warmed medium (3×) before immunostaining.
For neuron-to-neuron transfer, CAD cells or primary
neurons (100,000 cells/dish) were plated on Ibidi
μ-Dishes and infected with LVs encoding GFP-Actin.
ATTO 568-hTau1N4R fibrils were diluted at 1
μM and
added to the cells. Six hours later, cells were wash with
pre-warmed PBS (3×) before acquisition using real time
microscopy.
Electrophoresis
and
immunoblotting-
Neuronal
CAD cells were rinsed once in PBS and lysed in RIPA
buffer (150 mM NaCl, 1 % NP40, 0.5 % sodium
deoxycholate, 0.1 % SDS, and 50 mM Tris HCl; pH = 8.0).
The positive controls were wild-type mouse hippocampal
cell homogenate (CTL1) or neuronal CAD cells infected
with LVs encoding hTau1N4R (CTL2). Protein
concentra-tions were determined (PIERCE BCA Protein Assay Kit),
and samples were diluted at 1
μg/μL in LDS containing
50 mM DTT. Then, 15
μg of protein was denatured at
100 °C for 10 min, loaded on 4-12 % NuPAGE Novex gels
(Invitrogen), and transferred to nitrocellulose membranes.
Membranes were blocked in Tris-buffered saline, pH 8.0,
0.05 % Tween 20 with 5 % skim milk or 5 % BSA and
in-cubated with the appropriate primary overnight at 4 °C.
Membranes were then rinsed and further incubated with
horseradish peroxidase-labeled secondary antibody (goat
anti-rabbit IgGs, Sigma), and bands were visualized by
chemiluminescence (ECL, Amersham Biosciences) with a
LAS3000 imaging system (Fujifilm).
Statistical analysis-
Data are presented as the means
(± SEM) of experiments performed at least in triplicate
and are representative of the results obtained from three
independent experiments that produced similar results.
Statistical analyses were performed using the Mann–
Whitney
U-Test (GraphPad prism software) to
deter-mine the
p-value. The differences were considered
sig-nificant at *
p < 0.05, ** p < 0.01, or *** p < 0.001.
Results
Tau is present within TNT in CAD cells under basal
conditions
To facilitate reporting on our results, pseudo-colors have
been used in some figures to visualize actin in red and
tubulin in green (live cells). We first characterized TNTs
in neuronal CAD cells following published criteria
(Additional file 3: Figure S3 and Additional file 4: Figure S4):
1) the presence of actin in TNTs without tubulin [1, 2], 2)
the size of TNTs and the kinetics of their formation [1, 2,
23–26] and 3) the myosin 10 labeling [8]. Extensions
be-tween neuronal CAD cells were characterized using multiple
methodologies and have all properties of TNTs. They were
tubulin negative and actin positive in all systems used:
en-dogenous acetyl-tubulin immunoreactivity (Additional file 3:
Figure
S3
a,
polymerized
tubulin),
tubulin
tracker
(Additional file 3: Figure S3 b, polymerized tubulin),
overex-pressed mCherry-tubulin (Additional file 3: Figure S3 c,
monomeric and polymerized tubulin) and tagged actin (GFP
or mCherry) (Additional file 3: Figure S3). Currently, there
is no specific marker of TNTs. However, the
actin-interacting protein myosin 10 has been shown to be
neces-sary for the formation and the functionality of TNTs [8].
Confocal microscopy allowed the identification of
actin-positive and tubulin-negative TNTs containing myosin 10
protein (Additional file 3: Figure S3 d) in neuronal CAD
cells. These structures are easily detectable via live imaging
in overexpressing systems of actin and tubulin, with a
diameter of approximately 400 nm and lengths ranging
from 10 to 30
μm (Additional file 4: Figure S4 a), and they
are rapidly formed thanks to a
“filopodia-like” (Additional
file 4: Figure S4 b and d) or a
“kiss-and-run” mechanism
(Additional file 4: Figure S4 c and e), as previously
de-scribed [24, 26, 27]. Altogether, these data showed that we
have engineered all necessary tools for identifying TNTs.
In contrast, the optical resolution of confocal microscopy
did not allow us to image TNTs in primary neurons (
n = 5
independent experiments; data not shown).
We next investigated the presence of Tau in TNTs in
basal conditions in neuronal CAD cells. Tau containing a V5
epitope [19] was overexpressed using a lentiviral vector, and
its presence in TNTs was tracked. V5 immunoreactivity was
detected in TNTs established between neuronal CAD cells
(Fig. 1), demonstrating the presence of soluble Tau within
TNTs and co-localized with actin (Additional file 5:
Figure S5 a and c;
n = 3, Pearson correlation = 0.7 ± 0.09).
Extracellular Tau species favors TNTs formation
TNTs formation is still ill-defined [28–34] however stresses
including protein fibrils [8, 12, 35], virus infection [6, 7, 31]
and oxidation [12] have been reported to trigger their
for-mation. We therefore evaluated whether extracellular Tau
species (monomers and fibrils) might be a signal to trigger
TNT formation. Monomeric full-length Tau was assembled
into fibrils (Fig. 2a) as described in the methods section.
The resulting assemblies were diluted in the growth
medium of neuronal CAD cells, and TNTs were quantified.
Whereas the number of TNTs per cell is not modified, the
the proportion of cells establishing TNTs reaches 63 % in
the presence of extracellular Tau species versus 24 % in
basal conditions (Fig. 2b-d, 2.6-fold increase,
p < 0.05). This
increase is specific to extracellular Tau species, as no such
increase in TNTs number was observed in the presence of
unrelated amyloid fibrils, such as the protein Sup35NM
from Saccharomyces cerevisiae [22] that binds to
mamma-lian cells [36, 37] where it displays prion properties [38]
(Fig. 2e,
p = 0.45). We then investigated the ability of
extra-cellular Tau species to induce TNT formation in primary
neurons. Similarly to our observations in neuronal CAD
cells (Fig. 2), extracellular Tau species in the culture
medium activated TNT formation as assessed by their
spe-cific tubulin-negative (monomeric or polymerized) and
actin- and myosin-10-positive staining (Fig. 3).
The protein Tau is a constitutive component of TNTs
We next designed experiments to determine whether
soluble Tau is present within TNTs. Tau containing a V5
epitope was overexpressed as described above, and its
presence in TNTs was assessed. V5 immunoreactivity
was detected in TNTs formed between primary neurons
(Fig. 4a), demonstrating the presence of soluble Tau in
these cellular extensions. Because the presence of Tau in
TNTs might be due to the over-expression system used,
we also labeled the murine endogenous Tau in primary
neurons rather than in CAD cells, which express
en-dogenous Tau at an undetectable level (Additional file 1:
Figure S1 a-c). Immunostaining using antibodies
di-rected against a Tau C-terminal moiety (Tau C-ter) and
acetylated tubulin showed Tau C-ter immunoreactivity
in TNTs (Fig. 4b). Saturation of Tau C-ter
anti-bodies with monomeric Tau switched off the
fluores-cence signal (Fig. 4c), demonstrating the specificity of
endogenous Tau staining with the Tau C-ter
anti-bodies. To demonstrate that the signal we detected is
not due to residual exogenous fibrillar Tau that had been
used to trigger TNT formation, we repeated the staining
after exposing primary neurons to Tau-ATTO 647
fibrils. No yellow fluorescence in TNTs, i.e., no
colocali-zation of endogenous (green) immunoreactivity and
ex-ogenous Tau (far red fluorescence), was observed
(Fig. 4d), indicating that soluble Tau is a constitutive
com-ponent of TNTs. As shown in neuronal CAD cells
(Additional file 5: Figure S5 a and c), Tau also co-localized
with actin in TNTs in primary neurons (
n = 3, Pearson
cor-relation = 0.7 ± 0.1) (Additional file 5: Figure S5 b and c).
Trafficking of fibrillar Tau from cell to cell through TNTs
TNTs have been shown to be involved in the spread of
various pathogens and protein fibrils implicated in
neuro-degenerative and infectious diseases [6, 9, 11, 13, 39, 40].
In AD, Tau pathology progresses through a hierarchical
pathway, but the Tau species involved in cell-to-cell
propagation remains unclear. We therefore assessed the
presence of exogenous fibrillar Tau species within TNTs
in CAD neuronal cells and primary neurons.
To visualize Tau fibrils inside TNTs, cells were treated
6 h with labeled exogenous hTau1N4R. Tau fibrils were
observed within neuronal CAD cells (Fig. 5a and
Additional file 6: Figure S6) and primary neurons
(Fig. 5b) TNTs. Time-lapse analysis over a period of
10 h revealed Tau fibrils, moving inside TNTs in both
neuronal CAD cells (Fig. 6a and Additional file 7:
Figure S7 a, b and c) and primary neurons (Fig. 6b
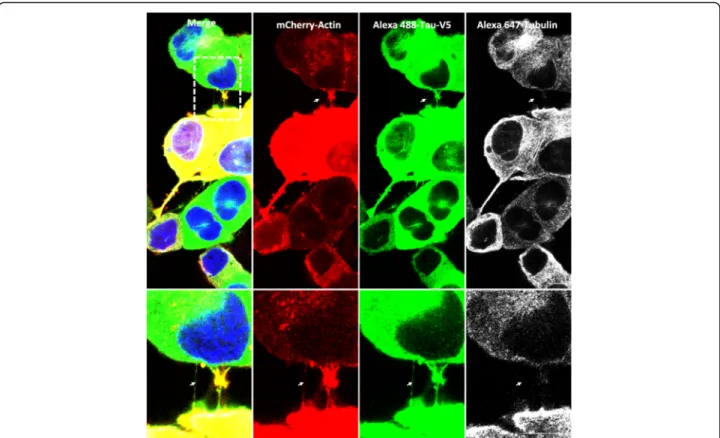
Fig. 1 Tau is associated with TNTs in neuronal CAD cells. Cells were plated in Lab-Tek chamber slides and co-infected with LVs encoding mCherry-Actin (red) and V5-hTau1N4R (green). Neuronal CAD cells were processed for immunocytochemistry analysis using anti-V5 antibodies visualized with an Alexa 488-labeled secondary antibody (green) and anti-acetylated-tubulin visualized with an Alexa 647-labeled secondary antibody (white). Nuclei were labeled with DAPI (blue). Cells were imaged with an inverted laser-scanning confocal microscope using a 40× oil-immersion lens (NA 1.3), and the images were processed using ZEN and ImageJ. A focal plane was collected for each specimen. Scale bars: 10μm. TNTs (white arrows), which are not always bound to the dish, are shown in enlargements
and Additional file 7: Figure S7 d, e and f ). The mean
speed of Tau in TNTs was calculated from video
mi-croscopy, showing that Tau was moving from donor
to recipient cells inside these structures at a mean
speed of 2.83 ± 1.99
μm/min (Fig. 7a, n = 17),
dis-placements that are compatible with actin-based
mo-tility (typically 3
μm/min) [41]. In addition and as
demonstrated for soluble Tau (Additional file 5:
Figure S5), Tau fibrils co-localize with actin in TNTs
(Fig. 7c,
n = 3, Pearson correlation = 0.72 ± 0.1).
Discussion
Tau protein, a microtubule-associated protein first
de-scribed in 1975, has long been regarded as a
mono-functional intracellular protein that modulates neuronal
microtubule dynamics via complex regulation of its
phosphorylation state [42–44]. The role of this protein is
widely documented in neurodegenerative diseases
col-lectively known as tauopathies [45]. These diseases,
in-cluding
AD,
are
characterized
by
intracellular
accumulation of fibrillar material and neuronal loss.
Through a set of neuroanatomical and biochemical
studies, a spatio-temporal progression of Tau
aggrega-tion has been identified, thereby defining pathological
stages as reported for example in AD [46–48].
There is now a growing body of evidence that Tau is a
multifunctional protein involved in various
pathophysio-logical processes that were previously unsuspected.
These new functions related to specific locations
(nucleus [49–52], plasma membrane [53, 54], synapses
[55, 56]…) of Tau protein may help in the design of
in-novative therapeutic approaches. In addition, Tau has
been identified as physiologically secreted into the
extra-cellular space [57, 58]. Moreover, the presence of Tau in
cerebrospinal fluid under pathological conditions has
been known for many years [59], and in stress
condi-tions, it has recently been identified in extracellular
compartments such as cell culture media [60, 61] or
interstitial fluids [62]. These data, combined with the
ex-istence of a hierarchical progression of Tau pathology,
recently led to the hypothesis that Tau assemblies have
prion-like properties. Tau assemblies propagate from
af-fected neuronal cells to naïve neuronal cells [63
–65]. To
traffic between cells, they must either be secreted naked
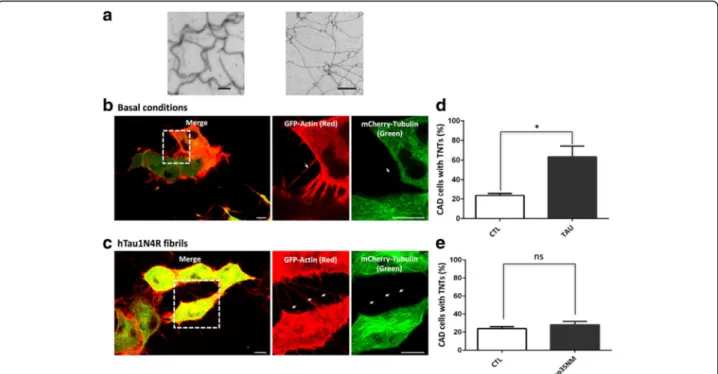
Fig. 2 Extracellular Tau species activate TNT formation in neuronal CAD cells. a Characterization of Tau fibrils. Electron micrographs of
recombinant hTau1N4R (40μM) fibrils assembled in the presence of heparin (10 μM), left panel, Sup35NM (20 μM) fibrils, right panel). Scale bars: 0.1μm. b Confocal imaging of TNTs in neuronal CAD cells in basal conditions. Cells were infected with LVs encoding GFP-Actin (red) and mCherry-Tubulin (green), and confocal imaging was performed 24 h later. Inset: high magnification of TNTs (white arrows). c Confocal imaging of TNTs in neuronal CAD cells after activation with Tau. Cells were infected with LVs encoding GFP-Actin (red) and mCherry-Tubulin (green). At 24 h later, non-labeled hTau1N4R fibrils were added to the extracellular medium, and cells were immediately imaged. Inset: high magnification of TNTs (white arrows). d Quantification of CAD cells with TNTs under basal conditions (CTL) and after activation with 1μM hTau1N4R fibrils (Tau); n = 4 independent experiments; 200 cells per experiment (*, p < 0.1; Mann-Whitney test). e Quantification of CAD cells with TNTs under basal conditions (CTL) and after activation with the amyloid fibril prion Sup35NM (Sup35); n = 3 independent experiments; 200 cells per experiment (NS, non significant; Mann-Whitney test). For (b), (c), (d) and (e), cells were observed via laser-scanning confocal microscopy using a 40× oil-immersion lens (NA 1.3) and processed with ZEN and ImageJ software. A focal plane was collected for each specimen. Scale bars: 10μm
or be encapsulated into vesicles. Naked Tau assemblies
can be secreted into the extracellular environment by
exocytosis and taken up by naïve cells by endocytosis.
Evidence for the secretion of Tau species within
extracel-lular vesicles e.g., exosomes (~30–100 nm), which
ori-ginate from the fusion of multivesicular bodies with the
plasma membrane, and ectosomes (~100–1000 nm),
which form directly from the plasma membrane, has
been reported, but the contribution of these systems to
the spread of disease remains to be confirmed and
de-fined [65–68].
Previous studies have reported the presence of
mis-folded protein assemblies associated with disease within
TNTs directly connecting the cytoplasm of distant cells,
from immune to neuronal cells [1]. Indeed, in addition
to allowing the long-range intercellular transfer of
cyto-plasmic macromolecules, plasma membrane
compo-nents, vesicles and organelles, TNTs have been shown to
allow the transfer of pathogens such as HIV, of
infec-tious prion particles, and of huntingtin-Exon1 aggregates
from affected donor to naive recipient cells [7, 8, 13].
Here, we demonstrate that extracellular Tau species
(monomers and fibrils) activate the formation of TNTs
(Figs. 2 and 3) that subsequently facilitate fibrillar Tau
transfer from neuron to neuron (Figs. 4, 5 and 6).
Extra-cellular Tau is found in stress and pathological
condi-tions [59
–62] and may likely act as a signal for TNT
formation. More interestingly, TNTs facilitate the
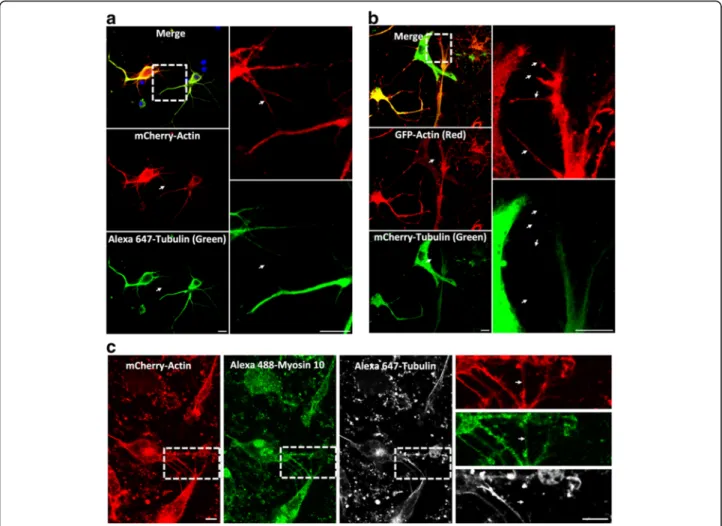
Fig. 3 Extracellular hTau1N4R species favor the establishment of TNTs between primary neurons. a Imaging of TNTs in primary neurons. Cells were infected with LVs encoding mCherry-Actin (red). At 72 h post-infection, cells were processed for immunostaining analysis using anti-acetylated tubulin antibodies visualized with an Alexa 647-labeled secondary antibody (green, polymerized tubulin). Nuclei were labeled with DAPI (blue). b Real-time snapshots of TNTs in primary neurons co-infected with LVs encoding GFP-Actin (red) and mCherry-Tubulin (green, monomeric and polymerized tubulin). (c) Myo10 is present in TNTs in primary neurons. Neurons were plated in Lab-Tek chambers, infected with LVs encoding mCherry-Actin (red) and processed for immunocytochemistry analysis using anti-myosin 10 antibodies visualized with an Alexa 488-labeled secondary antibody (green) and anti-acetylated tubulin visualized with an Alexa 647-labeled secondary antibody (white). Images for (a), (b) and (c) were acquired via laser-scanning confocal microscopy using a 40× oil-immersion lens (NA 1.3) and processed with ZEN and ImageJ software. A focal plane was collected for each specimen. TNTs are shown in enlargements. For (a), (b) and (c), to observe TNTs in primary neurons, 1μM hTau1N4R fibrils were added in extracellular medium. TNTs were never observed in primary neurons without addition of exogenous Tau fibrils. Scale bars: 10μm
(See figure on previous page.)
Fig. 4 Tau is found in TNTs in primary neurons. a Neurons were infected with LVs encoding mCherry-Actin and V5-hTau1N4R. At 72 h post-infection, cells were processed for immunostaining analysis using V5 antibodies visualized with an Alexa 488-labeled secondary antibody (green) and anti-acetylated tubulin visualized with an Alexa 647-labeled secondary antibody (white). b Acquisition of TNTs connecting primary neurons and containing endogenous Tau protein. Cells were infected with LVs encoding mCherry-Actin. At 72 h post-infection, neurons were processed for immunostaining analysis using anti-C-Terminal Tau antibodies (Tau-Cter) visualized with an Alexa 488-labeled secondary antibody (green) and anti-acetylated tubulin visualized with an Alexa 647-labeled secondary antibody (white). For (a) and (b), TNTs containing Tau are shown in enlargements (white arrows). c Cells were infected with LVs encoding mCherry-Actin. At 72 h post-infection, neurons were processed for immunocytochemistry using anti-acetylated tubulin visualized with an Alexa 647-labeled secondary antibody (white) and anti C-Terminal Tau antibodies (Tau-Cter) visualized with an Alexa 488-labeled secondary antibody (green). The C-Terminal Tau antibodies used were saturated with Tau proteins for 24 h at 4 °C to block the specific fluorescence signal of tau. Nuclei were labeled with DAPI (blue). For (a), (b) and (c), 1μM hTau1N4R fibrils were added in the extracellular medium. (d) Cells were infected with LVs encoding mCherry-Actin. TNT formation was activated by ATTO 647-hTau1N4R fibrils. At 72 h later, neurons were processed for immunocytochemistry using anti C-Terminal Tau antibody (Tau-Cter) visualized with an Alexa 488-labeled secondary antibody (green). For (a), (b), (c) and (d), images were acquired using laser-scanning confocal microscopy with a 40× oil-immersion lens (NA 1.3) and processed with ZEN and ImageJ software. Images in (b) and (c) were acquired with the same optical settings and a focal plane was collected. Nuclei were labeled with DAPI (blue). Scale bars: 10μm
Fig. 5 Exogenous Tau fibrils are found within TNTs. CAD neuronal cells (a) or primary neurons (b) were plated in Lab-Tek chamber slides and infected with LVs encoding mCherry-Actin (red). At 48 h post-infection, cells were incubated for six hours with extracellular ATTO 488-hTau1N4R fibrils/liposomes preparation (green). Cells were processed for immunostaining analysis using an anti-acetylated tubulin visualized with an Alexa 647-labeled secondary antibody (white). Nuclei were labeled with DAPI (blue). TNTs containing Tau are shown in enlargements (white arrows). For acquisition, a focal plane was collected for specimen. Images were acquired with an inverted laser-scanning confocal microscope using a 40× oil-immersion lens (NA 1.3) and processed using the programs ZEN and ImageJ. Scale bars: 10μm
transfer of Tau assemblies between neurons. While these
assemblies are fibrillar in our setup, the Tau species
involved in inter-neuronal propagation in vivo remain
unclear and subject to debate [69]. Both oligomeric and
fibrillar forms are found during the course of Tau
path-ology. Thus, one can speculate that both forms are
in-volved in the process, albeit with different kinetics and
functions. Nonetheless, our data clearly demonstrate
that fibrillar Tau transfer from neuron to neuron
through TNTs.
Our finding that Tau is present in TNTs is also of great
importance. Indeed, TNTs are ill-defined, and various
types of TNT-like structures have been described [26].
Identification and characterization of the types of tubular
bridges that connect different cells (e.g., TNTs, filopodia)
requires for specific markers. Our data demonstrate that
Tau, together with actin, is a specific constitutive marker
of TNTs. Our data further suggest that Tau may
contribute to TNT formation and function, thus allowing
a better characterization and understanding of these
highly dynamic structures. This is in agreement with
re-cent data showing that Tau organizes the actin networks.
Indeed, in the absence of Tau, only single actin filaments
could be observed, whereas in the presence of Tau, they
pro-gressively formed long and thick F-actin bundles [70, 71].
This actin-binding property of Tau, in combination with
data emerging from this study, strongly suggests that Tau
might be transported into TNTs via actin. However, Tau
overexpression itself is not sufficient to induce TNT
forma-tion. Whether myosin 10, also found in neuronal TNTs
and acting as an actin motor protein, is required remains
to be elucidated. Identifying cellular mechanisms
support-ing in vivo pathological Tau transfer through TNTs will
help us to define therapeutic targets. In fact, the role of
TNTs in a pathological context such as inflammation has
already been shown between widely spaced dendritic cells
(See figure on previous page.)
Fig. 6 Neuron-to-neuron transfer of Tau fibrils through TNTs. For (a) and (b), cells were infected with LVs encoding GFP-Actin (red). At 48 h post-infection, cells were incubated for six hours with 1μM ATTO 568-hTau1N4R fibrils (green). a Snapshots selected from a time-lapse video and placed in a gallery to visualize neuron-to-neuron transfer of extracellular Tau fibrils by TNTs in neuronal CAD cells. Time-lapse videos were acquired during 5 h and 33 min with an inter-image interval of 6 s. b Images selected from a video to visualize transfer of extracellular hTau1N4R fibrils by TNTs in primary neurons. Neurons were imaged every 6 s for 51 min. For (a) and (b), cells were filmed with an inverted spinning disk microscope using a 63× oil-immersion lens (NA 1.4) and processed with ZEN blue and ImageJ software. For time-lapse acquisition, a focal plane was collected for each specimen. Scale bars: 10μm
Fig. 7 Characteristics of Tau fibrils trafficking in TNTs. For (a) and (b), cells were infected with LVs encoding GFP-Actin (red). At 48 h post-infection, cells were incubated for six hours with 1μM ATTO 568-hTau1N4R fibrils (green). a The speed of Tau fibrils in TNTs in CAD neuronal cells was calculated from 17 independent videos. b Co-localization analysis between Tau fibrils and actin in TNTs. Significant positive correlation was found between Tau fibrils and actin (Pearson correlation coefficient: 0.727). For (a) and (b), cells were filmed with an inverted spinning disk microscope using a 63× oil-immersion lens (NA 1.4) and processed with ZEN blue and ImageJ software. A focal plane was collected for each specimen Scale bar: 10μm
in the adult mouse cornea [28, 72]). Nevertheless, even if
in different in vitro and in vivo experimental models [6, 7,
13, 14, 72], there is now a strong evidence for the role of
TNTs in different stress-induced pathological processes
including the transport of many pathological proteins and
pathogens, it has never been addressed in vivo in the brain
and remains to be investigated.
Conclusions
To conclude, by enhancing TNT formation, exogenous
Tau species appears to mediate a deleterious cycle that
favors the transfer of assemblies tightly associated with
disease between neurons.
Additional files
Additional file 1: Figure S1. Endogenous Tau in neuronal CAD cells and fluorescence setup controls. (a) Neuronal CAD cells were infected with LV encoding mCherry-Actin (red). Cells were processed for immunostaining ana-lysis using anti-C-Terminal Tau antibodies (Tau-Cter) visualized with an Alexa 488-labeled secondary antibody (green) and anti-acetylated tubulin visualized with an Alexa 647-labeled secondary antibody (white). (b) Cells were infected with LV encoding mCherry-Actin and processed for immunostaining analysis using anti-C-Terminal Tau antibodies (Tau-Cter) visualized with an Alexa 488-labeled secondary antibody (green) and anti-acetylated tubulin visual-ized with an Alexa 647-labeled secondary antibody (white). The Tau anti-body used were saturated with Tau proteins for 24 h at 4 °C to block the specific fluorescence signal of tau. Nuclei were labeled with DAPI (blue). (c) Biochemical analysis of endogenous Tau in neuronal CAD cells. Cell lysates were analyzed by immunoblotting using Tau-Cter and Tau-Nter antibodies. Controls correspond to mouse hippocampus cell homogenate (CTL1) and Tau protein overexpressed in cells using LVs encoding Tau (CTL 2). (d) Setup for visualization of the non-specific fluorescence signal of secondary antibodies or fusion proteins (GFP or mCherry) in neuronal CAD cells. (e) Setup for visualization of non-specific fluorescence signal of second-ary antibodies or fusion protein (GFP or mCherry) in primsecond-ary neurons. For (d) and (e), cells were incubated with secondary antibodies (Alexa 488 or Alexa 647). Nuclei were labeled with DAPI (blue). For images, a focal plane was collected for specimen. Scale bars: 10μm. (TIFF 12495 kb)
Additional file 2: Figure S2. Characterisation of Tau 1N4R fibrillar assemblies. (a) Representative negatively stained TEM of sonicated fibrils. Scale bar, 100 nm. (b) Length distribution of sonicated Tau fibrils obtained by measuring the length of 227 fibrils in negatively stained TEM samples. (TIF 19797 kb)
Additional file 3: Figure S3. Phenotypical characterization of TNTs established between neuronal CAD cells. (a) Maximum-intensity projection of TNTs in CAD neuronal cells. CAD cells were plated in Lab-Tek chamber slides, infected with LVs encoding mCherry-Actin (red) and processed for immuno-staining analysis using anti-acetylated tubulin antibodies visualized with an Alexa 488-labeled secondary antibody (green, polymerized tubulin). Nuclei were labeled with DAPI (blue). (b) Real-time focal plane acquisition of TNTs in CAD cells infected with LV encoding mCherry-Actin (red) and incubated with tubulin tracker (Taxol, green, polymerized tubulin). (c) Real-time focal plane acquisition of TNTs in CAD cells co-infected with LVs encoding GFP-actin (red) and mCherry-Tubulin (green, monomeric and polymerized tubulin). (d) Myo10 is present in TNTS in CAD neuronal cells. CAD cells were plated in Lab-Tek cham-ber slides, infected with LV encoding mCherry-Actin (red) and processed for immunocytochemistry analysis using anti-myosin 10 antibodies visualized with an Alexa 488-labeled secondary antibody (green). Tubulin is visualized using an anti-acetylated tubulin antibody and an Alexa 647-labeled secondary antibody (white). For acquisition, a focal plane was collected for specimen. Images in (a), (b), (c) and (d) were acquired using an inverted laser-scanning confocal micro-scope using a 40× oil-immersion lens (NA 1.3) and processed with ZEN and ImageJ software. TNTs (white arrows), which are not always bound to the dish,
are shown in enlargements. Experiments were replicated at least three times. Scale bars: 10μm. (TIFF 21472 kb)
Additional file 4: Figure S4. Size and formation of TNTs in neuronal CAD cells. (a) Length and diameter of TNTs in neuronal CAD cells in fixed and live cells. Twenty TNTs (white arrow) were analyzed using mCherry-Actin (red) and anti-acetylated tubulin antibodies visualized with an Alexa 488-labeled second-ary antibody (green) (fixed cells) or GFP Actin and mCherry-Tubulin (live cells). (***, p < 0.001; Mann-Whitney test). (b) Neuronal CAD cells were infected with LVs encoding GFP-Actin (Red) and mCherry-Tubulin (Green) and filmed with an inverted Nikon microscope using a 40× air-immersion lens (NA 0.9) and proc-essed with NIS software. Still images were selected from time-lapse videos and placed in a gallery to visualize the TNT“filopodia-like” formation mechanism. Cell 1 extends a tube in the direction of cell 2. The tube of cell 1 docks to cells 2 and creates a TNT bridge (white arrows). Time-lapse images for this series were acquired during 1 h with an inter-image interval of 17.28 s. (c) Neuronal CAD cells were infected with LVs encoding mCherry-Actin and incubated with tubu-lin tracker (taxol, green). Real time focal plane observation of cells was per-formed by laser-scanning confocal microscopy using a 40× oil-immersion lens (NA 1.3) and processed with ZEN and ImageJ software. Snapshots from a video were selected to show the“kiss-and-run” formation mechanism of TNTs. Cells 1 and 2 are coming closer and moving forward to develop TNT bridges (white arrows). Cells were imaged every 25 s for 13 min. Scale bars: 10μm. (d) Movie for“filopodia-like” formation mechanism in neuronal CAD cells. Cells were co-infected with LVs encoding GFP-Actin and mCherry-Tubulin. After 24 h, cells were observed with an inverted Nikon microscope using a 40× air-immersion lens (NA 0.9) and processed with NIS and ImageJ software. Cells were imaged every 17.28 s for 1 h. Only GFP-actin (white) is presented. (e) Movie for “kiss-and-run” formation mechanism in neuronal CAD cells. Cells were infected with LVs encoding mCherry-Actin and incubated with a tubulin tracker (taxol, green). Real time observations were performed using a laser-scanning confocal micro-scope and a 40× oil-immersion lens (NA 1.3) and were processed with ZEN and ImageJ software. Cells were imaged every 25 s for 13 min. Only mCherry-actin (white) is presented. (TIFF 16089 kb)
Additional file 5: Figure S5. Tau and actin co-localize in TNTs. (a) and (b) Co-localization analysis between Tau and actin in TNTs in CAD cells and primary neurons. (C) Pearson correlation coefficient analysis in CAD cells and primary neurons. Significant positive correlations were found between Tau and actin in CAD cells (n = 3, Pearson correlation coefficient = 0.764 ± 0.09) and primary neurons (n = 3, Pearson correlation coefficient = 0.772 ± 0.1). For (a) and (b), cells were plated in Lab-Tek chamber slides and co-infected with LVs encoding mCherry-Actin (red) and V5-hTau1N4R (green). Cells were processed for immunocytochemistry analysis using anti-V5 antibodies visualized with an Alexa 488-labeled secondary antibody (green) and anti-acetylated-tubulin visualized with an Alexa 647-labeled secondary antibody (white). Cells were imaged with an inverted laser-scanning confocal microscope using a 40× oil-immersion lens (NA 1.3), and the images were processed with ZEN and ImageJ software. Scale bars: 10μm. (TIFF 7665 kb)
Additional file 6: Figure S6. Three-dimensional view of exogenous Taufibrils within TNTs. Neuronal CAD cells were plated in Lab-Tek chamberslides and infected with LVs encoding mCherry-Actin (red). 48 h postinfection,cells were incubated six hours with extracellular ATTO 488-hTau1N4R fibrils (green). Cells were processed for immunostaining analysisusing an anti-acetylated tubulin visualized with an Alexa
647-labeledsecondary antibody (white). Nuclei were labeled with DAPI (blue). TNTscontaining Tau are shown by three-dimensional view. Images (focalseries) were acquired with an inverted laser-scanning confocal microscopeusing a 40× oil-immersion lens (NA 1.3) and processed using theprograms ZEN and ImageJ. (MOV 2405 kb) Additional file 7: Figure S7. Fibrillar Tau transfer through TNTs in neurons. (a) Movies for neuron-to-neuron transfer of extracellular Tau fibrils by TNTs in neuronal CAD cells. (b) Movie of in vitro tracking of extracellular Tau fibrils in TNTs in CAD cells. Tracking was performed with the mtrack plugin for ImageJ. (c) Kymograph representation of extracellular Tau fibrils inside TNTs in neuronal CAD cells. The kymo-graph was generated from the movie (b), which shows the fluorescence intensity along the x-axis over time (y-axis). (d) Movies for neuron-to-neuron transfer of extracellular hTau1N4R fibrils by TNTs in primary neurons. (e) Movie of in vitro tracking of extracellular Tau fibrils in TNTs
in primary neurons. Tracking were performed with the mtrack plugin of ImageJ. (f) Kymograph representation of extracellular Tau fibrils inside TNTs in primary neurons. The kymograph was generated from the movie in (d), which shows the presence of fluorescence intensity along the x-axis over time (y-axis). For (c) and (f), the first acquisition of the time-lapse movie is the top of the kymograph (arrowhead 1), and the last acquisition is the bottom of the kymograph (arrowhead 2). Arrowheads represent the same object moving from the bottom to the top. For (a) and (d), cells were infected with LVs encoding GFP-Actin (red). At 48 h post-infection, cells were incubated six hours with ATTO 568-hTau1N4R fibrils (green). Cells were filmed with an inverted spinning disk micro-scope using 63× oil-immersion lens (NA 1.4) and processed using ZEN blue and ImageJ. For images, a focal plane was collected for specimen. Scale bars: 10μm. (TIFF 16305 kb)
Acknowledgments
We thank Dr. Isabelle Arnal for her critical reading of the manuscript and BiCel and IMAGIF facilities for access to microscopes. This work was supported by grants from ANR (SPREADTAU), Association France Alzheimer, Region Hauts de France StartAIRR grant (TiNTs) and from the program Investissement d’avenir LabEx (laboratory excellence) DISTALZ (Development of Innovative Strategies for a Transdisciplinary approach to ALZheimer’s disease). Our laboratories are also supported by LiCEND (Lille Centre of Excellence in Neurodegenerative Disorders), CNRS, Inserm, Métropole Européenne de Lille, Univ. Lille 2, FEDER, DN2M and the Fondation Bettencourt Schueller. The authors declare no conflict of interest regarding the present work.
Authors’ contributions
MT performed cell lines culture, lentiviral vector infection, immunoassay and cell labelling , live and fluorescence imaging, microscopy acquisitions, quantification and images analysis, and participated to the design of some experiments, the discussion and the writing of the manuscript. SB performed lentiviral vectors production, primary neuronal cultures and some
immunofluorescence studies. AC purified monomeric Tau and Sup35 proteins. SD participated to some experiments and primary neuronal cultures. LBo generated Tau and Sup35p fibrils, characterized those fibrils, labeled them for fluorescence imaging, co-designed some of the studies, discussed the results and co-prepared the manuscript. RM co-designed some of the studies, discussed the results and co-drafted the manuscript. LBu and MC conceived the original study, participated to the design and
coordination of the experiments, discussed data and co-prepared the manuscript. All authors read and approved the final manuscript. Competing interests
The authors declare that they have no competing interests. Author details
1
Université Lille, Inserm, CHU-Lille, UMR-S1172, Alzheimer & Tauopathies, 59000 Lille, France.2Paris-Saclay Institute of Neuroscience, Centre National de
la Recherche Scientifique, Université Paris-Saclay, 91190 Gif-sur-Yvette, France.
3Massachusetts General Hospital, Neurology Department, Mass General
Institute for Neurodegenerative Disease, Charlestown, MA 02129, USA.
4Inserm UMR- S1172, JPArc,‘Alzheimer & Tauopathies’, Place de Verdun,
59045 Lille Cedex, France.
Received: 21 September 2016 Accepted: 20 October 2016
References
1. Rustom A, Saffrich R, Markovic I, Walther P, Gerdes HH. Nanotubular highways for intercellular organelle transport. Science. 2004;303:1007–10. 2. Gurke S, Barroso JF, Hodneland E, Bukoreshtliev NV, Schlicker O, Gerdes HH. Tunneling nanotube (TNT)-like structures facilitate a constitutive, actomyosin-dependent exchange of endocytic organelles between normal rat kidney cells. Exp Cell Res. 2008;314:3669–83. doi:10.1016/j.yexcr.2008.08.022.
3. Davis DM, Sowinski S. Membrane nanotubes: dynamic long-distance connections between animal cells. Nat Rev Mol Cell Biol. 2008;9:431–6. doi: 10.1038/nrm2399.
4. Onfelt B, Nedvetzki S, Yanagi K, Davis DM. Cutting edge: Membrane nanotubes connect immune cells. J Immunol. 2004;173:511–1513.
5. Sherer NM, Mothes W. Cytonemes and tunneling nanotubules in cell-cell communication and viral pathogenesis. Trends Cell Biol. 2008;18:414–20. doi:10.1016/j.tcb.2008.07.003.
6. Gousset K, et al. Prions hijack tunnelling nanotubes for intercellular spread. Nat Cell Biol. 2009;11:328–36. doi:10.1038/ncb1841.
7. Sowinski S, et al. Membrane nanotubes physically connect T cells over long distances presenting a novel route for HIV-1 transmission. Nat Cell Biol. 2008;10:211–9. doi:10.1038/ncb1682.
8. Gousset K, Marzo L, Commere PH, Zurzolo C. Myo10 is a key regulator of TNT formation in neuronal cells. J Cell Sci. 2013;126:4424–35. doi:10.1242/jcs.129239. 9. Lachambre S, Chopard C, Beaumelle B. Preliminary characterisation of
nanotubes connecting Tcells and their use by HIV-1. Biol Cell. 2014;106:394– 404. doi:10.1111/boc.201400037.
10. Astanina K, Koch M, Jüngst C, Zumbusch A, Kiemer AK. Lipid droplets as a novel cargo of tunnelling nanotubes in endothelial cells. Sci Rep. 2015;5: 11453. doi:10.1038/srep11453.
11. Eugenin EA, Gaskill PJ, Berman JW. Tunneling nanotubes (TNT): A potential mechanism for intercellular HIV trafficking. Commun Integr Biol. 2009;2:243–4. 12. Wang Y, Cui J, Sun X, Zhang Y. Tunneling-nanotube development in
astrocytes depends on p53 activation. Cell Death Differ. 2011;18:732–42. doi:10.1038/cdd.2010.
13. Costanzo M, et al. Transfer of polyglutamine aggregates in neuronal cells occurs in tunneling nanotubes. J Cell Sci. 2013;126:3678–85. doi:10.1242/jcs.126086. 14. Ding X, et al. Exposure to ALS-FTD-CSF generates TDP-43 aggregates in
glioblastoma cells through exosomes and TNTs-like structure. Oncotarget. 2015;6:24178–91.
15. Goedert M. NEURODEGENERATION. Alzheimer’s and Parkinson’s diseases: The prion concept in relation to assembled Aβ, tau, and α-synuclein. Science. 2015;349:1255555. doi:10.1126/science.1255555.
16. Liberski PP. Prion, prionoids and infectious amyloid. Parkinsonism Relat Disord. 2014; 20:S80–4. doi:10.1016/S1353-8020(13)70021-X.
17. Jucker M, Walker LC. Self-propagation of pathogenic protein aggregates in neurodegenerative diseases. Nature. 2013;501:45–51. doi:10.1038/nature12481. 18. Aguzzi A, Lakkaraju AK. Cell biology of prions and prionoids: a status report.
Trends Cell Biol. 2016;26:40–51. doi:10.1016/j.tcb.2015.08.007. 19. Caillierez R, et al. Lentiviral delivery of the human wild-type tau protein
mediates a slow and progressive neurodegenerative tau pathology in the rat brain. Mol Ther. 2013;21:1358–68. doi:10.1038/mt.2013.66.
20. Sergeant N, et al. Dysregulation of human brain microtubule-associated tau mRNA maturation in myotonic dystrophy type 1. Hum Mol Genet. 2001;10:2143–55. 21. Sautiere PE, Caillet-Boudin ML, Wattez A, Delacourte A. Detection of
Alzheimer-type tau proteins in okadaic acid-treated SKNSH-SY5Y neuroblastoma cells. Neurodegeneration. 1994;3:53–60.
22. Krzewska J, Melki R. Molecular chaperones and the assembly of the prion Sup35p, an in vitro study. EMBO J. 2006;25:822–33.
23. Gerdes HH, Bukoreshtliev NV, Barroso JF. Tunneling nanotubes: a new route for the exchange of components between animal cells. FEBS Lett. 2007;581:2194–201.
24. Austefjord MW, Gerdes HH, Wang X. Tunneling nanotubes: diversity in morphology and structure. Commun Integr Biol. 2014;7, e27934. doi:10. 4161/cib.27934.
25. Wittig D, Wang X, Walter C, Gerdes HH, Funk RH, Roehlecke C. Multi-level communication of human retinal pigment epithelial cells via tunneling nanotubes. PLoS One. 2012;7, e33195. doi:10.1371/journal.pone.0033195. 26. Abounit S, Delage E, Zurzolo C. Identification and characterization of
tunneling nanotubes for intercellular trafficking. Curr Protoc Cell Biol. 2015; 67:12.10.1–12.10.21. doi:10.1002/0471143030.cb1210s67.
27. Benard M, et al. Structural and functional analysis of tunneling nanotubes (TnTs) using gCW STED and gconfocal approaches. Bio Cell. 2015;107:419– 25. doi:10.1111/boc.201500004.
28. Chauveau A, Aucher A, Eissmann P, Vivier E, Davis DM. Membrane nanotubes facilitate long-distance interactions between natural killer cells and target cells. Proc Natl Acad Sci U S A. 2010;107:5545–50. doi:10.1073/ pnas.0910074107.
29. Comerci CJ, Mace EM, Banerjee PP, Orange JS. CD2 promotes human natural killer cell membrane nanotube formation. PLoS One. 2012;7, e47664. doi:10.1371/journal.pone.0047664.
30. Luchetti F, et al. Fas signalling promotes intercellular communication in T cells. PLoS One. 2012;7, e35766. doi:10.1371/journal.pone.0035766. 31. Seyed-Razavi Y, Hickey MJ, Kuffová L, McMenamin PG, Chinnery HR.
a novel mode of immune cell interaction. Immunol Cell Biol. 2013;91:89–95. doi:10.1038/icb.2012.52.
32. Sun X, et al. Tunneling-nanotube direction determination in neurons and astrocytes. Cell Death Dis. 2012;3, e438. doi:10.1038/cddis.2012.177. 33. Hase K, et al. M-Sec promotes membrane nanotube formation by interacting with
Ral and the exocyst complex. Nat Cell Biol. 2009;11:1427–32. doi:10.1038/ncb1990. 34. Bukoreshtliev NV, Wang X, Hodneland E, Gurke S, Barroso JF, Gerdes HH.
Selective block of tunneling nanotube (TNT) formation inhibits intercellular organelle transfer between PC12 cells. FEBS Lett. 2009;583:1481–8. doi:10. 1016/j.febslet.2009.03.065.
35. Vallabhaneni KC, Haller H, Dumler I. Vascular smooth muscle cells initiate proliferation of mesenchymal stem cells by mitochondrial transfer via tunneling nanotubes. Stem Cells Dev. 2012;21:3104–13. doi:10.1089/scd.2011.0691. 36. Bucciantini M, et al. Toxic effects of amyloid fibrils on cell membranes: the
importance of ganglioside GM1. FASEB J. 2012;26:818–31. doi:10.1096/fj.11-189381. 37. Krammer C, et al. Prion protein/protein interactions: fusion with yeast
Sup35p-NM modulates cytosolic PrP aggregation in mammalian cells. FASEB J. 2008;22:762–73.
38. Krammer C, et al. The yeast Sup35NM domain propagates as a prion in mammalian cells. Proc Natl Acad Sci U S A. 2009;106:462–7. doi:10.1073/ pnas.0811571106.
39. Kadiu I, Gendelman HE. Human immunodeficiency virus type 1 endocytic trafficking through macrophage bridging conduits facilitates spread of infection. J Neuroimmune Pharmacol. 2011;6:658–75. doi:10.1007/s11481-011-9298-z. 40. Marzo L, Gousset K, Zurzolo C. Multifaceted roles of tunneling nanotubes in
intercellular communication. Front Physiol. 2012;3:72. doi:10.3389/fphys.2012.00072. 41. Pantaloni D, Le Clainche C, Carlier MF. Mechanism of actin-based motility.
Science. 2001;292:1502–6.
42. Lindwall G, Cole RD. Phosphorylation affects the ability of tau protein to promote microtubule assembly. J Biol Chem. 1984;259:5301–5.
43. Cho J-H, Johnson GVW. Primed phosphorylation of tau at Thr231 by glycogen synthase kinase 3beta (GSK3beta) plays a critical role in regulating tau’s ability to bind and stabilize microtubules. J Neurochem. 2004;88:349–58. 44. Weingarten MD, Lockwood AH, Hwo SY, Kirschner MW. A protein factor
essential for microtubule assembly. Proc Natl Acad Sci U S A. 1975;72:1858–62. 45. Iqbal K, Liu F, Gong CX. Tau and neurodegenerative disease: the story so far.
Nat Rev Neurol. 2016;12:15–27. doi:10.1038/nrneurol.2015.225.
46. Braak H, Braak E. Neuropathological stageing of Alzheimer-related changes. Acta Neuropathol. 1991;82:239–59.
47. Delacourte A, et al. The biochemical pathway of neurofibrillary
degeneration in aging and Alzheimer’s disease. Neurology. 1999;52:1158–65. 48. Duyckaerts C, et al. Modeling the relation between neurofibrillary tangles
and intellectual status. Neurobiol Aging. 1997;18:267–73.
49. Qu MH, et al. Neuronal tau induces DNA conformational changes observed by atomic force microscopy. Neuroreport. 2004;15:2723–7.
50. Sjöberg MK, Shestakova E, Mansuroglu Z, Maccioni RB, Bonnefoy E. Tau protein binds to pericentromeric DNA: a putative role for nuclear tau in nucleolar organization. J Cell Sci. 2006;119:2025–34.
51. Sultan A, et al. Nuclear tau, a key player in neuronal DNA protection. J Biol Chem. 2011;286:4566–75. doi:10.1074/jbc.M110.199976.
52. Violet M, et al. A major role for Tau in neuronal DNA and RNA protection in vivo under physiological and hyperthermic conditions. Front Cell Neurosci. 2014;8:84. doi:10.3389/fncel.2014.00084.
53. Brandt R, Léger J, Lee G. Interaction of tau with the neural plasma membrane mediated by tau’s amino-terminal projection domain. J. Cell Biol. 1995;131:1327–40.
54. Pooler AM, Usardi A, Evans CJ, Philpott KL, Noble W, Hanger DP. Dynamic association of tau with neuronal membranes is regulated by
phosphorylation. Neurobiol Aging. 2012;33:431.e27–38. doi:10.1016/j. neurobiolaging.2011.01.005.
55. Ittner LM, et al. Dendritic function of tau mediates amyloid-beta toxicity in Alzheimer’s disease mouse models. Cell. 2010;142:387–97. doi:10.1016/j.cell. 2010.06.036.
56. Mondragón-Rodríguez S, Trillaud-Doppia E, Dudilot A, Bourgeois C, Lauzon M, Leclerc N. Interaction of endogenous tau protein with synaptic proteins is regulated by N-methyl-D-aspartate receptor-dependent tau
phosphorylation. J Biol Chem. 2012;287:32040–53.
57. Pooler AM, Phillips EC, Lau DHW, Noble W, Hanger DP. Physiological release of endogenous tau is stimulated by neuronal activity. EMBO Rep. 2013;14: 389–94. doi:10.1074/jbc.M112.401240.
58. Yamada K, et al. Neuronal activity regulates extracellular tau in vivo. J Exp Med. 2014;211:387–93. doi:10.1084/jem.20131685.
59. Johnson GV, Seubert P, Cox TM, Motter R, Brown JP, Galasko D. The tau protein in human cerebrospinal fluid in Alzheimer’s disease consists of proteolytically derived fragments. J Neurochem. 1997;68:430–3. 60. Plouffe V, Mohamed NV, Rivest-McGraw J, Bertrand J, Lauzon M, Leclerc N.
Hyperphosphorylation and cleavage at D421 enhance tau secretion. PLoS One. 2012;7, e36873. doi:10.1371/journal.pone.0036873.
61. Chai X, Dage JL, Citron M. Constitutive secretion of tau protein by an unconventional mechanism. Neurobiol Dis. 2012;48:356–66. doi:10.1016/j. nbd.2012.05.021.
62. Yamada K, et al. In vivo microdialysis reveals age dependent decrease of brain interstitial fluid tau levels in P301S human tau transgenic mice. J Neurosci. 2011;31:13110–7. doi:10.1523/JNEUROSCI.2569-11.2011. 63. Clavaguera F, et al. Brain homogenates from human tauopathies induce tau
inclusions in mouse brain. Proc Natl Acad Sci U S A. 2013;110:9535–40. doi: 10.1073/pnas.1301175110.
64. Sanders DW, et al. Distinct tau prion strains propagate in cells and mice and define different tauopathies. Neuron. 2014;82:1271–88. doi:10.1016/j.neuron. 2014.04.047.
65. Dujardin S, et al. Ectosomes: a new mechanism for non-exosomal secretion of tau protein. PLoS One. 2014;9, e100760. doi:10.1371/journal.pone.0100760. 66. Simón D, García-García E, Gómez-Ramos A, Falcón-Pérez JM, Díaz-Hernández
M, Hernández F. Tau overexpression results in its secretion via membrane vesicles. Neurodegener Dis. 2012;10:73–5. doi:10.1159/000334915.
67. Saman S, et al. Exosome-associated tau is secreted in tauopathy models and is selectively phosphorylated in cerebrospinal fluid in early Alzheimer disease. J Biol Chem. 2012;287:3842–9. doi:10.1074/jbc.M111.277061. 68. Asai H, et al. Depletion of microglia and inhibition of exosome synthesis
halt tau propagation. Nat Neurosci. 2015;18:1584–93. doi:10.1038/nn.4132. 69. Takeda S, et al. Neuronal uptake and propagation of a rare phosphorylated
high-molecular-weight tau derived from Alzheimer’s disease brain. Nat Commun. 2015;6:8490. doi:10.1038/ncomms9490.
70. Elie A, et al. Tau co-organizes dynamic microtubule and actin networks. Sci Rep. 2015;5:9964. doi:10.1038/srep09964.
71. He HJ, Wang XS, Pan R, Wang DL, Liu MN, He RQ. The proline-rich domain of tau plays a role in interactions with actin. BMC Cell Biol. 2009;10:81. doi: 10.1186/1471-2121-10-81.
72. Chinnery HR, Pearlman E, McMenamin PG. Cutting edge: membrane nanotubes in vivo: a feature of MHC class II+ cells in the mouse cornea. J Immunol. 2008;180:5779–83.
• We accept pre-submission inquiries
• Our selector tool helps you to find the most relevant journal • We provide round the clock customer support
• Convenient online submission • Thorough peer review
• Inclusion in PubMed and all major indexing services • Maximum visibility for your research
Submit your manuscript at www.biomedcentral.com/submit