See discussions, stats, and author profiles for this publication at: https://www.researchgate.net/publication/334001951
Bioindication of Urban Air Polycyclic Aromatic Hydrocarbons Using Petunia
Hybrida
Article in Civil Engineering Journal · June 2019 DOI: 10.28991/cej-2019-03091333 CITATIONS 9 READS 168 5 authors, including:
Some of the authors of this publication are also working on these related projects:
Motor current signal analysisView project
ARCHIMEDView project Fatima Benaissa
University M'Hamed Bougara of Boumerdes 11PUBLICATIONS 19CITATIONS SEE PROFILE Rezak Alkama Université de Béjaïa 48PUBLICATIONS 157CITATIONS SEE PROFILE
Civil Engineering Journal
Vol. 5, No. 6, June, 2019
1305
Bioindication of Urban Air Polycyclic Aromatic Hydrocarbons
Using Petunia Hybrida
Fatima Benaissa
a, b*, Ibrahim Bendahmane
c, Nassima Bourfis
d,
Oussama Aoulaiche
a, Rezak Alkama
ea Biology department. University of Boumerdes. Faculty of Sciences, Railway Station Road - Boumerdes 35000, Algeria.
b Laboratory Biomathematics, Biophysics, Biochemistry and Scientometry L3BS, University of Bejaia, Targa Ouzemour, Bejaia 06000, Algeria. c Research Laboratory in Applied Hydraulics and Environment (LRHAE), University of Bejaia, Targa Ouzemour, Bejaia 06000, Algeria.
d Department of Agricultural Sciences, Bouira university, Bouira 10000, Algeria. e Electrical Engineering Laboratory, Bejaia University, Targa Ouzemour, Bejaia 06000, Algeria.
Received 21 February 2018; Accepted 27 May 2019
Abstract
Different ways can be used to determinate the effects of hydrocarbons on plants: the bioindication with plants is one of these methods. It consists of using sensitive plants like Petunia hybrida to evaluate the urban levels of hydrocarbon pollution. The sensitivity shows physiological and morphological modifications. In this context, this research aims to characterize the level of exposure to air pollutants resulting from anthropogenic activities in urban area of Bejaia (Algeria) by measuring the morphological impacts induced on Petunia hybrida using 11 parameters detailing the morphological development of this plant. During 7 weeks (March 23- May 11, 2017), ten monitoring stations were chosen in this city. The results showed that the most important morphological changes are directly associated with the stations closest to the main atmospheric emission zones. It is by moving away from these sources of exposure that the morphological changes observed in this bioindicating plant become less important. These results coincide with those found for particle matter concentrations including PM10 and PM2.5 which indicate that Daouadji and Aamriw stations are the most polluted sites in
Bejaia. Analyzes carried out on research station located in rural area (more than 30 km from the studied city) revealed a greater general development compared to other stations.
Keywords: Bioindication; Urban Air Pollution; Petunia Hybrida; Active Approach; Morphological Changes.
1. Introduction
Polycyclic aromatic hydrocarbons enter the environment through various routes and are usually found as a mixture containing two or more of these compounds [1-4]. However, most PAHs are generated by incomplete combustion and pyrolysis of organic substances during industrial production, transportation, waste incineration and so on [5]. PAHs are widely distributed in the atmosphere and they can be transported over long distances before depositing through atmospheric precipitation into soils, vegetation or waters [1, 6].
According to Nielsen [7], Allen J.O [8] and Maliszewska [1], PAHs were distributed among aerosol size fractions based on molecular weight. So, those with molecular weights between 178 and 202 g/mol were approximately evenly
* Corresponding author: f.benaissa@univ-boumerdes.dz http://dx.doi.org/10.28991/cej-2019-03091333
© 2019 by the authors. Licensee C.E.J, Tehran, Iran. This article is an open access article distributed under the terms and conditions of the Creative Commons Attribution (CC-BY) license (http://creativecommons.org/licenses/by/4.0/).
Civil Engineering Journal Vol. 5, No. 6, June, 2019 distributed between the aerodynamic diameter <2.5 µm and aerodymanic diameter > 2.5 µm aerosols. Others PAH with molecular weights greater than 228 g/mol were associated primarily with the fine aerosol fraction. This is in urban samples and in the rural ones, low and high molecular weight PAH were associated with both the fine and coarse aerosols.
Almost PAHs and their epoxides are highly toxic, mutagenic and/or carcinogenic to organisms including humans [9-12]. However, plants are the most endangered due to their permanent occurrence in outside conditions during the growing time. So many studies demonstrated that ethylene (H2C-CH2) air pollution is a continual source of stress for
plant growth and development in an urban environment. While the toxicity of PAHs has been extensively investigated [13-15]. PAHs affect the plant at the leaf surface and also enter the plant via stomata, disturbing metabolic processes. The main effects of PAHs on a plant are leaf damage and alteration of normal growth [13]. Of all the PAHs likely to cause direct effects on plants, ethylene is the most likely candidate because of its role as a plant hormone [14].
Although ethylene is a naturally produced plant hormone, it may also occur as an air pollutant and is known to adversely affect plant performance. Ethylene affect the development of tissues and normal organ development by modifying the activities of plant hormone and growth regulators, which, without causing leaf-tissue collapse and necrosis [15]. The use of plants as samplers of organic compounds in the atmospheric has been suggested by many authors [16-18]. It consists of the use of responses of individual plants or plant associations at several biological organization levels in order to detect or predict changes in the environment and to follow their evolution as a function of time.
Presence of PAHs in air can be detected by air pollutant sensitive higher plants [19]. Bioindicators are living organisms such as plants, planktons, animals, and microbes, which are uti- lized to screen the health of the natural ecosystem in the environment. They are used for assessing environmental health and biogeographic changes taking place in the environment [20]. Many studies have focused on PAHs emission from mobile sources but there is limited information on stationary sources especially on the emissions from industrial stacks [21]. Toxic PAHs and NPAHs are major components of PM2.5 exhausted from combustion of fossil fuels and biomass [22].
In Bejaia the criteria air pollutants such as SO2, NOx, CO and PM10 (particulate matter with the aerodynamic diameter
less than or equal to 10μm) have been monitored at 10 stations in 2015 [23]. However, monitoring of PAHs in Bejaia has not been established compared to the criteria air pollutants and their levels have not been reported. As higher plants are more efficient at accumulating gaseous organic pollutants on the leaf surface [24-27] and because it is sensitive to Ethylene [17, 18, 28], Petunia hybrida was chosen as the bioindicator in this study.
This study is the first bioindication study in this region examined the morphological characteristics effect of HAPs on petunia plants and estimated the correlation between the recorded results and the PM10 concentrations measured at
two sites differing in PM10 exposure.
2. Materials and Methods
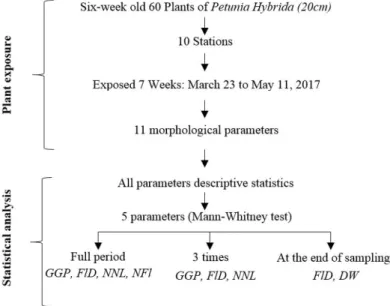
In an active bioindication approach of air pollution, potted plants of Petunia hybrida (indicator plant of ethylene) was used in urban area of Bejaia according to the protocol given by Garrec [29]. The flowchart below shows the research methodology.
1307 2.1. Study Area
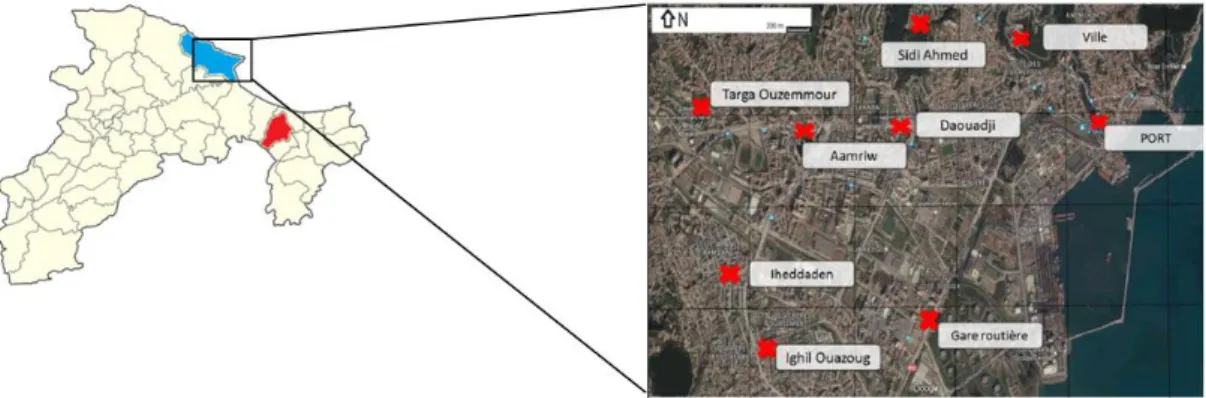
The study area included a control site in Imdan at about 30 km, eastern Béjaia department and 9 sampling sites located in Bejaia city (Sidi Ahmed (SA), Targa Ouzemour (TO), Ihaddaden (Id), Ighil Ouazoug (IO), Ville (Vl), Daouadji (Dd), Port (Pt), Gare routière (Gr) and Aamriw (Aw)) (Table 1, Figure 2).
Figure 2. Location of the monitoring stations considered in the Environmental Plan Table 1. The study area: description of the biomonitoring sites
Site Localisation Remarks of contamination
Control Imdan 35 km east of Bejaia (Rural)
IO Ighil Ouazoug 1 km from Iheddaden (Urban)
TO Targa Ouzemmour* 1 km East Aamriw (Urban)
Dd Daouadji 1 km West Aamriw Air pollution measured for many pollutant (Raod Urban)
Id Iheddaden 1 km South Aamriw (Raod Urban)
SA Sidi Ahmed¥ 1 km North Daouadji (Urban)
Vl Ville 1 km West of Sidi Ahmed (Urban)
Aw Aamriw New city center of Bejaia (Raod Urban)
Gr Gare routière (Raod Urban)
Pr Port 1 km Southeast of Ville (Raod)
* 500 m from road
2.2. Collection of Material
Petunia hybrida is used in the experiment presented. Plants were cultivated and exposed in 20 cm diameter pots with similar soil volume and slowly released fertilizer, which was sufficient for the whole experiment period.
Six-week old Petunia was transported to the exposure sites. The sites were chosen on the basis of previous air pollution monitoring. A total of 60 pots were distributed on the different sites (6 pots for each one). The period of exposure (from March 23 to May 11, 2017) was connected with plants physiological functions. As is usual for this kind of studies, the first assessment is carried out immediately before exposure. Further assessments are carried out about every 7 days. Each plant is assessed for impact criteria by examining morphological parameters (plant growth, leaves and number of petunia flowers as follows:
1. Determine the number of dropped leaves by counting the empty leaf attachments. 2. Determine the number of damaged and undamaged leaves.
3. Measure between nodes length.
4. Determine the number of damaged, new flowers and aborted buttons. 5. Measure the diameter of each flower
The differences in plant growth and other parameters between successive weeks were calculated and are presented. After the exposure period, the aerial part of plants was recuperated and immediately drowned stored for 96 hours at 40 𝑜𝐶.
2.3. Statistical Analysis
Descriptive statistics have been used to describe the morphological parameters evolution from the first date to the last date of plants exposure.
Civil Engineering Journal Vol. 5, No. 6, June, 2019 Kruskal-Wallis analysis of variance (ANOVA) was applied to assess the effects of location. Additional Mann-Whitney test is applied to confirm the difference.
3. Results
3.1. General Overview
In total 11 morphological parameters were taken. Most of plants showed increase in morphological characteristics (Figures 3 and 4) (plant growth determined as internodes length) and flower size (Figure 5). The results of the parameter analyses are presented in Table 2.
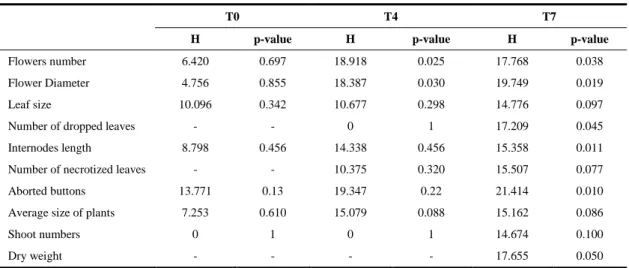
Table 2. Results of Kruskal-Wallis testing effects on station distribution of one week (T0: March 30), four weeks (T4: April 19) and seven weeks (T7: May 11) of exposure
T0 T4 T7
H p-value H p-value H p-value
Flowers number 6.420 0.697 18.918 0.025 17.768 0.038
Flower Diameter 4.756 0.855 18.387 0.030 19.749 0.019
Leaf size 10.096 0.342 10.677 0.298 14.776 0.097
Number of dropped leaves - - 0 1 17.209 0.045
Internodes length 8.798 0.456 14.338 0.456 15.358 0.011
Number of necrotized leaves - - 10.375 0.320 15.507 0.077
Aborted buttons 13.771 0.13 19.347 0.22 21.414 0.010
Average size of plants 7.253 0.610 15.079 0.088 15.162 0.086
Shoot numbers 0 1 0 1 14.674 0.100
Dry weight - - - - 17.655 0.050
In urban areas, PAHs concentrations depends on PM2.5 levels [10, 12, 27]. So, PM2.5 means measures were presented
in Table 3 to do comparison with four morphological parameters of exposed Petunia (plants sizes, total number of flowers, flower diameter, number of necrotized leaves) in different sites.
Table 3. PM2.5 means concentrations and difference between final and initial plants sizes, total number of flowers, flower
diameter, number of necrotized leaves and at different sites for Petunia hybrida. Means and standard deviations (SD) are given
Sites PM2.5 Growth of plants Flower diameter Number of flowers Number of necrosis leaves
Mean SD Mean SD Mean SD Mean SD Mean SD
Control - - 17.67 1 8,33 0,29 11.25 5.67 0.00 0.00 IO 22.97 9.89 13.17 0.57 5.85 2,33 8.83 4.02 2.25 0.71 Id 28.63 10.79 13.50 0.7 7.56 0,30 10.94 6.62 1.42 1.15 Aw 29.09 9.02 11.33 1.15 5.87 1,42 5.63 4.25 1.29 0.58 Dd 32.88 12.02 10.00 6.08 6.30 3,81 3.50 2.32 1.75 2.00 TO 40.21 18.09 15.00 5.13 7.10 0,29 10.75 7.70 2.29 0.58 Vl 21.93 10.24 12.50 0.7 6.63 0,29 4.25 1.89 0.04 0.00 Ir 30.18 7.34 9.33 5.19 7.19 0,69 11.24 5.93 0.63 0.00 SA 25.29 11.48 17.00 2.08 7.09 0,12 5.71 3.77 0.71 0.00 Pr 26.51 10.90 11 1.41 7.18 0,14 11.23 4.24 0.00 0.00
3.2. Comparison with Reference Site
In general, for all stations, the rate growth of plants is low compared to the control. However, we observed a divergent increase between stations (Figure 3) and than a greater increase was observed at Sidi Ahmed station (SA) and at Targa Ouzemmour (TO) stations similarly to the control station (Control). At the end of sampling, these stations present, successively, total average growths of 17, 15 and 17.66 cm.
The station established in Sidi Ahmed (SA) which shows a significant growth in comparison with other study stations, the growth rate value being only 3.73% lower than the control value. Also a fairly large growth in comparison with other study stations is observed at the station Targa Ouzemmour (TO), with a growth rate value equal to 15.66% lower than the control value.
1309
Ouazoug (IO) and Iheddaden (Id), they developed, successively, on average 9.33, 11, 11.33, 12.5, 13.33 and 13.5 cm throughout the 7 weeks of exposure, relatively low values in comparison with our control (17 cm) confirming a disturbed development of our petunias.
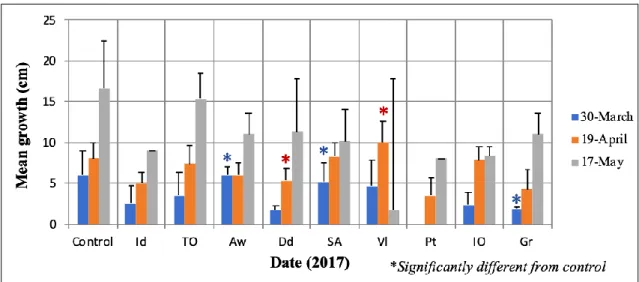
Figure 3. Reports the general growth of Petunia plants
Also, the urban stations of the Port (Pt), Aamriw (Aw), Ville (Vl), Ighil Ouazoug (IO) and Iheddaden (Id), showed a very low growth rate being respectively 37,71%, 35,84%, 29.22% 24.52% and 23.56% lower than the control station.
The statistical tests (Mann-Whitney tests) of the average growth of all our study sites compared to the average growth of the control station at three different times (Figure 4) make it possible, on the one hand, to observe more precisely the heterogeneity of our different average growth values observed with the help of Figure 3 but, on the other hand, to highlight the significant differences in this average growth in the beginning, middle and end of study compared to the control.
Figure 4. Statistical comparison of the average growth plants rates of the different stations with control
After one week of exposure (T0: March 30), only the Aamriw (Aw), Sidi Ahmed (SA) and Gare-routière (Gr) stations have a lower statistical difference in average growth compared to that of the control, while all other sites considered have statistically identical development to the control.
In the middle of the period of exposure around April 19, studied stations of the Daouadji (Dd) and Ville (Vl) were added to the Gare-routière (Gr) station to show significantly lower growth in comparison with the control station.
At the end of the study, after 7 weeks of exposure, it is interesting to note that, firstly, the control station shows the greatest growth at the end of the study with an increase of 17.66% cm and, secondly, that only the station Targa
Ighil Ouazoug (IO), Ihaddaden (Id), Targa Ouzemour (TO), Aamriw (Aw), Daouadji (Dd), Sidi Ahmed (SA), ville (Vl), port (Pt), Gare routière (Gr) et témoin (Tn).
Ighil Ouazoug (IO), Ihaddaden (Id), Targa Ouzemour (TO), Aamriw (Aw), Daouadji (Dd), Sidi Ahmed (SA), ville (Vl), port (Pt), Gare routière (Gr) et témoin (Tn).
Civil Engineering Journal Vol. 5, No. 6, June, 2019 Ouzemmour (TO) has no significant difference in the average growth of plants. All the other stations considered in the study show a significant difference in growth compared to the control.
Another growth parameter indicating the exposure of petunia to PHAs is the number of flowers. The averages calculated over the period study concerning stations of; TO with 10.75 flowers, SA with 11.25 flowers, Id with 10.93 flowers, are all close to the average of the control station which is of the order of 11,23 flowers.
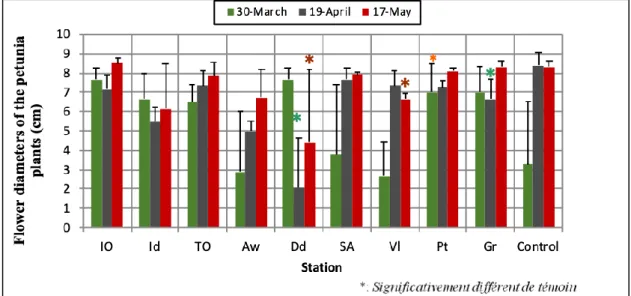
On the other hand, Dd station, which has the lowest average of 3.5 flowers, is 68.88% less flowery than the control. It indicates a significant difference from control. In the same way, Station of, Vl, Pt and Aw shows significant differences from control and they are successively 62.22%, 50.66% and 50.00%, less flowery than the control. The petunia flowers were significantly smaller close to the urban stations than at the control station. Flower diameters of the petunia plants are shown in Figure 5.
Figure 5. Flower diameters of the petunia plants during the experiment period at different stations
3.3. Dry Weights
Dry weights of the petunia plants at harvest at the different sites are shown in Fig. 6. The dry weight of the petunia plants reveals differences between stations. The maximum dry weight was reached at TO and control station with 11.8 ± 0.91 and 12 ± 0, successively. Whereas the minimum mean value of 2.63 ± 1.1 is recorded at Dd station. It shows a significant difference with the control station. Also, stations of VI, Gr and IO, in turn, show significant differences with the control.
Figure 6. Presentation of dry weights means and standard deviations of petunia plants at different stations
Ighil Ouazoug (IO), Ihaddaden (Id), Targa Ouzemour (TO), Aamriw (Aw), Daouadji (Dd), Sidi Ahmed (SA), ville (Vl), port (Pt), Gare routière (Gr) et témoin (Tn).
Ighil Ouazoug (IO), Ihaddaden (Id), Targa Ouzemour (TO), Aamriw (Aw), Daouadji (Dd), Sidi Ahmed (SA), ville (Vl), port (Pt), Gare routière (Gr) et témoin (Tn).
1311 3.4. Foliar Damage
For many decades, plants have been used for monitoring visible injury (primarily leaf necrosis) [25, 27]. Foliar symptoms are rather specific for some pollutants and in many cases the effect intensity can be measured. To highlight this impact on the plant, the number of necrotic leaves was counted each week.
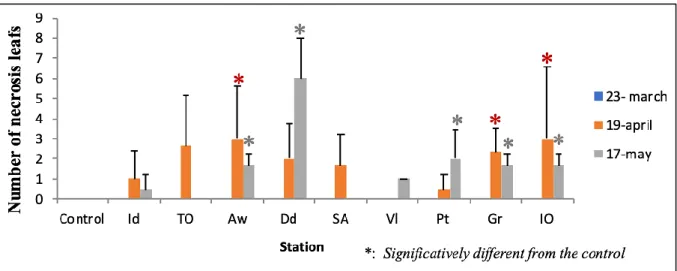
Throughout the eight weeks of exposure, all our stations rarely show leaf necrosis and even more rarely in flowers. However, following the evolution of the average number of necrotic leaves (Figure 7), it can be seen that the majority of stations possess an average of between 0 and 5 necrotic leaves per plant and per station at the end of the experiment.
Figure 7. Statistical comparison of the average number of necrotic leaves of the different stations with control station
It should be noted that the control station is characterized by an average of the lowest necrotic leaves, with 0 necrotic leaves per plant at the end of sampling. The maximum value of 5 leaves per plant at the end of the exposure is recorded at Gr and Dd stations. The statistical differences in the average total number of necrotic leaves for the different stations according to the control are also presented in Figure 7. It can be seen from the diagram that at the beginning of the experiment, no plant has necrotic leaves. In week 4 (April 19), three stations marked averages significantly greater than 0, which is the average of the control station. These stations are Ighil Ouazoug (IO) and Aamriw (Aw) with an average of 3 necrotic leaves each and Bus Station (Gr) with 2.33 average number of necrotic leaves.
Towards the end of the exhibition, only the stations of Targa Ouzemmour (TO) and Sidi Ahmed (SA) are recovered with plants without necrotic leaves. The control station remains the only one that shows no necrotic leaves for the whole period of exposure.
4. Discussion
This study allowed to observe various morphological effects induced on Petunia hybrida in 10 stations across the city of Bejaia with different levels of exposure to pollutants. The most important morphological changes are directly associated with stations closest to road networks (a source of atmospheric emissions in urban areas). It is by moving away from these sources of exposure that the changes observed in this bioindicator become less important as the case of the Targa Ouzemmour (TO) and Sidi Ahmed (SA) stations where the samples are deposited at more than 500 m from the road axis and which are characterized by a car traffic less intense compared to other stations. The analyzes carried out on control station positioned in rural areas (more than thirty km from an industrial exhibition) revealed a larger overall development compared to the other stations.
In the present investigation, measurements confirmed that the stations, having the potentially lowest PAH exposure, show the best morphological development of the Petunias plants in comparison with the most highly exposed sites located on the Daouadji (Dd), Aamriw (Aw), Iheddaden (Id), and City (Vl) stations.
Indeed, several studies [30-33] highlight a significant effect of PAHs and more particularly ethylene on plants by increasing damage leaves, acceleration of flower maturation and decrease in overall growth. The general growth (presented in our study by the dry weight and total growth parameters) as well as the leaf damage detailed in our results attest to a greater and observable impact in areas with a significant road and urban exposure, thus testifying to potentially higher HAPs contamination.
The morphological parameters measured on the petunia are not all significant. The most interesting are the higher stem growth on urban sites. This suggests the hormono-mimetic effects of pollutants, especially via auxin, a plant
Ighil Ouazoug (IO), Ihaddaden (Id), Targa Ouzemour (TO), Aamriw (Aw), Daouadji (Dd), Sidi Ahmed (SA), ville (Vl), port (Pt), Gare routière (Gr) et témoin (Tn).
Civil Engineering Journal Vol. 5, No. 6, June, 2019 hormone involved in stem growth. On the other hand, the petunias exhibited on the Daouadji site present developmental disturbances, notably with high leaf mortality. The results of this study coincide with those found by Benaissa et al., (2018) [23] for particulate matter concentrations, including PM10 and PM2.5 and those made by Alkama et al., (2006)
[34] who found that Daouadji and Aamriw are the most polluted sites in Bejaia.
5. Conclusion
In the absence of automatic air quality monitoring stations in the urban area of Bejaia, the use of Petunia has proven to be a relevant tool for indicating exposure to PAHs. The relevance of the choice of Petunia hybrida as a bioindicator, primarily determined by growth, leaf development and significant flowering coupled with elemental cultivation, proved to be more robust by linking an existing scientific literature establishing susceptibility Petunias faced with exposure levels in PAHs such as ethylene and the physiological responses observed in this study.
No single biological measurement is in itself likely to provide clear evidence of an air quality outcome associated with industrial emissions or transport. In complementary ways, it is necessary to carry out other PAH biomonitoring studies in this region using other bioindicating plants. Bejaia is not the only Algerian city that suffers from automobile air pollution, so this project should be spread to other regions as part of the same PAH bioindication approach using Petunia and other approaches using other plants.
6. Conflicts of Interest
The authors declare no conflict of interest.
7. References
[1] Maliszewska-Kordybach, B. "Sources, concentrations, fate and effects of polycyclic aromatic hydrocarbons (PAHs) in the environment. Part A: PAHs in air." Polish journal of environmental studies 8 (1999): 131-136.
[2] Hayakawa, Kazuichi. “Environmental Behaviors and Toxicities of Polycyclic Aromatic Hydrocarbons and Nitropolycyclic Aromatic Hydrocarbons.” CHEMICAL & PHARMACEUTICAL BULLETIN 64, no. 2 (2016): 83–94. doi:10.1248/cpb.c15-00801.
[3] Hayakawa, Kazuichi, ed. “Polycyclic Aromatic Hydrocarbons” (2018). doi:10.1007/978-981-10-6775-4.
[4] Lawal, Abdulazeez T. “Polycyclic Aromatic Hydrocarbons. A Review.” Edited by Peter Fantke. Cogent Environmental Science 3, no. 1 (July 14, 2017). doi:10.1080/23311843.2017.1339841.
[5] Mu, Ling, Lin Peng, Junji Cao, Qiusheng He, Fan Li, Jianqiang Zhang, Xiaofeng Liu, and Huiling Bai. “Emissions of Polycyclic Aromatic Hydrocarbons from Coking Industries in China.” Particuology 11, no. 1 (February 2013): 86–93. doi:10.1016/j.partic.2012.04.006.
[6] Ravindra, K, R Sokhi, and R Vangrieken. “Atmospheric Polycyclic Aromatic Hydrocarbons: Source Attribution, Emission Factors and Regulation.” Atmospheric Environment 42, no. 13 (April 2008): 2895–2921. doi:10.1016/j.atmosenv.2007.12.010. [7] Nielsen, Torben, Hans E. Jørgensen, John Chr. Larsen, and Morten Poulsen. “City Air Pollution of Polycyclic Aromatic
Hydrocarbons and Other Mutagens: Occurrence, Sources and Health Effects.” Science of The Total Environment 189–190 (October 1996): 41–49. doi:10.1016/0048-9697(96)05189-3.
[8] Allen, Jonathan O., Nameeta M. Dookeran, Kenneth A. Smith, Adel F. Sarofim, Koli Taghizadeh, and Arthur L. Lafleur. “Measurement of Polycyclic Aromatic Hydrocarbons Associated with Size-Segregated Atmospheric Aerosols in Massachusetts.” Environmental Science & Technology 30, no. 3 (January 1996): 1023–1031. doi:10.1021/es950517o.
[9] Rengarajan, Thamaraiselvan, Peramaiyan Rajendran, Natarajan Nandakumar, Boopathy Lokeshkumar, Palaniswami Rajendran, and Ikuo Nishigaki. “Exposure to Polycyclic Aromatic Hydrocarbons with Special Focus on Cancer.” Asian Pacific Journal of Tropical Biomedicine 5, no. 3 (March 2015): 182–189. doi:10.1016/s2221-1691(15)30003-4.
[10] Błaszczyk, Ewa, Wioletta Rogula-Kozłowska, Krzysztof Klejnowski, Izabela Fulara, and Danuta Mielżyńska-Švach. “Polycyclic Aromatic Hydrocarbons Bound to Outdoor and Indoor Airborne Particles (PM2.5) and Their Mutagenicity and Carcinogenicity in Silesian Kindergartens, Poland.” Air Quality, Atmosphere & Health 10, no. 3 (December 24, 2016): 389–400. doi:10.1007/s11869-016-0457-5.
[11] Feretti, Donatella, Roberta Pedrazzani, Elisabetta Ceretti, Mario Dal Grande, Ilaria Zerbini, Gaia Claudia Viviana Viola, Umberto Gelatti, Francesco Donato, and Claudia Zani. “‘Risk Is in the Air’: Polycyclic Aromatic Hydrocarbons, Metals and Mutagenicity of Atmospheric Particulate Matter in a Town of Northern Italy (Respira Study).” Mutation Research/Genetic Toxicology and Environmental Mutagenesis (November 2018). doi:10.1016/j.mrgentox.2018.11.002.
[12] Li, Yunzi, Albert L. Juhasz, Lena Q. Ma, and Xinyi Cui. “Inhalation Bioaccessibility of PAHs in PM2.5: Implications for Risk Assessment and Toxicity Prediction.” Science of The Total Environment 650 (February 2019): 56–64. doi:10.1016/j.scitotenv.2018.08.246.
1313
[13] Cen, Shihong. “Biological Monitoring of Air Pollutants and Its Influence on Human Beings.” The Open Biomedical Engineering Journal 9, no. 1 (August 31, 2015): 219–223. doi:10.2174/1874120701509010219.
[14] Cape, J.N. “Effects of Airborne Volatile Organic Compounds on Plants.” Environmental Pollution 122, no. 1 (March 2003): 145–157. doi:10.1016/s0269-7491(02)00273-7.
[15] Chen-Charpentier, Benito M., and Hristo V. Kojouharov. “Biofilms in Porous Media: Mathematical Modeling and Numerical Simulation.” Environmental Bioremediation Technologies: 481–511. doi:10.1007/978-3-540-34793-4_21.
[16] Pleijel, H., A. Ahlfors, L. Skärby, G. Pihl, G. Selldén, and Å. Sjödin. “Effects of Air Pollutant Emissions from a Rural Motorway on Petunia and Trifolium.” Science of The Total Environment 146–147 (May 1994): 117–123. doi:10.1016/0048-9697(94)90227-5.
[17] Chawla, H.S. “Introduction to Plant Biotechnology” (May 24, 2011). doi:10.1201/9781315275369.
[18] Nouchi, Isamu. “Plants as Bioindicators of Air Pollutants.” Air Pollution and Plant Biotechnology (2002): 41–60. doi:10.1007/978-4-431-68388-9_2.
[19] Niu, Lili, Chao Xu, Yuting Zhou, and Weiping Liu. “Tree Bark as a Biomonitor for Assessing the Atmospheric Pollution and Associated Human Inhalation Exposure Risks of Polycyclic Aromatic Hydrocarbons in Rural China.” Environmental Pollution 246 (March 2019): 398–407. doi:10.1016/j.envpol.2018.12.019.
[20] Parmar, Trishala K., Deepak Rawtani, and Y. K. Agrawal. “Bioindicators: The Natural Indicator of Environmental Pollution.” Frontiers in Life Science 9, no. 2 (April 2, 2016): 110–118. doi:10.1080/21553769.2016.1162753.
[21] Abdel-Shafy, Hussein I., and Mona S.M. Mansour. “A Review on Polycyclic Aromatic Hydrocarbons: Source, Environmental Impact, Effect on Human Health and Remediation.” Egyptian Journal of Petroleum 25, no. 1 (March 2016): 107–123. doi:10.1016/j.ejpe.2015.03.011.
[22] Kalisa, Egide, Stephen Archer, Edward Nagato, Elias Bizuru, Kevin Lee, Ning Tang, Stephen Pointing, Kazuichi Hayakawa, and Donnabella Lacap-Bugler. “Chemical and Biological Components of Urban Aerosols in Africa: Current Status and Knowledge Gaps.” International Journal of Environmental Research and Public Health 16, no. 6 (March 15, 2019): 941. doi:10.3390/ijerph16060941.
[23] Benaissa, Fatima, Cara Nichole Maesano, R. Alkama, and I. Annesi-Maesano. "Analysis of PM concentrations in the urban area of Bejaia." Environment Protection Engineering 44, no. 1 (2018).
[24] Klumpp, Andreas, ed. urban air pollution, bioindication and environmental awareness. Cuvillier Verlag, 2004.
[25] Mandal, Vivekananda, Kavi Bhushan Singh Chouhan, Roshni Tandey, Kamal Kumar Sen, Harneet Kaur Kala, and Rajendra Mehta. “Critical Analysis and Mapping of Research Trends and Impact Assessment of Polyaromatic Hydrocarbon Accumulation in Leaves: Let History Tell the Future.” Environmental Science and Pollution Research 25, no. 23 (June 25, 2018): 22464–22474. doi:10.1007/s11356-018-2578-x.
[26] Izquierdo-Díaz, Miguel, Peter E. Holm, Fernando Barrio-Parra, Eduardo De Miguel, Jonas Duus Stevens Lekfeldt, and Jakob Magid. “Urban Allotment Gardens for the Biomonitoring of Atmospheric Trace Element Pollution.” Journal of Environment Quality 48, no. 2 (2019): 518. doi:10.2134/jeq2018.06.0232.
[27] Li, Yifan, Yujie Wang, Bin Wang, Yunqi Wang, and Weiqing Yu. “The Response of Plant Photosynthesis and Stomatal Conductance to Fine Particulate Matter (PM2.5) Based on Leaf Factors Analyzing.” Journal of Plant Biology 62, no. 2 (April 2019): 120–128. doi:10.1007/s12374-018-0254-9.
[28] Olsen, Andreas, Henrik Lütken, Josefine Nymark Hegelund, and Renate Müller. “Ethylene Resistance in Flowering Ornamental Plants – Improvements and Future Perspectives.” Horticulture Research 2, no. 1 (August 26, 2015). doi:10.1038/hortres.2015.38. [29] Garrec, Jean-Pierre, and Chantal Delzenne-Van Haluwyn. Biosurveillance végétale de la qualité de l'air: concepts, méthodes et
applications. Éditions Tec & Doc, 2002.
[30] Kipopoulou, A.M., E. Manoli, and C. Samara. “Bioconcentration of Polycyclic Aromatic Hydrocarbons in Vegetables Grown in an Industrial Area.” Environmental Pollution 106, no. 3 (September 1999): 369–380. doi:10.1016/s0269-7491(99)00107-4. [31] Abeles, Fred B., and Howard E. Heggestad. “Ethylene: An Urban Air Pollutant.” Journal of the Air Pollution Control Association
23, no. 6 (June 1973): 517–521. doi:10.1080/00022470.1973.10469798.
[32] Underwood, B. A. “Ethylene-Regulated Floral Volatile Synthesis in Petunia Corollas.” Plant Physiology 138, no. 1 (May 1, 2005): 255–266. doi:10.1104/pp.104.051144.
[33] Iqbal, Noushina, Nafees A. Khan, Antonio Ferrante, Alice Trivellini, Alessandra Francini, and M. I. R. Khan. “Ethylene Role in Plant Growth, Development and Senescence: Interaction with Other Phytohormones.” Frontiers in Plant Science 08 (April 4, 2017). doi:10.3389/fpls.2017.00475.
[34] Alkama, R., S. Adjabi, and F. Ait Idir. "Air Pollution in Bejaia City (Algeria): Measurements and Forecasts." Polish Journal of Environmental Studies 18, no. 5 (2009): 769-773.