Determinants of urinary excretion of Tamm-Horsfall protein in non‐selected kidney stone formers and healthy subjects
8
0
0
Texte intégral
(2) Determinants of urinary Tamm–Horsfall protein. molecules with very high negative charge densities and strong affinities for urinary crystals become irreversibly incorporated into these crystals and therefore are part of the stone matrix [6 ]. However, THP, cannot be found within urinary calcium oxalate crystals [7], which indicates that its binding to crystal surfaces is not irreversible. By reversibly staying at crystal surfaces, THP mainly affects the aggregation of preformed crystals [6,8,9]. Much controversy, however, exists about whether THP is an inhibitor or a promoter of crystal aggregation [4]. Previous studies [8,9] have demonstrated that THP at urine-like concentrations is a very powerful inhibitor of calcium oxalate crystal aggregation in vitro. With rising concentrations of calcium, sodium, and hydrogen ions as well as of THP itself, inhibitory activity is progressively lost, and some abnormal THPs from recurrent stone formers even become promoters of aggregation [9]. Because THP at higher concentrations possibly starts to promote crystal aggregation, increases in urinary THP excretion rates might be of pathophysiological relevance in nephrolithiasis. Of particular interest may be that a high-protein diet has been shown to increase urinary THP excretion in rats significantly [10], since high intake of meat protein is a frequently diagnosed risk factor for kidney stone formation [11]. No data, however, are available on effects of increased protein intake on THP excretion in humans. Using quantitative electroimmunodiffusion, Bichler et al. [12] as well as Samuell [13] found that average urinary THP excretion rates in humans were 40–50 mg/day, without differences between normal subjects and calcium renal stone formers. In patients with uric acid stones as well as in those with stag horn calculi or renal tubular acidosis, however, Bichler et al. [12] described significantly lower THP excretion rates. The same was found by Wikstro¨ m and Wieslander [14] in calcium kidney stone formers in comparison with healthy controls. Moreover, as part of tubular dysfunction, these authors described a particularly low THP excretion rate in patients with renal tubular acidosis [14]. More recent studies using radioimmunoassay or ELISA revealed no difference in THP excretion rates between healthy controls and calcium stone formers in two studies [15,16 ], whereas Romero et al. [17] showed a significant decrease of THP excretion in recurrent calcium kidney stone formers. The results of their study, however, were probably hampered by the fact that THP was measured in urine samples previously stored at −20°C. This has been shown to produce wide variations in results, whereas measurements in samples stored at −70°C or in fresh urines produce results with constant reproducibility [18]. The aim of the present study was to measure urinary THP excretion rates prospectively in non-selected kidney stone formers as well as in healthy subjects and to identify possible determinants of THP excretion rates, such as age, gender, renal function, type of stones, urine volume and intakes of protein and other nutrients.. 1581. Subjects and methods Among the patients seen for metabolic work-up at our renal stone clinic, we studied 104 consecutive, non-selected kidney stone formers (SF ), 74 men and 30 women, aged 44.8±1.2 years (range 16–74). They had formed 8.7±2.4 stones (range 1–240); only 12 out of the 104 SF were single stone formers. According to the results of radiological evaluation and stone analysis (not available in all patients), there were 88 calcium stone formers (84.6%, including three with hyperparathyroidism) who had formed 6.7±0.8 stones (range 1–40), eight uric acid stone formers (7.7%) with 36.0±34.0 stones (range 1–240), six infection stone formers (5.8%, struvite and/or carbonate apatite) with 3.8±0.8 stones (range 1–6), and two patients (1.9%) who had formed 30 and 2 cystine stones respectively. Numbers of stones ever formed were not significantly different between calcium and infection SF. However, after exclusion of one patient who had passed 240 gravellike small uric acid stones, the number of stones formed by uric acid stone formers amounted to 2.0±0.7 (range 1–20), significantly less than in calcium stone formers (P=0.009). All SF underwent ambulatory metabolic evaluation while adhering to their free-choice diet [19]. They were never studied until at least 2 months had elapsed after renal colic or urological intervention. Medications known to interfere with calcium, citrate, or uric acid metabolism were discontinued at least 2 weeks before evaluation. Besides the blood and urine samples, which were obtained in the fasting state, two (in five SF ) or three (in 99 SF ) 24-h urine collections were performed by every patient. For comparison, 71 healthy subjects (C ) without family history of kidney stones, 41 men and 30 women, aged 37.0±1.3 years (range 22–62), collected one 24-h urine while on self-selected free-choice diet, whereas no fasting blood and urine samples were obtained. Twenty-four hour urines were collected in 3-l plastic bottles containing 10 g of boric acid as preservative agent [19]; an internal study in collaboration with the Laboratory of Clinical Chemistry at the University of Berne had revealed that concentration measurements of urinary constituents as well as of pH did not differ from those obtained with thymol, a widely used preservative agent [20]. Urine samples were analysed for calcium (Ca), phosphate (P), magnesium (Mg), sodium (Na), potassium ( K ), chloride (Cl ), uric acid ( UA), urea, and creatinine (Crea) by autoanalyser techniques. Urine pH was measured by a Metrohm 654 pH meter (Metrohm, Herisau, Switzerland). Oxalate (Ox) was measured after oxidation by oxalate oxidase, citrate (Cit) using the citrate lyase method, and sulphate (Sulph) by high pressure liquid chromatography, as previously described [19]. In SF only, creatinine clearance (C ) was calculated Crea from 24-h urine creatinine excretion and normalized for 1.73 m2 body surface. Body surface was determined from body length and weight, based on nomograms [21]. In all study subjects, net gastrointestinal absorption of alkali (GI-Alkali, expressed in mEq/day) was derived from excretion rates of non-combustible cations and anions according to the formula (Na+K+Ca+Mg)−(Cl+1.8×P) [22], where electrolyte excretions are in mEq/day except for P which is in mmol/day with an average valence of 1.8 [22]. An estimate of daily calcium intake from dairy products was obtained, using a questionnaire based on dairy products typically consumed in Switzerland and a table of their calcium content [23]. Twenty-four-hour excretion rates of.
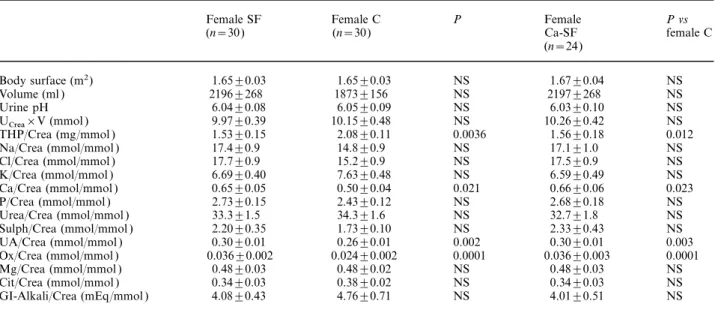
(3) 1582. urea, P and Sulph were taken as urinary markers of protein consumption [19]. Urinary THP was measured by a commercially available indirect non-competitive enzyme linked immunosorbent assay [24] (Synelisa Tamm–Horsfall Protein, Pharmacia & Upjohn/Elias Diagnostics, Freiburg, Germany), whereby monoclonal mouse anti-human-THP antibodies, immobilized on pins, bind THP antigen from standards (0–3.5–8–20–50–120 mg/l in phosphate-buffered saline) and urine samples. These antigen-antibody complexes associate with an enzyme-labelled polyclonal sheep anti-human-THP antibody, which subsequently converts added substrate to form a coloured solution. The colour formation is monitored at 492 nm. All incubations were carried out at room temperature, and measurements were performed in duplicate. Coefficients of variation were 5.0–5.2% for intra-assay variability and 7.8–9.2% for inter-assay variability. All freshly collected 24-h urine specimens were carefully shaken for 2 min at room temperature in order to avoid losing large THP polymers for analysis due to settling. Immediately thereafter, 10-ml aliquots were aspired and diluted 15100 with the denaturing sample buffer supplied with the ELISA kit. These samples were stored in airtight containers at room temperature until ELISA measurements were performed after 20–50 days. Internal pilot studies in collaboration with the manufacturer (unpublished) had revealed that this procedure yielded highly stable and reproducible results even after 200 days of storage. All values are presented as means±SE. Urinary measurements of individual SF are expressed as means of two or three urine collections. For comparisons between groups, the non-parametric Mann–Whitney U-test was used, whereas Wilcoxon signed-rank test was applied for within-group comparisons. Simple and multiple linear regression analyses were performed for correlation studies.. Results The normal range (5th–95th percentile) of urinary THP excretion range, U ×V, was 9.3–35.0 mg/day THP in men and 9.0–36.3 mg/day in women, and mean U ×V was 21.9±1.3 mg/day (range 4.1–38.3) in THP male C and 20.9±1.5 mg/day (range 6.3–41.2) in female C (NS ). In SF, U ×V was 21.3±1.2 mg/day THP (range 3.4–51.6) in males (NS vs male C ) and 15.2±1.6 mg/day (range 1.8–32.3) in females (P= 0.013 vs female C, P=0.008 vs male SF ). Among male SF, daily THP excretion was below the 5th percentile in six (five with calcium and one with uric acid stones) and above the 95th percentile in eight patients (all with calcium stones); among female SF, nine patients exhibited U ×V below the 5th percentile (seven with THP calcium and two with infection stones), but none above the 95th percentile. When comparing the three 24-h collection periods performed in 99 out of 104 SF, U ×V was remarkably constant: it amounted to THP 18.7±1.0 mg/day in the first collection, rose incidentally to 20.6±1.0 mg/day in the second collection (P= 0.008 vs first collection), and was 19.9±1.2 mg/day in the third urine collection (NS vs 1st, P=0.027 vs 2nd collection). Mean values of C were 97.4±2.6 ml/ Crea min./1.73 m2 (range 24.3–144.8) in male and. A. Glauser et al.. 81.3±3.8 ml/min./1.73 m2 (range 36.0–119.3) in female SF. Whereas U ×V was not related to the subjects’ THP age, either in C or in SF, it correlated positively with C , which had been determined in SF only (r= Crea 0.312, P=0.001). Moreover, in the whole study population (SF and C ), U ×V was positively correlated THP with U ×V (r=0.346, P=0.0001) as well as with Crea body surface (r=0.271, P=0.0003). Altogether, these findings suggest that U ×V increases with body size THP and decreases when renal function becomes progressively impaired. Therefore, THP/Crea (mg/mmol ) was used for all further calculations, and every urinary parameter was normalized for urinary creatinine (as a combined marker of renal function and body size). Overall, THP/Crea was lower in SF (1.42±0.07) than in C (1.68±0.08, P=0.015). As apparent from Tables 1 and 2, where 24-h urine data of all male or female SF as well as of male or female calcium SF are compared with respective controls, this difference is primarily due to an increase in THP/Crea among female C, whose value of 2.08±0.11 was significantly higher than in female SF (1.53±0.15, P=0.0036) as well as in male C (1.37±0.08, P=0.0001) and in male SF (1.38±0.09, P=0.0001). This increase in THP/Crea among healthy women is also responsible for the significantly lower THP/Crea values in the subgroup of calcium SF (Ca-SF, 1.46±0.08 vs 1.68±0.08 in C, P=0.041). In comparison with C, THP/Crea was also reduced in the group of seven male and one female uric acid SF (1.11±0.21 vs 1.68±0.08, P=0.049); however, with a value of 1.77, THP/Crea was not diminished in the one particularly active uric acid SF who had passed 240 gravel-like stones. In comparison with male C ( Table 1), male SF exhibited increases in daily urine volumes (2052±91 vs 1635±06 ml in C, P=0.0016), urine Ca/Crea (0.45±0.02 vs 0.30±0.02 in C, P=0.0001), Ox/Crea (0.023±0.001 vs 0.016±0.001 in C, P=0.0001), Na/Crea (13.9±0.4 vs 10.8±0.7 in C, P=0.0002) and Cl/Crea (13.8±0.4 vs 10.5±0.7 in C, P=0.0003). Almost identical differences were observed when male Ca-SF were compared with male C. In female SF ( Table 2), elevated values of Ca/Crea (0.65±0.05 vs 0.50±0.4 in C, P=0.021) and Ox/Crea (0.036±0.002 vs 0.024±0.002 in C, P=0.0001) in comparison with female C were also noted. Identical differences also existed between female Ca-SF and female C. Table 3 summarizes clinical and urinary data of male SF in comparison with female SF. When considering the whole group of SF, activity of stone disease, dairy calcium intake and urinary THP/Crea were not different between male and female SF, whereas urinary stone-forming compounds (Ca, Ox, UA) and chelating agents (Cit, Mg) as well as urinary markers of intakes of protein ( Urea, P, Sulph), salt (Na, Cl ), and alkali ( K, GI-Alkali) were significantly increased in female SF in comparison with their male counterparts. Urine volume was equal in female and male SF; however, when urine volumes were normalized for body size and renal function, i.e. urine creatinine, they were higher.
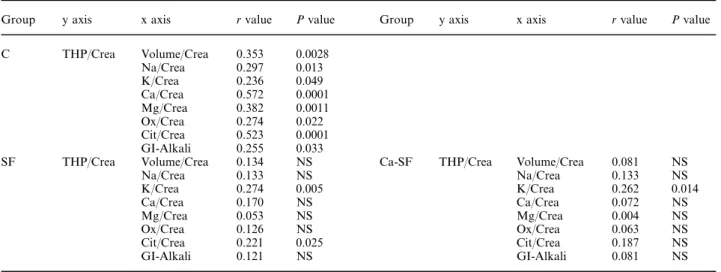
(4) Determinants of urinary Tamm–Horsfall protein. 1583. Table 1. Main 24-h urinary parameters in male C and SF as well as male calcium SF (Ca-SF ). Body surface (m2) Urine volume (ml ) Urine pH U ×V (mmol ) Crea THP/Crea (mg/mmol ) Na/Crea (mmol/mmol ) Cl/Crea (mmol/mmol ) K/Crea (mmol/mmol ) Ca/Crea (mmol/mmol ) P/Crea (mmol/mmol ) Urea/Crea (mmol/mmol ) Sulph/Crea (mmol/mmol ) UA/Crea (mmol/mmol ) Ox/Crea (mmol/mmol ) Mg/Crea (mmol/mmol ) Cit/Crea (mmol/mmol ) GI-Alkali/Crea (mEq/mmol ). Male SF (n=74). Male C (n=41). P. Male Ca-SF (n=64). P vs male C. 1.92±0.02 2052±91 6.01±0.05 15.78±0.35 1.37±0.08 13.9±0.4 13.8±0.4 5.10±0.15 0.45±0.02 2.20±0.53 28.6±0.7 1.50±0.05 0.24±0.01 0.023±0.001 0.34±0.01 0.20±0.01 2.81±0.19. 1.89±0.02 1635±106 6.01±0.07 16.46±0.59 1.38±0.09 10.8±0.7 10.5±0.7 5.11±0.23 0.30±0.02 2.13±0.04 27.0±0.7 1.45±0.04 0.23±0.01 0.016±0.001 0.31±0.01 0.20±0.01 2.60±0.34. NS 0.0016 NS NS NS 0.0002 0.0003 NS 0.0001 NS NS NS NS 0.0001 NS NS NS. 1.91±0.02 1995±81 6.03±0.04 15.91±0.35 1.42±0.08 13.8±0.4 13.7±0.5 5.14±0.16 0.46±0.02 2.23±0.06 28.5±0.5 1.50±0.05 0.24±0.01 0.023±0.001 0.34±0.01 0.20±0.01 2.83±0.34. NS 0.0019 NS NS NS 0.0005 0.0008 NS 0.0001 NS NS NS NS 0.0001 NS NS NS. THP, Tamm–Horsfall protein; Na, sodium; Cl, chloride; K, potassium; Ca, calcium; P, phosphate; Mg, magnesium; Sulph, sulphate; Cit, citrate; GI-Alkali, net gastrointestinal absorption of alkali [22]. See text for further details.. Table 2. Main 24-h urinary parameters in female C and SF as well as female Ca-SF. Body surface (m2) Volume (ml ) Urine pH U ×V (mmol ) Crea THP/Crea (mg/mmol ) Na/Crea (mmol/mmol ) Cl/Crea (mmol/mmol ) K/Crea (mmol/mmol ) Ca/Crea (mmol/mmol ) P/Crea (mmol/mmol ) Urea/Crea (mmol/mmol ) Sulph/Crea (mmol/mmol ) UA/Crea (mmol/mmol ) Ox/Crea (mmol/mmol ) Mg/Crea (mmol/mmol ) Cit/Crea (mmol/mmol ) GI-Alkali/Crea (mEq/mmol ). Female SF (n=30). Female C (n=30). P. Female Ca-SF (n=24). P vs female C. 1.65±0.03 2196±268 6.04±0.08 9.97±0.39 1.53±0.15 17.4±0.9 17.7±0.9 6.69±0.40 0.65±0.05 2.73±0.15 33.3±1.5 2.20±0.35 0.30±0.01 0.036±0.002 0.48±0.03 0.34±0.03 4.08±0.43. 1.65±0.03 1873±156 6.05±0.09 10.15±0.48 2.08±0.11 14.8±0.9 15.2±0.9 7.63±0.48 0.50±0.04 2.43±0.12 34.3±1.6 1.73±0.10 0.26±0.01 0.024±0.002 0.48±0.02 0.38±0.02 4.76±0.71. NS NS NS NS 0.0036 NS NS NS 0.021 NS NS NS 0.002 0.0001 NS NS NS. 1.67±0.04 2197±268 6.03±0.10 10.26±0.42 1.56±0.18 17.1±1.0 17.5±0.9 6.59±0.49 0.66±0.06 2.68±0.18 32.7±1.8 2.33±0.43 0.30±0.01 0.036±0.003 0.48±0.03 0.34±0.03 4.01±0.51. NS NS NS NS 0.012 NS NS NS 0.023 NS NS NS 0.003 0.0001 NS NS NS. See Table 1 for abbreviations and text for further details.. in female than in male SF. Identical differences were observed when comparing male with female Ca-SF. When looking at subgroups of SF ( Table 4), THP/Crea was significantly lower in uric acid SF (1.11±0.21) than in C (1.68±0.08, P=0.049) and tended to be reduced in comparison with Ca-SF (1.46±0.08, P=0.279). The latter also exhibited reduced THP/Crea values (1.46±0.08) in comparison with C (1.68±0.08, P=0.041). No differences were found between calcium and infection SF, either with respect to THP/Crea (1.46±0.08 in Ca-SF vs 1.41±0.23 in infection SF, NS ) or with respect to all other urinary parameters. On the other hand, uric acid SF had a lower urine pH (5.51±0.11 vs 6.02±0.04,. P=0.0016) and consumed more calcium from dairy products (894±66 vs 643±50 mg/day, P=0.052) than Ca-SF, who had probably been advised a low-calcium diet previously by their treating physicians. THP/Crea was not correlated with calcium intake from dairy products or with urinary markers of protein intake or with urine volumes, either in C or in SF. As depicted in Table 5 (top), simple linear regression analysis in C revealed significant correlations of THP/Crea with Na/Crea, K/Crea, Ca/Crea, Mg/Crea, Ox/Crea, Cit/Crea and GI-Alkali/Crea, and multiple regression analysis improved the significance of the correlation of THP/Crea with the combination of these seven factors (r=0.648, P=0.0001); partial F values.
(5) 1584. A. Glauser et al.. Table 3. Clinical and 24-h urine data in male vs female SF ( left) as well as male vs female Ca-SF (right) Stone formers. Stones/years of disease Dairy calcium (mg/day) Urine pH Urine volume (ml ) Urine volume/Crea (ml/mmol ) THP/Crea (mg/mmol ) Na/Crea (mmol/mmol ) Cl/Crea (mmol/mmol ) K/Crea (mmol/mmol ) Ca/Crea (mmol/mmol ) P/Crea (mmol/mmol ) Urea/Crea (mmol/mmol ) Sulph/Crea (mmol/mmol ) UA/Crea (mmol/mmol ) Ox/Crea (mmol/mmol ) Mg/Crea (mmol/mmol ) Cit/Crea (mmol/mmol ) GI-Alkali/Crea (mEq/mmol ). Calcium stone formers. Male (n=74). Female (n=30). P. Male (n=64). Female (n=24). P. 0.9±0.1 673±55 6.01±0.05 2052±91 136.8±8.5 1.37±0.08 13.9±0.4 13.8±0.4 5.10±0.15 0.45±0.02 2.20±0.53 28.6±0.7 1.50±0.05 0.24±0.01 0.023±0.001 0.34±0.01 0.20±0.01 2.81±0.19. 1.0±0.3 583±72 6.04±0.08 2196±268 230.3±29.6 1.53±0.15 17.4±0.9 17.7±0.9 6.69±0.40 0.65±0.05 2.73±0.15 33.3±1.5 2.20±0.35 0.30±0.01 0.036±0.002 0.48±0.03 0.34±0.01 4.08±0.43. NS NS NS NS 0.0001 NS 0.0004 0.0001 0.0003 0.0002 0.0001 0.0038 0.0079 0.0001 0.0001 0.0001 0.0001 0.0041. 0.9±0.1 652±61 6.03±0.04 1995±81 128.8±6.2 1.42±0.08 13.8±0.4 13.7±0.5 5.14±0.16 0.46±0.02 2.23±0.06 28.5±0.5 1.50±0.05 0.24±0.01 0.023±0.001 0.34±0.01 0.20±0.01 2.83±0.34. 1.0±0.3 593±85 6.03±0.10 2197±268 226.4±36.3 1.56±0.18 17.1±1.0 17.5±0.9 6.59±0.49 0.66±0.06 2.68±0.18 32.7±1.8 2.33±0.43 0.30±0.01 0.036±0.003 0.48±0.03 0.34±0.03 4.01±0.51. NS NS NS NS 0.001 NS 0.004 0.001 0.009 0.0009 0.0007 0.018 0.017 0.0001 0.0001 0.0001 0.0001 0.024. Dairy calcium, daily calcium intake from dairy products; for details, see text. See legend to Table 1 for other abbreviations. Table 4. THP/Crea ratios in C and in four subgroups of SF. THP/Crea (mg/mmol ) P vs controls. Controls (n=70). Calcium SF (n=88). Uric acid SF (n=8). Infection SF (n=6). Cystine SF (n=2). 1.68±0.08. 1.46±0.08 0.041. 1.11±0.21 0.049. 1.41±0.23 NS. 1.15/1.39. Table 5. Linear correlations of urinary THP/Crea with various other urinary parameters in C (upper) and SF ( lower left) as well as in Ca-SF ( lower right) Group. y axis. x axis. r value. P value. C. THP/Crea. SF. THP/Crea. Volume/Crea Na/Crea K/Crea Ca/Crea Mg/Crea Ox/Crea Cit/Crea GI-Alkali Volume/Crea Na/Crea K/Crea Ca/Crea Mg/Crea Ox/Crea Cit/Crea GI-Alkali. 0.353 0.297 0.236 0.572 0.382 0.274 0.523 0.255 0.134 0.133 0.274 0.170 0.053 0.126 0.221 0.121. 0.0028 0.013 0.049 0.0001 0.0011 0.022 0.0001 0.033 NS NS 0.005 NS NS NS 0.025 NS. Group. y axis. x axis. r value. P value. Ca-SF. THP/Crea. Volume/Crea Na/Crea K/Crea Ca/Crea Mg/Crea Ox/Crea Cit/Crea GI-Alkali. 0.081 0.133 0.262 0.072 0.004 0.063 0.187 0.081. NS NS 0.014 NS NS NS NS NS. See text for details.. were 11.67 for Ca/Crea, 4.97 for Cit/Crea, 1.76 for K/Crea, 1.41 for Na/Crea, 0.85 for Mg/Crea, 0.81 for GI-Alkali/Crea, and 0.02 for Ox/Crea. On the other hand ( Table 5, bottom left), in SF, THP/Crea only correlated with K/Crea and Cit/Crea. In the subgroup of Ca-SF ( Table 5, bottom right), the only correlation of THP/Crea that remained significant was with. K/Crea, whereas the rather weak correlation with Cit/Crea in the whole group of SF was no longer present in Ca-SF. Figure 1 depicts the significant correlation of THP/Crea with Ca/Crea in C, which is missing in SF. Finally, Table 6 summarizes the determinants of urinary THP excretion in SF and C that emerge from this study..
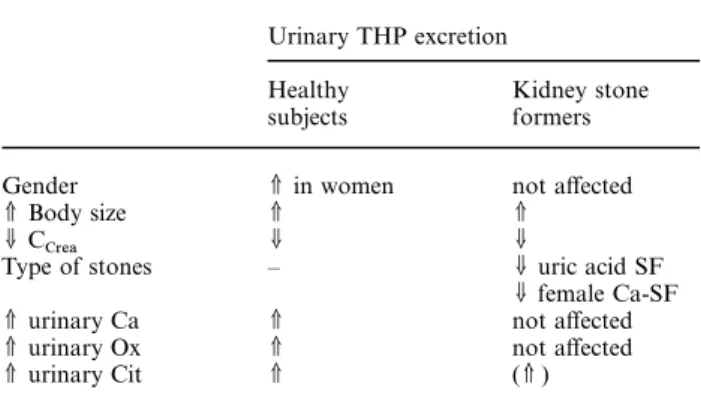
(6) Determinants of urinary Tamm–Horsfall protein. 1585. Fig. 1. Significant linear correlation of urinary THP/Crea with Ca/Crea in C ( left, y=2.091x +0.876, r=0.572, P=0.0001); no such correlation was found in SF (right). Table 6. Summary of main determinants of urinary THP excretion in healthy controls and non-selected kidney stone formers Urinary THP excretion Healthy subjects. Kidney stone formers. Gender V Body size UC Crea Type of stones. V in women V U –. V urinary Ca V urinary Ox V urinary Cit. V V V. not affected V U U uric acid SF U female Ca-SF not affected not affected (V ). Discussion To our knowledge, this study represents the largest series of measurements of urinary THP excretion in kidney stone formers and healthy subjects that has been performed to date. Overall, we demonstrate decreased urinary THP excretion in stone formers; however, subgroup analysis reveals that this is mainly due to the fact that healthy women excrete more THP than female stone formers as well as stone forming and non-stone forming men and that uric acid stone formers exhibit reduced urinary THP excretion. Correlation studies reveal that urinary THP excretion is positively related to body size, renal function, and urinary citrate excretion, whereas it does not appear to be affected by age, urine volume, and daily intakes of dairy calcium or protein. An additional important new finding emerges from the present study, namely that urinary THP positively relates to urinary excretions of the stone-forming ions calcium and oxalate solely in C, but not in SF. The amounts of THP that are being excreted daily by humans in the present as well as in previous studies [12–16 ] vary between about 5 and 600 mg (!),. depending on the assay system used for THP concentration measurements. Although differences in experimental techniques and THP antibodies may explain such huge variations, the state of disaggregation of THP molecules achieved during sample preparation is a main determinant of the number of exposed antibody binding sites [15]. In the present study, measurements in highly diluted urine samples at alkaline pH most probably guaranteed a very high degree of disaggregation of excreted THP molecules, and thus maximum interaction of antibody binding sites with the THP antibody. However, the reduced amount of excreted urinary THP that we and others [12] have measured in uric-acid SF may be, at least partly, due to these patients’ lower urinary pH, which may have induced pronounced self-aggregation of THP molecules in vivo. This could induce flocculation [8,9] and increased adhesion of THP molecules to urothelial cells, thereby lowering the amount of THP that can be measured in urine. In general, available studies do not suggest that urinary THP excretion is different between kidney stone formers and non-stone formers [12,13,15,16 ], except for specific subgroups published in older studies, where urinary THP excretion was found to be reduced in patients with renal tubular acidosis [12,14], uric acid [12], or stag horn stones [12]. In the present comparison of 104 unselected ‘common’ kidney stone patients with 71 healthy controls, urinary THP excretion was reduced in the main sub group of calcium SF (85% of all SF ), as recently also found by others [17]. This was, however, solely because female stone formers excreted significantly less THP than female controls, whereas such a difference was completely absent in men. In addition, urinary THP excretion was reduced in uric acid SF, as previously described by others [12], and possibly due to increased precipitation of THP molecules in vivo at low urine pH (see previous paragraph). Urinary THP excretion, however, did not differ between subgroups of SF with calcium, uric acid, or infection nephrolithiasis..
(7) 1586. We find increased urinary THP/Crea ratios in healthy women in comparison with stone-forming women as well as non-stone-forming and stoneforming men. This is in accordance with Samuell [13], who also demonstrated increased urinary THP/Crea ratios in healthy women in comparison with men. The difference, however, disappeared when values were no more corrected for urinary creatinine [13], as it does in our study, where urinary creatinine is also significantly lower in women than in men. The correction for creatinine, however, is justified, since we clearly demonstrate that daily urinary THP excretion is related to body-size and renal function. In other words, relative to body-size and renal function, healthy women excrete significantly more THP than healthy men and kidney stone-formers of either sex. The pathophysiological relevance of this finding remains to be elucidated. It has been inferred from the work of Schoel and Pfleiderer [25] that the total amount of THP excreted in human urine must be synthesized de novo by the kidneys each day. Because rats fed a high-protein diet excrete more THP [10] and humans with idiopathic calcium nephrolithiasis have increased renal mass when their meat-protein intake is exaggerated [19], enlarged kidneys on high meat-protein intake might produce more THP. Therefore, an important question of the present study was whether THP excretion would be related to urinary markers of protein intake, such as urea, phosphate, and sulphate. Indeed, a rise in urinary excretion of abnormal THPs in certain stone formers with subsequent promotion of crystal aggregation [9] might provide an additional explanation for the wellknown link between high protein intake and nephrolithiasis [11]. Unlike in rats fed a high-protein diet [10], however, THP excretion in humans on free-choice diet in the present study did not correlate with protein intake and therefore does not provide this additional link. On the other hand, as already described by Thornley et al. [15] and confirmed by the present study, urinary THP excretion is positively related to renal function, i.e. C . Crea Another remarkable finding of the present study is the positive correlation of urinary THP excretion with urinary citrate, although of lesser significance in stone formers. This is in keeping with previous work by Fuselier et al. [26 ], who demonstrated for the first time that the increase in urinary citrate following oral potassium citrate therapy in calcium stone formers was correlated with an increase in urinary THP excretion. Since urinary citrate is a well-known marker of alkali consumption and of intracellular acid–base changes in tubular cells [27], increases in intracellular pH values of tubular cells may have additionally increased the state of disaggregation of urinary THP molecules already in vivo, i.e. before sample preparation in the laboratory. By such a mechanism, an additional number of antibody-binding sites may have been exposed to the THP antibody [15] and thus have produced higher THP concentration measurements. Alternatively, increases in intracellular pH values may directly have stimulated de novo synthesis of THP [26 ].. A. Glauser et al.. A new and possibly most relevant finding of the present study is that THP excretion is positively related to urinary excretions of the two most important stoneforming ions, calcium and oxalate, in healthy subjects; previous studies did not find such a correlation [15,28]. On the other hand, this correlation cannot be found in the whole group of kidney stone formers as well as in the large subgroup of calcium SF. Inasmuch as this type of correlation indeed suggests a causal relationship, the exact mechanism whereby THP excretion rises in response to increasing urinary calcium and oxalate, as well as the pathophysiological relevance of the fact that this correlation is missing in stone formers are not known at this stage. However, as demonstrated in animal models of nephrolithiasis, the production of crystallization inhibitors such as uropontin and THP is stimulated after induction of moderate hyperoxaluria, which most probably reflects a self-protective response against stone formation [29]. Inasmuch as THP is an important inhibitor of calcium oxalate crystal aggregation [4,6,8,9], the positive correlation of urinary THP excretion with excretions of calcium and oxalate in healthy subjects might indicate that humans are normally protected from exaggerated crystal aggregation with subsequent stone formation during periods of hypercalciuria and hyperoxaluria. Moreover, the fact that this correlation does not exist in patients with nephrolithiasis would suggest that such a self-protective mechanism could be defective in kidney stone formers. In conclusion, the present study lists determinants of urinary THP excretion in humans ( Table 6): both in healthy subjects as well as in kidney stone formers, urinary THP excretion is related to body size, renal function, and urinary citrate excretion (as a marker of renal intracellular acid–base status), whereas dietary habits (intakes of fluids, dairy calcium, and protein) apparently do not affect THP excretion. Uric acid stone formation as well as calcium stones in women predict reduced THP excretion in comparison with healthy subjects, in whom female gender goes along with increased urinary THP excretion. Finally—and possibly most relevant to kidney stone formation—a rise in THP excretion correlates with increasing urinary calcium and oxalate excretions only in healthy subjects, whereas such a potentially self-protective correlation is missing in kidney stone-formers. Acknowledgements. This study was supported by the Swiss National Science Foundation (Grant No. 32–43448.95). The authors gratefully acknowledge the help of the technicians of the CalciumPhosphate Laboratory (Mrs R. Takkinen, Mrs K. Farina, Mrs L. Zipperle) of the former Policlinic of Medicine, University Hospital of Berne as well as of Pharmacia/Elias Diagnostics, Freiburg/ Germany.. References 1. Kumar S, Muchmore A. Tamm–Horsfall protein—Uromodulin (1950–1990). Kidney Int 1990; 37: 1395–1401 2. Muchmore A, Decker JM. Uromodulin: a unique 85-kilodalton immunosuppressive glycoprotein isolated from urine of pregnant women. Science 1985; 229: 479–481.
(8) Determinants of urinary Tamm–Horsfall protein 3. Hession C, Decker JM, Sherblom A et al. Uromodulin ( Tamm–Horsfall glycoprotein): a renal ligand for lymphokines. Science 1978; 237: 1479–1484 4. Hess B. Tamm–Horsfall glycoprotein and calcium nephrolithiasis. Miner Electrolyte Metab 1994; 20: 393–398 5. Grant AMS, Baker LRI, Neuberger A. Urinary Tamm–Horsfall glycoprotein in certain kidney diseases and its content in renal and bladder calculi. Clin Sci 1973; 44: 377–384 6. Khan SR. Interactions between stone-forming calcific crystals and macromolecules. Urol Int 1997; 59: 59–71 7. Doyle IR, Ryall RL, Marshall VR. Inclusion of proteins into calcium oxalate crystals precipitated from human urine: a highly selective phenomenon. Clin Chem 1991; 37: 1589–1594 8. Scurr DS, Robertson WG. Modifiers of calcium oxalate crystallization found in urine. II. Studies on their mode of action in an artificial urine. J Urol 1986; 136: 128–131 9. Hess B, Zipperle L, Jaeger Ph. Citrate and calcium effects on Tamm–Horsfall glycoprotein as a modifier of calcium oxalate crystal aggregation. Am J Physiol 1993; 265: F784–791 10. Bachmann S, Dawnay AB, Bouby N, Bankir L. Tamm–Horsfall protein excretion during chronic alteration in urinary concentration and protein intake in rats. Renal Physiol Biochem 1991; 14: 236–245 11. Robertson WG. Diet and calcium stones. Miner Electrolyte Metab 1987; 13: 228–234 12. Bichler KH, Kirchner Ch, Ideler V. Uromucoid excretion in normal individuals and stone formers. Br J Urol 1976; 47: 733–738 13. Samuell CT. Uromucoid excretion in normal subjects, calcium stone formers and in patients with chronic renal failure. Urol Res 1979; 7: 5–12 14. Wikstro¨ m B, Wieslander J. Excretion of Tamm–Horsfall urinary glycoprotein (uromucoid ) in renal stone formers. In: Smith LH et al. eds. Urolithiasis, Clinical and Basic Research. Plenum Press, New York, 1981; 685–688 15. Thornley C, Dawnay A, Cattell WR. Human Tamm–Horsfall glycoprotein: urinary and plasma levels in normal subjects and patients with renal disease determined by a fully validated radioimmunoassay. Clin Sci 1985; 68: 529–535 16. Erwin DT, Kok DJ, Alam J et al. Calcium oxalate stone. 1587. 17. 18.. 19.. 20. 21. 22. 23. 24. 25. 26. 27.. 28. 29.. agglomeration reflects stone-forming activity: citrate inhibition depends on macromolecules larger than 30 kilodalton. Am J Kidney Dis 1994; 24: 893–900 Romero MC, Nocera S, Nesse AB. Decreased Tamm–Horsfall protein in lithiasic patients. Clin Biochem 1997; 30: 63–67 Uto I, Ishimatsu T, Hirayama H, Ueda S, Tsuruta J, Kambara T. Determination of urinary Tamm–Horsfall protein by ELISA using a maleimide method for enzyme–antibody conjugation. J Immunol Methods 1991; 138: 87–94 Hess B, Ackermann D, Essig M, Takkinen M, Jaeger Ph. Renal mass and serum calcitriol in male idiopathic calcium renal stone formers: role of protein intake. J Endocrinol Metab 1995; 80: 1916–1921 Hess B. Nierensteine. In Colombo JP, ed. Klinisch-chemische Urindiagnostik. Labolife Verlagsgemeinschaft, Rotkreuz (Switzerland ),1994; 283–294 Wissenschaftliche Tabellen Geigy, 8th edn, Ciba–Geigy, Basle, 1977; 223–224 Oh MS. A new method for estimating G-I absorption of alkali. Kidney Int 1989; 36: 915–917 Souci SW, Fachmanmn W, Kraut H. Food Composition and Nutrition Tables 1986/ 87, 3rd edn. Wissenschaftliche Verlagsgesellschaft, Stuttgart; 1986 Laemmli VK. Cleavage of structural proteins during the assembly of the head of bacteriophage T4. Nature 1970; 256: 495–497 Schoel B, Pfleiderer G. The amount of Tamm–Horsfall protein in the human kidney, related to its daily excretion. J Clin Chem Clin Biochem 1987; 25: 681–682 Fuselier HA, Ward DM, Lindberg JS et al. Urinary Tamm–Horsfall protein increased after potassium citrate therapy in calcium stone formers. Urology 1995; 45: 942–946 Hess B, Michel R, Takkinen R, Ackermann D, Jaeger Ph. Risk factors for low urinary citrate in calcium nephrolithiasis: low vegetable fibre intake and low urine volume to be added to the list. Nephrol Dial Transplant 1994; 9: 642–649 Lynn KL, Shenkin A, Marshall RD. Factors affecting excretion of human urinary Tamm–Horsfall glycoprotein. Clin Sci 1982; 62: 21–26 Khan SR. Tubular cell surface events during nephrolithiasis. Curr Opin Urol 1997; 7: 240–247. Received for publication: 16.8.99 Accepted in revised form: 22.5.00.
(9)
Figure
Documents relatifs
