HAL Id: insu-01302207
https://hal-insu.archives-ouvertes.fr/insu-01302207
Submitted on 13 Apr 2016
HAL is a multi-disciplinary open access
archive for the deposit and dissemination of
sci-entific research documents, whether they are
pub-lished or not. The documents may come from
teaching and research institutions in France or
L’archive ouverte pluridisciplinaire HAL, est
destinée au dépôt et à la diffusion de documents
scientifiques de niveau recherche, publiés ou non,
émanant des établissements d’enseignement et de
recherche français ou étrangers, des laboratoires
valley, Jordan
Y Klinger, J.P. Avouac, L Dorbath, Najib Abou Karaki, N Tisnerat
To cite this version:
Y Klinger, J.P. Avouac, L Dorbath, Najib Abou Karaki, N Tisnerat. Seismic behaviour of the Dead
Sea fault along Araba valley, Jordan. Geophysical Journal International, Oxford University Press
(OUP), 2000, 142 (3), pp.769-782. �10.1046/j.1365-246x.2000.00166.x�. �insu-01302207�
Seismic behaviour of the Dead Sea fault along Araba valley,
Jordan
Y. Klinger,
1,* J. P. Avouac,
2L. Dorbath,
1,3N. Abou Karaki
4and N. Tisnerat
51EOST, UMR CNRS-ULP 7516, 5 rue Rene Descartes, F-67084 Strasbourg, France 2Laboratoire de GeÂophysique, CEA, BP12, F-91680 BruyeÁres le ChaÃtel, France 3IRD, 213 rue Lafayette, F-75480 Paris cedex 10, France
4Department of Geology, University of Jordan, Amman, Jordan
5CFR, CNRS-CEA, Avenue de la Terrasse, F-91198 Gif sur Yvette, France
Accepted 2000 March 13. Received 2000 March 13; in original form 1999 April 6
SUMMARY
The Dead Sea fault zone is a major left-lateral strike-slip fault. South of the Dead Sea basin, the Wadi Araba fault extends over 160 km to the Gulf of Aqaba. The Dead Sea fault zone is known to have produced several relatively large historical earthquakes. However, the historical events are unequally distributed along the fault and only four events have been reported in the Araba valley over the last few thousands of years. Magnitudes estimated from the historical record are probably slightly smaller than that of the Mwy7.3 earthquake that struck the Gulf of Aqaba in 1995. The fault cuts straight across Pleistocene to Holocene alluvium and shows morphologic evidence for essentially pure strike-slip motion. Regional seismic monitoring reveals little micro-seismicity along the fault except around the Dead Sea and Gulf of Aqaba, where the fault splays into complex pull-apart basin fault systems. We have investigated the fault zone at several sites selected from SPOTimages and the study of aerial photography. At the site of the now destroyed Tilah Castle, a well-preserved wall, dated to be about 1200 yr BP (14C age on charcoal), is cut by the fault and offset by 2.2 m. Comparison
with offset gullies at a nearby site 3 km to the north and at three other sites, respectively 25, 50 and 65 km to the south, reveals that this speci®c fault displacement is probably related to the last seismic event that ruptured that fault segment, possibly in AD 1458. Moreover, the offset gullies suggest a characteristic slip behaviour with recurring slip of about 1.5 m on average. Given the 4t2 mm yrx1slip rate derived for this fault
segment, we infer that the fault should produce Mwy7 earthquakes along some segment in the Araba valley about every 200 years. The historical period, with only four well-documented large earthquakes in AD 1068, AD 1212, AD 1293 and AD 1458, thus appears to have been relatively quiescent, with a 20 per cent de®cit of Mwy7 earth-quakes. However, our data do not exclude the possibility of larger Mwy7.6 earthquakes or time clustering of earthquakes over longer timespans. An alternative seismic behaviour involves Mwy 7.6 earthquakes about every 6000 years and Mwy 7 earthquakes about every 250 years. The historical catalogue would then appear to be complete for Mwy7 earthquakes.
Keywords: Dead Sea fault, Jordan, seismicity.
1 I N T R O D U C T I O N
The Dead Sea fault zone is a major left-lateral strike-slip fault (e.g. Garfunkel et al. 1981) that accommodates the relative
motion between Africa and Arabia (Tapponnier 1977; Courtillot et al. 1987; LePichon & Gaulier 1988; Salamon et al. 1996), connecting a region of extension in the Red Sea to the Taurus collision zone to the north (inset in Fig. 1). The fault zone consists of en echelon faults with extensional jogs, with the largest such step-over being the Dead Sea pull-apart basin. Large earthquakes are known to have occurred along this fault zone with recurrent magnitude M 6±7 earthquakes over
* Now at: Seismological Laboratory, Mail stop #100±23, California Institute of Technology, Pasadena, CA 91125, USA. E-mail: yann@gps.caltech.edu
at INIST-CNRS on April 12, 2016
http://gji.oxfordjournals.org/
the historical period (Abou Karaki 1987; Ambraseys et al. 1994). Hereafter, unless Mw is speci®ed, magnitudes M for historical events are derived from intensities and are related to Ms.
The fault segment that extends along the Araba valley south of the Dead Sea (Fig. 2) seems to depart from the rest of the fault zone. This 160-km-long fault zone has produced only a few large-magnitude earthquakes (Fig. 2), in spite of its
Figure 1. Tectonic setting of the Araba valley modi®ed from Garfunkel et al. (1981). DEM image from Hall (1994) with fault interpreted from satellite images and ®eldwork. Important sites are shown in red. Inset shows regional context.
at INIST-CNRS on April 12, 2016
http://gji.oxfordjournals.org/
signi®cant 4t2 mm yrx1slip rate (Klinger 1999; Klinger et al.
2000). This may suggest a particular seismic behaviour possibly with infrequent, very large earthquakes, aseismic creep or time clustering (Ben-Menahem 1991; Ambraseys et al. 1994; Marco et al. 1996). In this paper we discuss the seismic behaviour of this particular fault segment on the basis of ®eld investigations of evidence for fault displacement. We selected sites where the
fault trace is narrow and simple or where the primary fault trace can be clearly de®ned and is assumed to localize most of the deformation.
Below we ®rst give an outline of the tectonic setting and fault characteristics. We review the information available about historical and instrumental seismicity. We then present the results of our survey of anthropic and geomorphic features
Figure 2. Estimated locations of historical earthquakes (Abou Karaki 1987; Ambraseys et al. 1994; Zilberman et al. 1998) and instrumental seismicity between 1900 and 1996 (IPRG 1996).
at INIST-CNRS on April 12, 2016
http://gji.oxfordjournals.org/
offset by the fault that suggest a stick-slip behaviour for the fault. Finally, we discuss these data in the light of the fault characteristics and known historical seismicity.
2 T E C T O N I C S E T T I N G 2.1 Fault morphology
The Araba valley is a 160-km-long depression between the basins of the Dead Sea and the Gulf of Aqaba (Fig. 1). This valley is ¯anked by the mountainous shoulder of the Edom and Negev plateaus to the east and west, respectively. The rift morphology is inherited from Neogene extension (Freund et al. 1968). The bottom of the valley is blanketed by Quaternary alluvium of mostly Pleistocene age. The fault makes a sharp morphological discontinuity that can easily be traced across the alluvium, except where the fault is covered with sand dunes or cuts across very recent alluvial surfaces or playas (Fig. 1). The primary fault is rather straight, striking N20uE, and not very segmented. Such a simple geometry is consistent with essentially pure strike-slip motion (e.g. Garfunkel et al. 1981). In some areas subsidiary faults show evidence of dip-slip motion, however (Fig. 1).
One reason that the fault trace is so evident in the morphology is the presence local small-scale complexities. Small jogs, extensional in the case of left step-overs and com-pressional in the case of right step-overs, tend to create topo-graphic features in spite of the nearly pure strike-slip motion. Moreover, due to minor variations of the fault azimuth, a small component of normal or reverse motion is almost always present. This is especially clear, for example, at El Ghor (see location in Fig. 1). The fault trends locally N13uE, resulting in a slight extensional component of motion expressed by normal faulting either along the main fault or along subsidiary faults. At the south end of this segment at Jebel Risha (see location in Fig. 1), there is a 30±40-m-high push-up. Local compression is due to the right step-over accommodating the 6u westward rotation of the fault azimuth towards the north.
2.2 Slip rate along the Araba fault
Estimates of the slip rate along the Dead Sea fault have been obtained either from geological analysis (e.g. Garfunkel et al. 1981; Ginat et al. 1998) or from regional plate kinematics (Jestin et al. 1994) and vary between 10 and 1 mm yrx1. An
estimate of 4t2 mm yrx1was obtained from the analysis of
offset geomorphic features of Late Pleistocene to Holocene age (Klinger 1999; Klinger et al. 2000) at the El Gohr site and just south of the Tilah Castle site (Fig. 1). This slip rate most probably holds for the whole fault segment along the Araba valley.
3 S E I S M I C I T Y 3.1 Historical seismicity
The Near East is a particularly appropriate place to study historical seismicity. The region is the birthplace of hand-writing and has long been a place of high political and com-mercial importance. Reliable historical documents relating past seismic events and the damage they caused are therefore relatively numerous. A critical appraisal of historical seismicity
is not straightforward, however. One dif®culty is due to the fact that most of the area is arid and hence sparsely inhabited. The historical record of past seismicity might be seriously biased by the uneven and changing distribution of the population. Epicentral locations might, moreover, be signi®cantly biased by site effects. In addition, calendar systems have changed frequently depending on the dominant cultural power, leading to complications in the establishment of an accurate chronology of historical events. Since the beginning of the century, many efforts have been devoted to the establishment of reliable catalogues of historical seismicity (e.g. Willis 1928; Ben-Menahem 1981, 1991; Abou Karaki 1987; Amiran et al. 1994; Ambraseys et al. 1994). In spite of small discrepancies, the three later catalogues generally agree on the dates, locations and sizes of the major historical earthquakes. The largest reported magnitudes along the Dead Sea fault are of the order of 6.5±7.5. A minimum of 10 such earthquakes are reported to have occurred along the 500 km fault segment north of the Dead Sea in the past 2000 years (Abou Karaki 1987; Ben-Menahem 1991). In con-trast, along the 160-km-long Araba fault only a few events are reported during the same time period (Fig. 2). The largest well-documented events occurred in AD 1068, 1212, 1293 and 1458.
The AD 1068 event caused major damage from the Banyas area in northern Israel to Hejaz, and the ancient city of Aila (at the present location of Aqaba and Eilat) was completely destroyed (Ambraseys et al. 1994). Palaeoseismic investigations have recently revealed evidence for a major seismic rupture over more than 12 km starting a few kilometres north of Eilat and dated between 900 and 1000 yr BP (Zilberman et al. 1998). A magnitude of at least 7 was derived from the observed ground deformation and found to be consistent with the damage reported for the 1068 earthquake (Zilberman et al. 1998). The event of AD 1212 was felt as far as Cairo, Egypt, and the towers and houses of the cities all around the Wadi Araba were severely damaged. Moreover, part of the forti®cations and the church of the monastery of St Catherine in Sinai collapsed in this event. The earthquake has been located in the southern Wadi Araba and a magnitude greater than 6.5 was assigned (Abou Karaki 1987; Ambraseys et al. 1994). The event of AD 1293 is located by most authors around the southern tip of the Dead Sea (Abou Karaki 1987; Ambraseys et al. 1994). In fact, it is reported that the three towers of the castle of Karak (a city standing just above the southern basin of the Dead Sea, on the eastern bank) were destroyed, as were most of the houses. Also, much damage has been reported between the Dead Sea and the Gaza strip, on the Mediterranean coast, as a result of the AD 1293 earthquake. A magnitude of about 6.5±7 was assigned to this event and an intensity of more than VII (MSK) is proposed locally (Ambraseys et al. 1994). In AD 1458, another large event is described as having occurred in the southern Dead Sea. Damage was reported both in Karak and in Jerusalem. This event was weakly felt in Cairo, Egypt. As with the previous event, the magnitude assigned was about 6.5±7, with relatively high local intensities (Ambraseys et al. 1994; Abou Karaki 1987).
In addition to these four events, a few other moderate earthquakes may have also occurred in the area of the Gulf of Aqaba, but their locations are not very well established. This is the case for the events of AD 1588 and AD 1839 (Abou Karaki 1987; Ambraseys et al. 1994), which could be related either to the Dead Sea fault zone or to the Red Sea fault zone.
at INIST-CNRS on April 12, 2016
http://gji.oxfordjournals.org/
3.2 Instrumental seismicity
The ®rst seismological station was installed in the region at the beginning of the century. Since the 1980s, regional net-works have been monitoring local seismicity more accurately. Currently, the density of stations is high, even in the Wadi Araba area (IPRG 1996; NRA 1996), providing a detection threshold of about magnitude 2.5 at the 50 per cent con®dence level. Fig. 2 shows the compilation of instrumental seismicity between 1900 and 1996 (IPRG 1996). Most of the seismicity is located close to the fault zone. The surrounding plateaus of the Negev on the western side and the Edom on the eastern side are almost aseismic.
Most events have small magnitudes, generally less than 4.5 (Ml). Only two major events have been recorded along the Dead Sea fault over the instrumental period. One is the magnitude (Mb) 6.25 earthquake that occurred in 1927 at the northern tip of the Dead Sea (e.g. Ben-Menahem et al. 1976; Shapira et al. 1993). The other occurred in 1995 and is the largest known instrumental earthquake along the entire Dead Sea fault zone. This Mw 7.3 earthquake was located 100 km south of Aqaba. Waveform inversion suggests a nearly pure strike-slip mechanism with about 1.6 m of left-lateral slip along an 80 km fault zone striking about N20uE (Klinger et al. 1999). The intense microseismic activity that occurred at the northern tip of the Gulf of Aqaba after the main shock is primarily related to the aftershock activity (Shamir 1996; Rabinowitz & Steinberg 1998).
Fig. 2 also reveals intense microseismic activity near the Dead Sea pull-apart basin. This background seismicity is not related to any particular large seismic event, but is probably related to the presence of the pull-apart zone. A similar seismicity pattern, although less intense, was recorded in the south of the Araba valley, where normal faulting is also more prominent. A more subdued level of background seismicity is observed elsewhere and follows approximately the fault trend. The diffuse zone of sporadic seismicity at a latitude of about 30u30kN does not seem to be related to any obvious tectonic structure according to the available accuracy of the earthquake location. It thus seems that the straight strike-slip fault segments along the Araba valley are particularly quiescent, while seismic activity tends to cluster around subsidiary faults related to extensional jogs.
The observed seismicity departs signi®cantly from seismicity recorded along creeping faults. Indeed, it has been shown that creeping faults in California such as the Hayward fault are characterized by intense microseismicity clustered along the fault trace, with a particularly high proportion of small earth-quakes (Amelung & King 1997). The seismic activity observed along the Wadi Araba fault seems more consistent with classical stick-slip behaviour.
4 O F F S E T W A L L A T T H E T I L A H C A S T L E S I T E
Some 30 km south of the Dead Sea, the fault trace mapped from SPOTimage interpretation (Fig. 1) appears to go through an ancient building. Another fault seems to run further west more or less in the middle of the rift valley (Fig. 1), but this fault is probably a secondary feature since its morphologic expression is much more tenuous (Bowman 1995). We may there-fore assume that most of the strike-slip motion is accommodated on the segment crossing the building.
This building is actually the archaeological remains of the Tilah Castle, which in Arabic is named Qasr El Tilah (Fig. 1). The site consists of a stone courtyard enclosure with probable corner towers, a water tank and an irrigation system. Large quantities of shards were found at this site, suggesting that the castle was built during Roman or Early Byzantine time (Homes-Fredericq & Hennessy 1989; Raikes 1985).
Although the castle itself has been mostly destroyed, the water tank is still well preserved (Figs 3 and 4). Fortunately, this water tank was actually built across the fault trace so that its western wall is cut and offset by the fault (Figs 3 and 4). Given the topographic con®guration of the site, landsliding is very unlikely. In addition, the observed offset is purely strike-slip and left-lateral. Note that this site is not the ®rst example of an archaeological structure affected by faulting along the Dead Sea fault (Marco et al. 1997; Ellenblum et al. 1998).
In order to constrain accurately this offset, we made topo-graphic measurements using a geodetic total station. In spite of the damage caused to the building by faulting and ®ssuring, the western wall is still well preserved (Fig. 4). We measured points
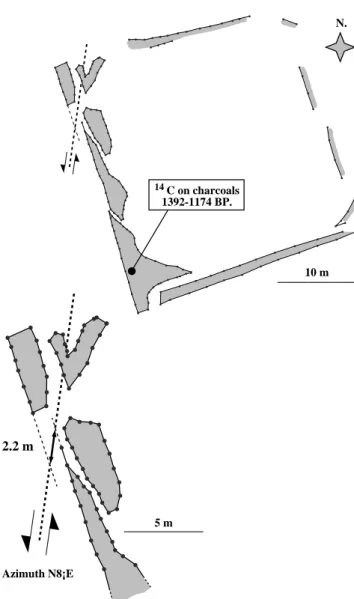
10 m 2.2 m Azimuth N8¡E 5 m 14 C on charcoals 1392-1174 BP. N.
Figure 3. Map of the water tank at the Tilah Castle from a total station survey. Lower diagram shows measurement details of the offset wall.
at INIST-CNRS on April 12, 2016
http://gji.oxfordjournals.org/
following the internal and external edges along the top of the wall and following the major ®ssures (Fig. 3). Accurate measurements show that the corner has been moved by 2.2 m along the fault. Assuming that the wall was initially straight, these measurements show that this 2.2 m of slip on the N8uE-striking fault must have occurred since it was built. Given the irregularity of the wall geometry, we estimate the uncertainty on this measurement to be of the order of 30 cm. Moreover, this measurement might be partially biased by post-offset tilting or rotation of portions of the wall. The ®ssure pattern may suggest an eastward tilt of the central portion of the wall. If the central portion is ignored, extrapolating the southern portion of the wall onto the fault yields a smaller offset of about 1 m. In the ®eld, the offset seems to be about the same at the base as at the top of the wall, and the wide base of the wall may have prevented any signi®cant tilt (Fig. 4). Although we cannot totally exclude such a bias, it is probably smaller than about 50 cm. Possible rotation of the northwestern corner should also be considered. The strike of the edge of this wall portion may actually suggest a small anticlockwise rotation. Such a rotation might bias the estimated offset towards smaller
values, especially if the measurement is made by extrapolating the southern wall portion onto the fault.
In total, we consider that, since the wall was built, the fault must have slipped by at least 1.7 m and possibly as much as 2.7 m for a ®nal slip estimate of 2.2t0.5 m. At this point, we cannot tell whether this offset might be related to one or several coseismic displacements or to continuous creep, although creep is unlikely to be occurring at present based on the lack of abundant microseismicity.
Taking advantage of the damage to the western wall of the water tank, we collected samples of the concrete used to build the wall. Following building practices still in use, ash and small pieces of charcoal were included in the concrete. A piece of charcoal was selected for AMS14C dating and yielded
a date of AD 608±AD 826, after calibration according to Stuiver & Reimer (1993). This is the maximum age corres-ponding to the building of the water tank. This age agrees with the archaeological inference of a Roman to Early Byzantine age (Homes-Fredericq & Hennessy 1989; Raikes 1985).
The two earthquakes reported in the northern part of the Wadi Araba, in AD 1212 and AD 1458 (Ambraseys et al. 1994;
Figure 4. Photo of the offset wall at Tilah Castle. Note person for scale.
at INIST-CNRS on April 12, 2016
http://gji.oxfordjournals.org/
Abou Karaki 1987), apparently post-date the water tank, so that the observed offset may relate to either of the two events, the cumulative effects of those two events, or less probably to many smaller events not reported in historical catalogues. Earthquakes that occurred in AD 1068 and 1212 are not considered as they appear to be located in the southern part of the Wadi Araba, according to the catalogues of historical seismicity. We cannot exclude a portion of aseismic slip either.
5 O F F S E T G E O M O R P H I C F E A T U R E S 5.1 Principle
Some idea of the seismic behaviour of a fault may also be derived from the observation of offset morphologic features (McGill & Sieh 1991; Weldon et al. 1996; McGill & Rubin 1999). The principle is that morphologic features such as gullies, terrace risers or gravel bars that once formed across the fault zone provide a record of fault slip.
The major difference with a man-made feature, such as the offset wall described above, is that age and initial geometry are commonly dif®cult to determine, but geomorphic evidence of fault offset is much more common. In addition, as discussed below, the distribution of offsets can be used to assess the stick-slip behaviour of a fault.
The study area is particularly appropriate for this approach due to its arid environment. The fault cuts across alluvial surfaces with abundant small-scale features such as gullies and gravel bars. Due to the absence of a vegetation cover, this morphology, consisting of cohesionless gravel, silt and sand, is very sensitive to surface processes. The episodic and violent storms that characterize the local climate must therefore have strong morphologic impact, leading to frequent partial reshaping of the morphology across the fault trace.
5.2 Offset gullies at the El Ghor site
The El Ghor site is located about 3 km north of Tilah Castle. At this site the fault cuts across an alluvial pediment at the foot of the eastern rift escarpment (location in Fig. 1). The alluvium is mainly composed of limestone pebbles with some chert and basalt. From a study of satellite imagery combined with ®eldwork, the fault trace could be easily identi®ed and mapped. Some subsidiary faults are visible in the morphology but only show evidence for dip-slip motion; these seem much less active according to their more subdued morphologic expression.
Along the main fault trace we found numerous offset features. Fig. 5 shows a particularly outstanding example that we have constrained from topographic measurements. At this site more than 300 points were measured with the total station along pro®les following the base and the top of the fault scarp and the offset geomorphic features (Fig. 5). The fault trace is marked by a scarp. Several rills and gullies show a complex pattern at the fault trace, providing unambiguous evidence of left-lateral displacement. For example, the head of the southernmost gully, labelled 1 in Fig. 5, was clearly cut by the fault since both the upstream, 1u, and the downstream, 1d, portions abruptly abut against the fault trace (Figs 5 and 6). From the topographic measurements, we estimate that 2.5 m of slip has taken place since this gully was formed across the fault trace. It should also be noted that the gully 1d, downstream of the fault, is much
more incised than its upstream continuation 1u (Fig. 5, pro®les a±ak and b±bk to be compared with c±ck and d±dk). It is opposite to what could be expected from the differential uplift at the fault. In addition, 1d is a major gully compared to the other gullies nearby, while its current upstream continuation is very short. Our interpretation is that the upstream continuation probably developed by headward erosion at a time when 1d was facing it, and that 1d is an abandoned channel that was once fed from a larger gully upstream of the fault. The closest such gully is 2u, which lies about 10 m to the north. We infer that probably 10 m of cumulative slip has accrued since 2u was facing 1d. The 2d channel is still active ephemerally, as indicated from the deposition of recent sediments (Fig. 6). This channel was able to carve a new straight course across the fault and is now ¯owing into channel 2d. In fact, an abandoned channel, 2kd, lying 1.85 m south of 2d, indicates a recent displacement of this order (Fig. 5).
We may thus deduce the following scenario (Fig. 7). At stage (a), the stream was cutting straight across the fault. At stage (b), some time later, the fault had moved left-laterally by about 8.0 m. Channel 1d developed upstream of the fault by headward erosion, and channel 2u was able to cut a new straight channel feeding 2kd. After stage (b), about 2.5 m of additional slip must have taken place. 2u now feeds 2d straight across the fault and alluvium has ponded in 1u.
Given that storms are probably much more frequent than the earthquakes activating this fault segment, and that no stream de¯ection is currently visible, we may conclude that no intermediate position is likely to have existed, except for those deduced from this scenario. Even if we cannot completely discard some climatic processes at the origin of this feature, we favour a stick-slip fault behaviour with two earthquakes, one with about 8.0 m of slip and the other with about 2.5 m of slip. Such a conclusion would assume that the morphology is systematically reshaped after every fault displacement. However, wash on alluvial surfaces varies from one storm episode to another. Moreover, a channel may be able to ¯ow along a diverted course for a while before it is forced to ®nd a new straight course. There is therefore no guaranty that a single example has any signi®cance regarding the fault slip history. We thus carried out systematic measurements of all unambiguous offsets at several sites along the fault trace.
5.3 Systematic measurements of offset gullies at El Ghor, Risha, Butaiyir and Fidan
Measurements of displaced geomorphic features were made at several sites along the northern segment of the Araba fault. We focused on fault segments with a single and well-expressed fault trace. The sites (El Ghor, Risha, Butaiyir and Fidan in Fig. 1) were selected on SPOTimages due to their sharp geo-morphic expressions. At each site, measurements were made systematically over a distance of a few hundred metres to 1 km along the fault. We only considered offsets measured from clearly diverted or abandoned gullies. For example, at the site described above, the offset between 1d and 1u and that between 2d and 2dk are both taken into consideration, but the inferred 10 m cumulative offset is not considered. It must be realized that such a survey may not be totally objective because one may have a tendency to select gullies showing offsets in a given range of values. We paid special attention to that possible bias.
at INIST-CNRS on April 12, 2016
http://gji.oxfordjournals.org/
We also paid attention to another possible artefact, that due to the mean distance between channels (Gaudemer et al. 1989). In our case, the channels are spaced typically at 10±20 m, depend-ing on the site, and this source of artefact can be excluded for offsets of the order of a few metres.
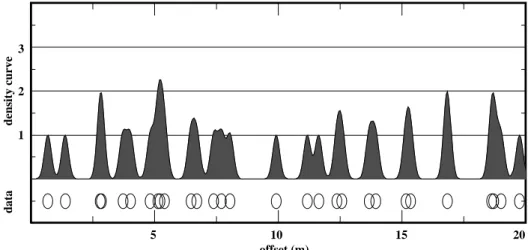
Altogether we measured 14 inferred offsets at the El Ghor site, nine at Fidan, 29 at Butaiyir and 22 at Risha (Fig. 8 and Table 1). Each measurement was obtained by linearly project-ing the trend of the upstream and downstream gullies onto the fault trace, accounting for their mean azimuth. All measure-ments are reported as open circles below the axis in Fig. 8. The data seem to be clustered around speci®c values with a somewhat regular spacing on the order of 2 m.
In order to assess the signi®cance of the observed clustering in view of uncertainties on offset measurements, we have computed density curves accounting for error measurements as proposed by McGill & Sieh (1991) in their study of offset gullies along the Garlock fault. Given the typical size and geometry of the gullies, each measurement was a priori assigned a Gaussian probability law with a variance of 40 cm, account-ing for the accuracy of the operator path. The resultaccount-ing density curves show that the measurements are probably not randomly distributed and might be taken to suggest a stick-slip behaviour with incremental slip events of the order of 1.5±2 m. Additional
tests with variances ranging from 20 to 50 cm have clearly demonstrated that this feature is not an artefact related to the width of the Gaussian law.
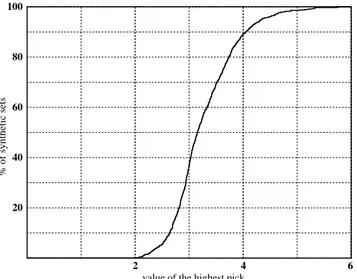
In order to assess more quantitatively the signi®cance of the observed clustering, which results in density peaks with values as high as 4±6, we computed synthetic density curves from a random process. We chose 30 values, with a uniform probability, ranging between 0 and 20 m, similar to the range of offsets measured in the ®eld. Fig. 9 shows one example of such random picking. From this simple experiment, we could see that it is very improbable that the resulting density curve reaches values as high as those obtained from our actual data. We looked at the statistics over 1000 synthetic curves and found that only 1 per cent of the synthetics show peaks higher than 4. We also computed 1000 synthetics from offsets picked only between 0 and 12 m in order to take into account the fact that we have observed a higher proportion of small offsets in the ®eld. In that case, 90 per cent of the synthetics show peaks lower than 4 (Fig. 10). If we now consider only the synthetics with high peaks and regularly spaced clusters of values, there are even fewer examples.
The clustering of the measured offsets is thus probably sig-ni®cant at a high con®dence level, and we interpret this to re¯ect a physical process. Either the fault has a stick-slip behaviour,
Figure 5. Shaded surface topography computed from points surveyed with the total station (red points) at the El Ghor site. The contour interval is 10 cm. The multiple offset channels discussed in the text are located in the centre and on the right of the sketch. The four pro®les are aligned along the main channel (2ux2d), showing the left-lateral offset of the downfaulted area.
at INIST-CNRS on April 12, 2016
http://gji.oxfordjournals.org/
or, if we assume creep, the surface processes generate new gullies ¯owing straight across the fault trace at regular intervals in time. Given the slip rate of the order of 4t2 mm yrx1
(Klinger 1999; Klinger et al. 2000), the observed clustering of offsets would require violent storms about every 300±400 years on average. Such a process seems unlikely, especially con-sidering their periodicity. Our preferred interpretation is that the fault has stick-slip behaviour with coseismic slip of 1.5±2 m every 375±500 years or so.
6 D I S C U S S I O N
Our analysis shows that the Dead Sea fault along the Araba valley probably exhibits stick-slip behaviour, at least along the northern part of the fault segment. Such behaviour is consistent with the relative microseismic quiescence of the fault zone. The analysis of offset gullies suggests that the last incremental slip is of about 1.5±2 m. The 1.7±2.7 m offset of the wall of the water tank at the Tilah Castle site is therefore probably related to this last event. This inference is supported by the similar small offset of 1±2 m deduced from the El Ghor site, about 3 km to the north of Tilah Castle. Given the 1392±1174 yr BP maximum age of this offset, we suggest that it may be related to the AD 1458 event or to the AD 1212 event or to both.
Moreover, the distribution of offsets indicates repeated slip events in the past with about the same 1.5±2 m of coseismic
displacement. A similar `characteristic slip' behaviour was inferred for several strike-slip faults in California (Rubin & Sieh 1997; Lindvall et al. 1989; Sieh 1996, 1984). McGill & Rubin (1999), however, have shown that when such measurements are made along faults with distributed slip, a bimodal distribution of offsets may result from only one event. In our case, measure-ments have always been made far from areas of fault com-plexity, making such an effect unlikely. Characteristic slip does not necessarily imply a `characteristic earthquake' behaviour (Schwartz & Coppersmith 1984) with repeating events with the same slip distribution, since the along-strike extension of the rupture may vary from one event to the next. Nevertheless, the coseismic slip at a given point may be similar (Sieh 1996). If we now refer to the usual scaling laws relating coseismic slip, moment magnitude and fault dimensions (Scholz 1982; Wells & Coppersmith 1994), we infer that 1.5 m of average coseismic slip would be consistent with fault rupture segments of 60±80 km in length and moment magnitudes of the order of Mw 7.2. Such magnitudes are consistent with those assigned to the largest earthquakes reported in historical records for this region. The fault zone of the Araba valley extends for 160 km from the Dead Sea to the Gulf of Aqaba, so that it may consist of two segments capable of producing Mwy7 sized earth-quakes. Given that the slip rate is estimated at 4t2 mm yrx1,
we suggest that the Dead Sea fault along the Araba valley should produce an Mwy7 earthquake about every 200 years
Table 1. Values of the offsets measured at each site in metres. Latitude and longitude for each site are also indicated.
Butaiyir (30.33, 35.27) Fidan (30.62, 35.35) Ghor (30.86, 35.43 Risha (30.25, 35.23)
12.40 1.00 2.25 6.50 3.83 4.70 3.60 7.20 8.87 2.50 3.60 4.10 19.50 0.80 3.30 13.10 4.83 1.40 2.70 6.80 5.45 1.70 3.00 0.76 5.60 1.30 0.30 2.06 5.40 1.60 2.75 1.40 4.30 1.65 0.25 1.30 3.80 0.47 6.14 8.20 6.00 4.63 10.65 3.30 1.60 1.60 1.85 5.44 6.09 2.10 5.75 12.00 1.20 4.30 0.60 1.38 3.42 4.38 3.70 8.30 1.12 3.46 0.90 3.69 2.50 4.80 6.50 3.46 1.80 3.69 5.53 1.40 1.30 5.00 at INIST-CNRS on April 12, 2016 http://gji.oxfordjournals.org/ Downloaded from
on average to break the entire 160 km of the Araba valley. Historical records (Ambraseys et al. 1994; Abou Karaki 1987) indicate only four large events over the past 1000 years, instead of the ®ve needed to accommodate 4t2 mm yrx1. This in turn
might suggest a 20 per cent de®cit of Mwy7 earthquakes along the Araba valley over this period. This de®cit could also be taken to suggest higher-magnitude earthquakes with return periods longer than the historical period.
Activation of the whole 160-km-long fault strand between the Dead Sea and the Gulf of Aqaba would produce a magnitude Mw of about 7.6, much larger than those reported in historical catalogues, and a maximum coseismic slip of the order of 6±7 m (Wells & Coppersmith 1994), signi®cantly larger than most of those documented from our ®eld investigations. On the basis of our observations, we cannot totally rule out the possibility of such earthquakes; the 160 km Araba valley needs
Figure 6. Landform offsets visible in the El Ghor area. Vertical displacement producing the scarp is partially visible in (b).
at INIST-CNRS on April 12, 2016
http://gji.oxfordjournals.org/
two successive Mw 7 sized earthquakes (y80 km of rupture and y1.5 m average displacement) to be ruptured along its length. Considering the 4t2 mm yrx1of slip rate and only four large
earthquakes reported in 1000 years for the whole Araba valley (Ambraseys et al. 1994; Abou Karaki 1987), the remaining motion would be accommodated by an Mwy7.6 earthquake about every 6000 years. Many other possible scenarios, with earthquakes of magnitudes between Mw 7 and Mw 7.6, or even larger, and return periods of the order of a thousand years or so, might also be proposed. Currently the data are too sparse to constrain a speci®c scenario, emphasizing the necessity for further investigations. Time-clustering behaviour of the seismic activity has also been suggested for the Dead Sea area (Marco et al. 1996), based on the succession of seismite layers observed
in cross-sections of the Lisan Formation. However, until now it has proved dif®cult to assess the magnitudes and locations of earthquakes producing such features. It has been shown that events with magnitude Ms about 5.5 could be enough to produce such seismites locally (Allen 1986); this makes it more dif®cult to distinguish between large and moderate earthquakes in the seismite record. Such events are below the threshold magnitude we can retrieve from geomorphic information.
7 C O N C L U S I O N S
In this study we have inferred from the analysis of offset gullies that the Dead Sea fault follows a stick-slip behaviour, with
Figure 7. Cartoon depicting the emplacement of the landforms visible in Figs 5 and 6. At each stage the upper and lower parts of the terraces are displaced and a new stream channel is incised into the lower part of the terrace. Erosional processes also act on abandoned channels by headward erosion and pond formation.
at INIST-CNRS on April 12, 2016
http://gji.oxfordjournals.org/
recurring coseismic slip of the order of 1.5 m. Such coseismic slip is consistent with Mwy7 earthquakes similar to those reported in the historical catalogues. We assume that the Dead Sea fault may follow the characteristic slip model (e.g. Sieh 1996; Rubin & Sieh 1997) and possibly the characteristic
earthquake model. Our data are not inconsistent with other models in which a given fault segment is involved in successive earthquakes with different lengths of fault rupture. This study demonstrates the potential of simple geomorphic investigations to assess fault behaviour.
0
5
10
15
20
0
2
4
6
0
5
10
15
20
0
2
4
6
0
5
10
15
20
0
2
4
6
0
5
10
15
20
0
2
4
6
2.7/2.1 3.9/3.3Butaiyir
Risha
Fidan
1.45/4.15 3.69/5.5 5.45/4.33 1.2/5.03 3.6/2.0 6.03/3.09 1.5/4.56El Ghor
0.3/2.8Figure 8. Density function curve of offset geomorphic features for the four sites. The x-axis is in metres, and each circle represents one measurement. Above the density curve, the value of the offset for the pick and the density corresponding to the top of the pick for each large pick are indicated. 1 2 3 5 10 15 20 offset (m) density curve data
Figure 9. Example of a random synthetic data set and its associated density curve, with values chosen between 0 and 20 m.
at INIST-CNRS on April 12, 2016
http://gji.oxfordjournals.org/
A C K N O W L E D G M E N T S
We thank P. Tapponnier and A. Cisternas for fruitful discussions. J. Seigne was very helpful in ®nding docu-ments about Tilah Castle. Helpful comdocu-ments and reviews by A. Agnon and T. Rockwell greatly improved the quality of this manuscript. The work of NAK is supported by the deanship of scienti®c research of the University of Jordan.
R E F E R E N C E S
Abou Karaki, N., 1987. SyntheÁse et carte sismotectonique des pays de la bordure orientale de la MeÂditerraneÂe: sismicite du systeÁme de failles du Jourdain-Mer Morte, TheÁse, University of Strasbourg, France.
Allen, J.R.L., 1986. Earthquake magnitude-frequency, epicentral distance, and soft-sediment deformation in sedimentary basin, Sed. Geol., 46, 67±75.
Ambraseys, N.N., Melville, C.P. & Adams, R.D., 1994. The Seismicity of Egypt, Arabia and the Red Sea: a Historical Review, Cambridge University Press, Cambridge.
Amelung, F. & King, G., 1997. Earthquake scaling laws for creeping and non-creeping faults, Geophys. Res. Lett., 24, 507±510. Amiran, D.H.K., Arieh, E. & Turcotte, T., 1994. Earthquakes in Israel
and adjacent areas: macroseismic observations since 100 B.C.E., Israel expl. J., 44, 260±305.
Ben-Menahem, A., 1981. Variation of slip and creep along the Levant Rift over the past 4500 years, Tectonophysics, 80, 183±197. Ben-Menahem, A., 1991. Four thousand years of seismicity along the
Dead Sea rift, J. geophys. Res., 96, 20 195±20 216.
Ben-Menahem, A., Nur, A. & Vered, M., 1976. Tectonics, seismicity and structure of the Afro-Eurasian junctionÐthe breaking of an incoherent plate, Phys. Earth planet. Inter., 12, 1±50.
Bowman, D., 1995. Active surface ruptures on the northern Arava fault, the Dead Sea Rift, Israel J. EarthSci., 44, 51±59.
Courtillot, V., Armijo, R. & Tapponnier, P., 1987. The Sinai triple junction revisited, Tectonophysics, 141, 181±190.
Ellenblum, R., Marco, S., Agnon, A., Rockwell, T. & Boas, A., 1998. Crusader castle torn apart by earthquake at dawn, 20 May 1202, Geology, 26, 303±306.
Freund, R., Zak, I. & Garfunkel, Z., 1968. Age and rate of the sinistral movement along the Dead Sea Rift, Nature, 220, 253±255. Garfunkel, Z., Zak, I. & Freund, R., 1981. Active faulting in the Dead
Sea Rift, Tectonophysics, 80, 1±26.
Gaudemer, Y., Tapponnier, P. & Turcotte, D.L., 1989. River offsets across active strike-slip faults, Ann. Tect., III-2, 55±76.
Ginat, H., Enzel, Y. & Avni, Y., 1998. Translocated Plio-Pleistocene drainage systems along the Arava fault of the Dead Sea transform, Tectonophysics, 284, 151±160.
Hall, J.K., 1994. Digital Shaded-Relief Map of Israel and Environs, Survey of Israel, Jerusalem, Israel.
Homes-Fredericq, D. & Hennessy, J.B., 1989. Archeology of Jordan, II 2, Field Reports, Leuven.
IPRG, 1996. Seismological Bulletin of Israel 1900±1996, Institut for Petroleum Research and Geophysics, Holon, Israel.
Jestin, F., Huchon, P. & Gaulier, J.M., 1994. The Somalia plate and the Eastern Africa Rift System: present-day kinematics, Geophys. J. Int., 116, 637±654.
Klinger, Y., 1999. Sismotectonique de la faille du Levant, PhD thesis, University of Strasbourg, France.
Klinger, Y., Rivera, L., Haessler, H. & Maurin, J.C., 1999. Active faulting in the Gulf of Aqaba: New knowledge from the Mw 7.3 earthquake of 22 November 1995, Bull. seism. Soc. Am., 89, 1025±1036.
Klinger, Y., Avouac, J.P., Abou Karaki, N., Dorbath, L., Bourles, D. & Reyss, J.L., 2000. Slip rate on the Dead Sea transform fault in northern Araba valley (Jordan), Geophys. J. Int., 142, 755±768 (this issue).
LePichon, X. & Gaulier, J.M., 1988. The rotation of Arabia and the Levant fault system, Tectonophysics, 153, 271±294.
Lindvall, S.C., Rockwell, T.K. & Hudnut, K.W., 1989. Evidence for prehistoric earthquakes on the Superstition Hills fault from offset geomorphic features, Bull. seism. Soc. Am., 79, 342±361.
Marco, S., Stein, M., Agnon, A. & Ron, H., 1996. Long term earthquake clustering: a 50000 years paleoseismic record in the Dead Sea graben, J. geophys. Res., 101, 6179±6191.
Marco, S., Agnon, A., Ellenblum, R., Eidelman, A., Basson, U. & Boas, A., 1997. 817-year-old walls offset sinistrally 2.1 m by the Dead Sea transform, Israel, J. Geodyn., 24, 11±20.
McGill, S.F. & Rubin, C.M., 1999. Sur®cial slip distribution on the central Emerson fault during the June 28, 1992, Landers earthquake, California, J. geophys. Res., 104, 4811±4833.
McGill, S.F. & Sieh, K., 1991. Sur®cial offsets on the central and eastern Garlock fault associated with prehistoric earthquakes, J. geophys. Res., 96, 21 597±21 621.
NRA, 1996. Earthquakes in Jordan and Adjacent Areas, Natural Resources Authority Bulletin, Amman, Jordan.
Rabinowitz, N. & Steinberg, D.M., 1998. Aftershock decay on three recent strong earthquakes in the Levant, Bull. seism. Soc. Am., 88, 1580±1587.
Raikes, T.D., 1985. The character of Wadi Araba, S.H.A.J., II, Amman.
Rubin, C.M. & Sieh, K., 1997. Long dormancy, low slip rate, and similar slip-per-event for the Emerson fault, eastern California shear zone, J. geophy. Res., 102, 15 319±15 333.
Salamon, A., Hofstetter, A., Garfunkel, Z. & Ron, H., 1996. Seismicity of the eastern Mediterranean region; perspective from the Sinai subplate, Tectonophysics, 263, 293±305.
Scholz, C.H., 1982. Scaling laws for large earthquakes, consequences for physical models, Bul. seism. Soc. Am., 72, 1±14.
Schwartz, D.P. & Coppersmith, K.J., 1984. Fault behavior and characteristic earthquakes: examples from the Wasatch and San Andreas Fault zones, J. geophys. Res., 89, 5681±5698.
Shamir, G., 1996. Mechanics of earthquake rupture in fault step zones: the Mw=7.1 Nuweiba earthquake, Gulf of Elat (Aqaba), November 22, 1995, EOS, Trans. Am. geophys. Un., 77, 501. Shapira, A., Ron, A. & Nur, A., 1993. A, new estimate for the
epicenter of the Jericho earthquake of 11 July 1927, Israel J. Earth Sci., 42, 93±96.
Sieh, K., 1984. Lateral offsets and revised dates of larges prehistoric earthquakes at Pallett Creek, Southern California, J. geophys. Res., 89, 7641±7670. 2 4 6 20 40 60 80 100 % of synthetic sets
value of the highest pick
Figure 10. Statistical distribution of the highest pick for 1000 synthetic sets between 0 and 12 m.
at INIST-CNRS on April 12, 2016
http://gji.oxfordjournals.org/
Sieh, K., 1996. The repetition of large-earthquake ruptures, Proc. Nat. Acad. Sci. USA, 93, 3764±3771.
Stuiver, M. & Reimer, P.J., 1993. Extended 14C data base and revised CALIB 3.0, 14C age calibration program, Radiocarbon, 35, 215±230. Tapponnier, P., 1977. Evolution tectonique du systeÁme alpin en MeÂditerraneÂe, poincËonnement et ecrasement rigide-plastique, Bull. Soc. geol. Fr., 3, 437±460.
Weldon, R.J., McCalpin, J.P. & Rockwell, T., 1996. Paleoseismology in strike-slip tectonic environments, in Paleoseismology, pp. 271±330, ed. McCalpin, J.P., Academic Press, New York.
Wells, D.L. & Coppersmith, K.J., 1994. New empirical relationships among magnitude, rupture length, rupture width, rupture area, and surface displacement, Bull. seism. Soc. Am., 84, 974±1002. Willis, B., 1928. Earthquakes in the Holy Land, Bull. seism. Soc. Am.,
18, 73±105.
Zilberman, E., Amit, R., Porat, N. & Avner, U., 1998. Relocation of the epicenter of the 1068 earthquake in the Avrona playa, southern Dead Sea rift, using paleoseismic and archeoseismic evidence, 26thGeneral Assembly of the European Seismological Commission, Tel-Aviv, Israel (abstract).
at INIST-CNRS on April 12, 2016
http://gji.oxfordjournals.org/