HAL Id: hal-02920086
https://hal.univ-reunion.fr/hal-02920086
Submitted on 24 Aug 2020
HAL is a multi-disciplinary open access
archive for the deposit and dissemination of
sci-entific research documents, whether they are
pub-lished or not. The documents may come from
teaching and research institutions in France or
abroad, or from public or private research centers.
L’archive ouverte pluridisciplinaire HAL, est
destinée au dépôt et à la diffusion de documents
scientifiques de niveau recherche, publiés ou non,
émanant des établissements d’enseignement et de
recherche français ou étrangers, des laboratoires
publics ou privés.
Ocean
P. Mouquet, Cyprien Alexandre, Jaotiana Rasolomamonjy, Rosa Johary,
Thibault Catry, Christophe Révillion, Solofo Rakotondraompiana, Gwenaëlle
Pennober
To cite this version:
P. Mouquet, Cyprien Alexandre, Jaotiana Rasolomamonjy, Rosa Johary, Thibault Catry, et al..
Sentinel-1 and Sentinel-2 Time Series Processing Chains for Cyclone Impact Monitoring in South
West Indian Ocean. International Archives of the Photogrammetry, Remote Sensing and Spatial
In-formation Sciences, Copernicus GmbH (Copernicus Publications), 2020, XLIII-B3-2020, pp.1593-1599.
�10.5194/isprs-archives-XLIII-B3-2020-1593-2020�. �hal-02920086�
SENTINEL-1 AND SENTINEL-2 TIME SERIES PROCESSING CHAINS FOR
CYCLONE IMPACT MONITORING IN SOUTH WEST INDIAN OCEAN
P. Mouquet1, C. Alexandre1, J. Rasolomamonjy2, J. Rosa3, T. Catry4, C. Révillion5, S. Rakotondraompiana3, G. Pennober1, 5 1 UMR 228 Espace-Dev, Institut de Recherche pour le Développement, 40 avenue de Soweto, 97410 Saint-Pierre, Réunion,
France
2 Institut Supérieur de Technologie d'Antananarivo, Rue Dr Rasoamiaramanana Iadiambola, Ampasampito RN 2,
Antananarivo 101, Madagascar
3 Institut et Observatoire de Géophysique d'Antananarivo, Université d’Antananarivo, Antananarivo, Madagascar 4 UMR 228 Espace-Dev, Institut de Recherche pour le Développement, 500 rue Jean-François Breton, 34000 Montpellier,
France
5 UMR 228 Espace-Dev, Université de La Réunion, 40 avenue de Soweto, 97410 Saint-Pierre, Réunion, France
KEY WORDS: Automated change detection, time series, Sentinel satellite, natural disaster, cyclones
ABSTRACT: Monitoring the spatial footprint of cyclone impacts by remote sensing offers great potential for assessing the
extent of damage and monitoring the resilience of the affected territories. For this purpose, as part of the Renovrisk-Impact project, we have developed two change detection processing chains based on optical (Sentinel-2) and SAR (Sentinel-1) data. These chains have been used to track different events in different regions of the world. In this article we focus on two study sites in Madagascar: the city of Miandrivazo, which was heavily affected by severe rainfall from Cyclone AVA in January 2018, and more recently the town of Marovoay which suffered a major disaster following the passage of tropical storm DIANE in January 2020. The obtained results were evaluated and compared with the Copernicus Emergency Mapping Service product, showing good consistency with this product and between them. These results confirm the potential of these Sentinel data and the developed processing chains for monitoring the impacts of cyclones, but also open up prospects for longer-term monitoring.
1. INTRODUCTION
With an average of nine cyclones per year during the last six decades, countries bordering the South West Indian Ocean (SWIO) are particularly exposed to this risk. Multiple long-term climate analysis predicts a stagnation or a slight decrease in the number of tropical cyclones worldwide with a potential increase in their intensity, and a probable displacement towards the poles of their trajectories (Christensen et al., 2013). Even if no significant changes in frequency could be highlighted in this region during this period, future impacts for populations could increase as there is a large global consensus on cyclone intensity predictions (maximum intensity reached for a cyclone, number of cyclones reaching high intensities, frequency of landfalls for high intensity cyclones (Kuleshov et al. 2010)). Climate change will induce even more intense hurricanes and new affected areas. Not only should these severe weather phenomena be better understood, but there is also a necessity to improve the assessment of their impacts. In addition, climate change is modifying multiple types of climate-related hazards in terms of occurrence, intensity and periodicity. It increases the likelihood of compound hazards that comprise simultaneously or sequentially occurring events to cause extreme impacts in natural and human systems (Collins et al., 2020). This calls for reflection on the conditions for observing the impacts of extreme events.
Floods are one of the most common and stronger impacts of hurricanes. Remotely-sensed data such as Sentinel (1 and 2) time series offer unique capabilities for the spatiotemporal assessment of hurricane-related floods and monitoring the resilience of impacted territories. Thanks to their technical specifications (for Sentinel-2: spatial resolution of 10 m, temporal repetitivity of 5 days, global
coverage), their high availability and accessibility, and the complementarity of the sensors, the Sentinel constellation represents a powerful tool for the long-term assessment of natural hazard consequences all over the world.
In this study, we developed two complementary automated processing chains respectively based on Sentinel-1 (S1) and Sentinel-2 (S2) time series in the frame of the INTERREG Renovrisk- Impact project dedicated to the continuous monitoring of hurricane impacts in the SWIO, and the assessment of the associated economic consequences. Given the large amount of available Sentinel data to be processed, covering a wide extent of potentially impacted areas with a high repetitivity, the automation of data processing was a necessary step for the production of weekly up to date flood maps.
2. PROCESSING CHAIN AND STUDY AREA 2.1 Processing chain
The first processing chain (Sen1Chain) integrates S1 time series in a change detection approach based on the Normalized Difference Ratio (NDR) for the mapping of floods. The operation and the results obtained with this processing chain have recently been published (Alexandre et al., 2020). In brief, the tool allows users to download and clip S1 images on S2 tiles or study area footprints, perform multi-temporal filtering, and threshold NDR images to produce a mask of flooded areas. Applied on two different study zones in Mozambique and The Bahamas subject to cyclones, this chain has proven to be reliable and simple to implement. With the rapid mapping product of EMS Copernicus (Emergency Management Service) as reference, the method confers up to 95% accuracy and a Kappa value of 0.75. Improvements are still being actively made in the processing chain, for example with a new
multitemporal filter (Lee vs Quegan) and new statistical analysis tools for long time series (maximum flood extent, cumulative number of days flooded). This chain is implemented in Python, and based on freely available tools (peps download, S1Tiling, OrfeoToolBox (OTB) from CNES and SNAP from ESA)1 for preprocessing
operations.
The second processing chain (Sen2Change) uses S2 time series images as input and is based on a 3D Change Vector Analysis (CVA) for the mapping of hurricane-related impacts. Complementary to the S1 chain for flood detection, this change-vector approach applied to high spatial resolution satellite imagery has shown its interest in monitoring land-cover and land-use changes (Varshney et al., 2012; Hussain et al., 2013). Compared to more conventional processing techniques like classification comparisons, this method does not accumulate segmentation or classification errors.
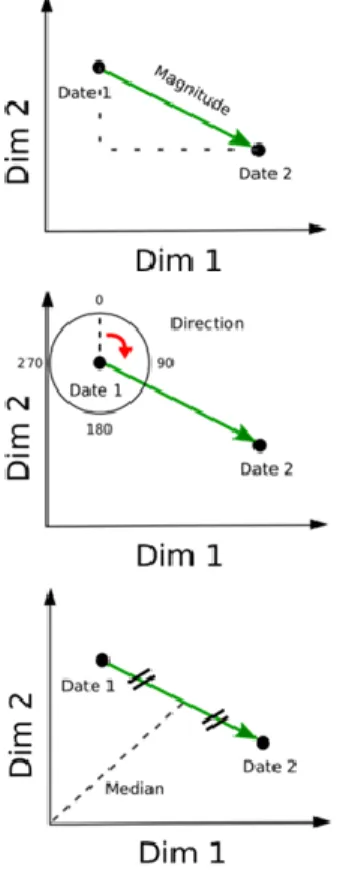
While the CVA is typically based on two dimensions (Malila, 1980), we computed CVA from the 3 indices NDVI, NDWI (Gao, 1996) and the brightness index thanks to the characteristics of S2 images. The use of these indices allows us to observe a wide range of phenomena related to changes in vegetation, water and bare soil or urban areas.
Figure 1. CVA principle scheme.
The resulting vectors are characterized by (i) their length (magnitude of change); (ii) their direction (the nature of change); (iii) their median to discriminate parallel vectors in the three dimensional space (Figure 1). They are then classified by euclidean distance with a training data set
1https://github.com/olivierhagolle/peps_download
https://github.com/CNES/S1Tiling https://www.orfeo-toolbox.org/ https://step.esa.int/main/toolboxes/snap/
built by photo interpretation. Each classified vector is thresholded according to its magnitude, highlighting only the significant impacts.
The final result is a land cover change map with nine main change classes among which we can find changes from vegetation to bare soil or from bare soil to water etc. For a better comparison between processing chains, we focused this study on flooded areas, and change categories not related to floods are gathered in the single class “Other changes” (Figure 4 and 6).
Input indices were produced using the free open source processing chain Sen2Chain2, which allows the
downloading, preprocessing and the production and extraction of various indices from S2 time series (Figure 2).
Figure 2. General architecture and data flow between Sen2Chain and Sen2Change.
2.2 Study area
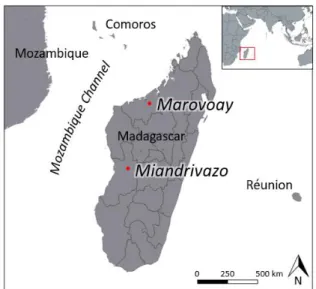
Sen1Chain and Sen2Change have successfully been tested to assess recent cyclone impacts in various sites around the world. After very convincing results obtained on cyclones DORIAN (Bahamas) and IDAI (Mozambique) with Sen1Chain and S1 data (Alexandre et al., 2020), we focused here on two events that took place in Madagascar. The first study site is located around the city of Miandrivazo, chief town of his district, following the passage of cyclone AVA in January 2018. The second study site is located in the Marovoay District south of Mahajanga which was strongly impacted by rainfall during the passage of the Severe Tropical Storm DIANE in January 2020 (figure 3).
Figure 3. Location map of the 2 study sites in Madagascar, Miandrivazo and Marovoay.
2.2.1 Miandrivazo. Cyclone AVA hit Madagascar
severely in January 2018 with sustained winds of more than 150 km/h gusting up to 190 km/h. Coming from the northeast of the island, the cyclone made landfall near the city of Toamasina on the east coast on January 5. Overall, the cyclone caused heavy rainfall throughout the central part of the country and particularly in the studied region. Heavy rains in the Miandrivazo region caused a dike to break in the north of the city, leading to an extensive flooding of the Mahajilo river on the rural periphery. The cyclone killed 51 people and caused more than 50,000 homeless throughout Madagascar, the eastern part of the country being particularly affected.
2.2.2 Marovoay. Strong tropical storm DIANE hit the
northwest of Madagascar around January 20, 2020. Although the winds remained fairly moderate, the torrential rains caused impressive flooding over a vast area, particularly along the Betsiboka River. The multiple floods following the passage of Diane caused more than 35 deaths and 160,000 people were affected.
To highlight the significant impacts of this disaster, we focused on Marovoay, a municipality south of Mahajanga, because of its great agricultural importance. It is one of the rice granaries of the country and the food security depends in part on maintaining the productivity of these agricultural areas.
2.3 Data
Our methodology is based on a diachronic analysis of one image before and one image after the event.
For the two S2 images, they have to be chosen according to three main criteria to ensure the best quality of the results. Reference image has to be as close as possible before the event to prevent changes possibly occurring during this time laps not directly linked to it. Both images
have to contain very few clouds (as their masking effect is cumulative), which could be difficult to obtain for the post-cyclone image as it needs to be very close after the event, during a period often very cloudy.
S1 images are less constraining. We have chosen the dates closest to the optical images in order to be able to compare them as much as possible with each other.
Table 1. Sentinel-1 and 2 images used for change detection. Reference Post-event Miandrivazo S1 2017-12-12 2017-01-18 S2 2017-12-25 2018-01-09 2018-01-19 Marovoay S1 2019-12-02 2020-01-31 S2 2019-12-05 2020-02-03
Copernicus, thanks to the EMS Rapid Mapping program, is able to produce flood maps of major meteorological events. When SAR images are exploited, the used methodology is mainly based on photo-interpretation and thresholding. In the studied zones where the waterways are in perpetual evolution and the water areas often semi-permanent, these emergency products, focusing on post-event water covered areas are in many places just an inventory of water areas without considering temporality / seasonality, leading to local possible over-detection (confusions between rice fields and floods for example).
Urban areas, roads and waterways are directly extracted from OpenStreetMap data, whose boundaries may not always be up-to-date and are sometimes imprecise, but give a good idea of the general organization of the area.
3. RESULTS 3.1 Miandrivazo
On Miandrivazo study site, the two processing chains were applied on several S1 and S2 images to follow the maximum flood extent and the subsequent progressive recession (Figure 4).
The obtained results are a good illustration of the sequence of events that happened on the field. The first post-event S2 image of January 9th is just a few days after the cyclone hit, revealing the flood extent near its maximum (figure 4, B and D). The failure of the Mahajilo dam flooded almost all agricultural areas south of the river, leaving the main urban area on higher grounds relatively unaffected, while the lower neighborhoods closest to the agricultural areas were partially affected.
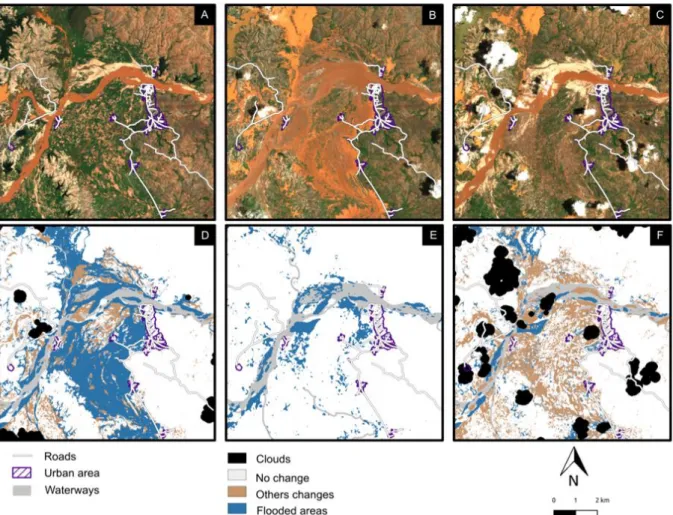
Figure 4. AVA cyclone impacts in Miandrivazo region in January 2018. Sentinel-2 imagery from (A) 2017/12/25, (B) 2018/01/09, (C) 2018/01/19; (D) CVA results from 2018/01/09; (E) NDR result from 2018/01/17; (F) CVA result from
2018/01/19 (© OSM contributors, © Copernicus data (2017-2018)).
Analysis of the S1 RADAR image of 2018/01/17 (figure 4E) shows that most of the areas flooded during the event were no longer flooded ten days later. Some areas close to the river, and in the lower parts of the agricultural plains remain under water after this period.
Similarly, the CVA analysis of the Sentinel-2 image of the following day 2018/01/19 (figure 4, C and F) shows the same pattern, with agricultural areas to the South and East of the city being durably affected. This CVA analysis, giving more details than the NDR, shows that most of the vegetated areas in this sector have been uprooted, replaced by bare soil, more or less moist.
Cross-comparison of the results from the two change detection methods on the images of the same period allows further refinement of the analysis (Figure 5). The areas detected jointly by the two methods are located around the main river bed and are still under water 10 days after the cyclone, durably modified by the flooding of the river. There are relatively more water areas detected on the S1 image than on the S2. This phenomenon can have several explanations, like a rapid change in the water level between images, or misinterpretation of very humid low reflectivity and fast moving sandbanks in the riverbed or mudslides in the agricultural areas on S1 imagery. Additional flooding zones detected on S2 image mainly correspond to small areas that could be difficult to detect with S1 image, because of the spatial filter used to reduce
speckle on this kind of SAR data. This last point tends to be confirmed by the calculation of the total flooded area (Table 2), which is larger on the S2 image, even if it has been acquired two days after S1.
Figure 5. Comparison between 2 CVA, Sentinel-1 NDR and Copernicus products (© OSM contributors).
Table 2. Evolution of the flooded areas in the region of Miandrivazo (within a 100 km² square reference).
Figure D E F G Method CVA flooded NDR flooded CVA flooded Common (E and F) Date after 2018-01-09 2018-01-17 2018-01-19 E and F Flooded area 24.6 km² 5.7 km² 7.14 km² 2.1 km² 3.2 Marovoay
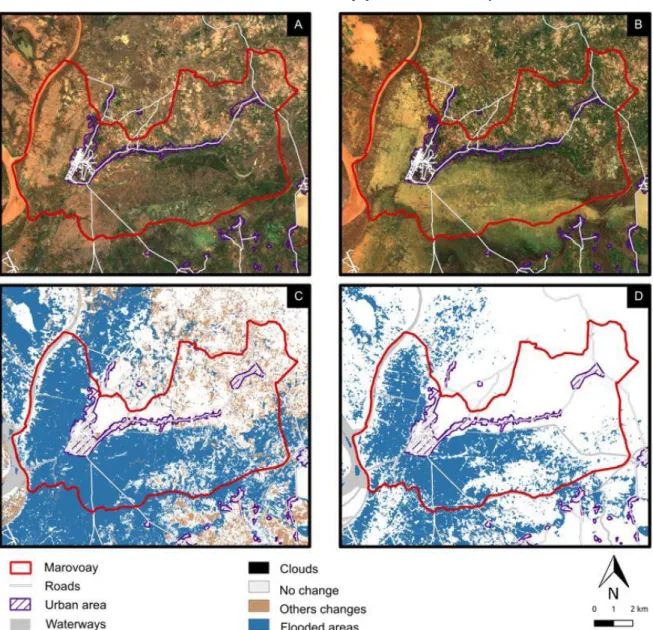
Flooding was particularly severe in the municipality of Marovoay following the passage of storm DIANE, which brought heavy rain for almost a week. 10 days after the event more than 40% of the area is still under water (figure 6, C and table 3). These floods concern a large part of the southern and western areas of the municipality, mainly rice plains but also residential areas on the periphery of the urban area. The NDR carried out on the S1 data acquired a few days before the S2 data gives similar trends (Figure 6, D). The result of these analyses is consistent with field observations, the disaster is such that humanitarian and state aid has been mobilized to assist the local population3.
The slow retreat of the waters may also be due to the ageing hydro-agricultural infrastructures (dykes, locks), whose maintenance and renewal is difficult for the local population to afford (Droy, 1997).
Figure 6. DIANE storm impacts in Marovoay municipality in January 2020. Sentinel-2 imagery from (A) 2019/12/05 (B) 2020/02/03; (C) CVA results from 2020/02/03; (D) NDR result from 2020/01/31 (© OSM contributors, © Copernicus data
(2019-2020)).
3
http://www.midi- madagasikara.mg/societe/2020/01/30/inondation-a-marovoay-lassociation-fitia-vient-en-aide-aux-sinistres/
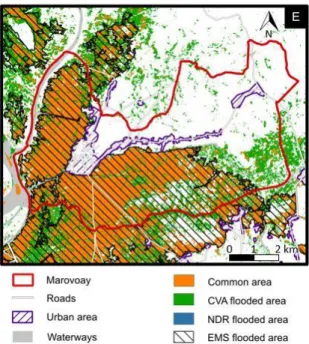
Figure 7. Comparison between 2 CVA, Sentinel-1 NDR and Copernicus products (© OSM contributors,
Copernicus Emergency Management Service (© 2020 European Union)).
Table 3. Evolution of the flooded areas in the municipality of Marovay (93 km²). Figure C D E E Method CVA flooded NDR flooded Common EMS Date after 2020-02-03 2020-01-31 C and D 2020-01-31 Flooded area 44 km² 30 km² 29 km² 43 km²
The comparison of the CVA, NDR and Copernicus EMS results show a good overall spatial agreement along the northwest riverbanks and the south rice fields. The CVA seems to be more sensitive and allows the detection of complementary small size flooded agricultural areas. As for Miandrivazo, the spatial resolution and filtering processes of the analysis again explains the difference in results between the different techniques.
4. DISCUSSION
Our results in Miandrivazo and Marovoay showed that the two developed chains Sen1Chain and Sen2Change, made it possible to detect and precisely map the flooded areas in a post-cyclonic context. Results are in good agreement with other recognized mapping sources (EMS Copernicus), and locally even more efficient thanks to the use of reference data, recent and coherent with the processed data. The consistency of the detected flooded areas between both processing chains makes them complementary, allowing to envisage a temporal monitoring of events, from the short term maximum impact of the cyclone to the complete resilience of the area over a longer period.
Using S1 and S2 images, covering all of the planet's land and coastal surfaces, with a wide swath and at high temporal frequency, seems to be perfectly suitable to monitor events like cyclones occurring regularly and over extended areas. The CVA technique on S2 images was successfully applied to several study sites worldwide and is quite insensitive to local reflectance variations as it enhances and detects large changes in land cover. Its very good performance is however to be put in perspective with its high sensitivity to clouds, unlike NDR on SAR images. In tropical zones, where most cyclones occur, the cloudiness can be very important at certain times of the year or just after these events, our approach coupling multiple sensors / multiple processing chains therefore shows here all its interest.
This detection of flooded areas is not necessarily bound to cyclonic contexts, and these results on water zones and their variations, could be used over longer periods for seasonal, annual or multi-annual hydrological wetland or flooded areas monitoring.
5. CONCLUSION
In this paper we have therefore shown a good complementarity between the two detection techniques on S1 and S2. This makes it possible to monitor the extent of floods and their evolution over time very accurately. In addition, a finer monitoring of areas impacted by floods is possible thanks to CVA when S2 images without too many clouds are available. The persistence or not of cloudiness after a rainy event determines the respective contribution of the sensors. It allows the categorization of impacts by observing the evolution of land use over time.
In the frame of Renovrisk-Impact project, the products of these chains will be used as input data for economic models in order to evaluate the cyclonic impacts and the resilience of the study areas in the South-West Indian Ocean (SWIO).
Both processing chains Sen1Chain and Sen2Change are still under active development and code optimization in order to improve algorithms and processing speeds. These two processing chains use and are under open source licenses, and will be freely released on git platforms before the end of the project.
ACKNOWLEDGEMENTS
Thanks to the European Regional Development Fund (ERDF) and Institute for Research and Development (IRD) for funding the Renovrisk-Impact project.
Thanks to Didier Bouche from the IT services department of the Université de La Réunion for the deployment and maintenance of the storage and computing servers.
REFERENCES
Alexandre C., Johary R., Catry T., Mouquet P., Révillion C., Rakotondraompiana S., Pennober G. (2020). A Sentinel-1 Based Processing Chain for Detection of Cyclonic Flood Impacts. Remote Sensing, 12(2), 252.
Christensen, J. H., Kanikicharla, K. K., Aldrian, E., An, S. I., Cavalcanti, I. F. A., De Castro, M., ... & Kitoh, A. (2013). Climate phenomena and their relevance for future regional climate change. In Climate Change 2013 the Physical Science Basis: Working Group I Contribution to the Fifth Assessment Report of the Intergovernmental Panel on Climate Change (pp. 1217-1308). Cambridge University Press.
Collins M., M. Sutherland, L. Bouwer, S.-M. Cheong, T. Frölicher, H. Jacot Des Combes, M. Koll Roxy, I. Losada, K. McInnes, B. Ratter, E. Rivera-Arriaga, R.D. Susanto, D. Swingedouw, and L. Tibig, (2019). Extremes, Abrupt Changes and Managing Risk. In: IPCC Special Report on the Ocean and Cryosphere in a Changing Climate [H.-O. Pörtner, D.C. Roberts, V. Masson-Delmotte, P. Zhai, M. Tignor, E. Poloczanska, K. Mintenbeck, A. Alegría, M. Nicolai, A. Okem, J. Petzold, B. Rama, N.M. Weyer (eds.)].
Droy, I. (1997). Que sont les greniers à riz devenus?. Economie de Madagascar, (2), 63-88.
Gao, B. C. (1996). NDWI—A normalized difference water index for remote sensing of vegetation liquid water from space. Remote sensing of environment, 58(3), 257-266.
Hussain, M., Chen, D., Cheng, A., Wei, H., & Stanley, D. (2013). Change detection from remotely sensed images: From pixel-based to object-based approaches. ISPRS Journal of photogrammetry and remote sensing, 80, 91-106.
Kuleshov Y., Fawcett R., Qi L., Trewin B., Jones D., McBride J., Ramsay H. (2010). Trends in tropical cyclones in the South Indian Ocean and the South Pacific Ocean. Journal of Geophysical Research: Atmospheres, 115.D1. Malila, W.A., 1980. Change Vector Analysis: An Approach for Detecting Forest Changes with Landsat. LARS Symposia, 12.
Varshney, A., Arora, M. K., Ghosh, J. K. (2012). Median change vector analysis algorithm for land-use land-cover change detection from remote-sensing data. Remote sensing letters, 3(7), 605-614.