Publisher’s version / Version de l'éditeur:
Vous avez des questions? Nous pouvons vous aider. Pour communiquer directement avec un auteur, consultez la première page de la revue dans laquelle son article a été publié afin de trouver ses coordonnées. Si vous n’arrivez pas à les repérer, communiquez avec nous à [email protected].
Questions? Contact the NRC Publications Archive team at
[email protected]. If you wish to email the authors directly, please see the first page of the publication for their contact information.
https://publications-cnrc.canada.ca/fra/droits
L’accès à ce site Web et l’utilisation de son contenu sont assujettis aux conditions présentées dans le site LISEZ CES CONDITIONS ATTENTIVEMENT AVANT D’UTILISER CE SITE WEB.
Proceedings of the Joint NSC-NRC Workshop on Construction Technologies: 26
April 2004, Taipei, Taiwan, pp. 127-138, 2004-04-01
READ THESE TERMS AND CONDITIONS CAREFULLY BEFORE USING THIS WEBSITE.
https://nrc-publications.canada.ca/eng/copyright
NRC Publications Archive Record / Notice des Archives des publications du CNRC :
https://nrc-publications.canada.ca/eng/view/object/?id=5cad07d6-940f-4e9e-9792-659dbb8654cd https://publications-cnrc.canada.ca/fra/voir/objet/?id=5cad07d6-940f-4e9e-9792-659dbb8654cd
NRC Publications Archive
Archives des publications du CNRC
This publication could be one of several versions: author’s original, accepted manuscript or the publisher’s version. / La version de cette publication peut être l’une des suivantes : la version prépublication de l’auteur, la version acceptée du manuscrit ou la version de l’éditeur.
Access and use of this website and the material on it are subject to the Terms and Conditions set forth at
Sound insulation issues
Sound insulation issues
Bradley, J.S.
NRCC-47054
A version of this document is published in / Une version de ce document se trouve dans :
Proceedings of the Joint NSC-NRC Workshop on Construction
Technologies, Taipei, Taiwan, April 26-27, 2004, pp. 127-138
SOUND INSULATION ISSUES
John S. Bradley
1ABSTRACT
This paper gives an overview of three topics related to sound insulation in buildings. The first project included laboratory and field measurements of sound insulation against aircraft noise. As well as various technical papers, the project produced software to help in the design of adequate sound insulation. In a second project, re-analysis of survey results allowed the development of a rational basis for sound insulation goals for walls between adjacent homes. In the third part of this paper the need for new research to develop improved methods of rating impact sound insulation is discussed.
INTRODUCTION
This paper gives an overview of three topics related to sound insulation in buildings. The first two topics review completed research and the third discusses an area where there is a need for further work. Section I reviews a recently completed project that comprised a comprehensive study of issues related to the sound insulation of buildings against aircraft noise. It included both laboratory and field measurement studies and resulted in software to aid in the design of sound insulation treatments. The second section summarises an analysis of field survey data to derive acceptable values for the airborne sound insulation between apartments and row houses. Finally, the third section discusses the internationally recognized problem of rating impact sound insulation, such as that for footstep sounds. A final discussion section summaries topics of possible further research related to sound insulation in buildings.
Keywords: sound insulation, outdoor noise, impact sound insulation, aircraft noise.
I. OVERVIEW OF SOUND INSULATION AGAINST AIRCRAFT NOISE
Sound transmission from an outdoor sound source, such as an aircraft, into a building is a complex process. The sound source (the aircraft) is moving, is a directional sound source and includes strong low frequency sounds. There are multiple propagation paths from the aircraft to various parts of the building including reflections from the ground and other buildings. Sound transmission into the building is also complicated because of the varying angles of incidence of the aircraft noise, the multiple transmission paths within the building and the fact that these phenomena all vary greatly with the frequency of the sound.
The IBANA project (Insulating Buildings Against Aircraft Noise) was intended to develop better procedures for estimating indoor sound levels from outdoor aircraft noise. The project included extensive laboratory measurements of the sound transmission loss of exterior walls, roof constructions, windows, and some doors. A second phase of the work included measurements in a test house built at Ottawa airport to relate the laboratory results to measurements in a simple building exposed to actual aircraft noise. The information of both of the first two parts of the project were combined into the IBANA-Calc software that allows users to easily calculate indoor sound levels for various types of building envelope constructions
as well as to listen to simulations of the expected indoor sounds. Type of exterior cladding Attachment of the cladding
Type of exterior sheathing Stud size and spacing Internal thermal insulation Resilient channels Indoor surface layers Vents
Table 1. Parameters varied in transmission loss measurements of exterior walls.
LABORATORY MEASUREMENTS
The sound transmission loss of various exterior wall and roof constructions were measured in standard tests in which the wall or roof is constructed between pairs of reverberation chambers. The tests followed the ASTM E90 [1] standard but were extended to give results down to 50 Hz because low frequency sounds are particularly important when considering aircraft noise. The constructions were mostly various forms
1
Principal Research Officer, Institute for Research in Construction, National Research Council, Canada, email: [email protected]
of wood frame construction that is common in North America for single-family homes as well as row housing and apartment buildings up to about 3 or 4 floors high. The transmission loss tests were carried out as series of measurements to investigate the importance of various parameters describing the constructions.
Table 1 lists the parameters that were varied in the measurement of the sound transmission loss of the exterior walls. One important variable is the mass of the exterior cladding, which could vary from light-weight vinyl or aluminum siding to brick. Figure 1 shows plots of measured sound transmission loss (upper part) for wood frame construction with the mass of the exterior cladding varied. As would be expected, the measured sound transmission loss improves with the mass of the exterior cladding. The lower part of Figure 1 compares expected indoor noise levels for a standard aircraft noise source. The indoor levels have been A-weighted to better reflect their subjective importance. This form of presentation more clearly illustrates the importance of the transmitted low frequency sounds. Even when A-weighted, the most important indoor sounds are those of a peak at 125 Hz. This is only clearly apparent because the measurements extend down to 50 Hz.
The Sound Transmission Class (STC) is a single number rating that is often used to rate the sound insulating properties of indoor walls. It is not appropriate for outdoor noise sources where low frequency sounds often predominate. Therefore in this work the OITC (Outdoor-Indoor Transmission Class) [2] is used as a more appropriate single number rating. Figure 1 includes OITC values varying from 25 for the base wall to 40 for the wall with brick cladding.
63 125 250 500 1000 2000 4000 10 20 30 40 50 60 70 80 Indoor level, dBA Frequency, Hz 20 30 40 50 60 70 80
Base wall, OITC 25 EIF stucco, OITC 27 Cement stucco, OITC 29 Brick, OITC 40
TL, dB
Figure 1. Measured transmission loss (TL) versus frequency for wood frame constructions with varied exterior cladding (upper) and corresponding indoor noise levels (lower).
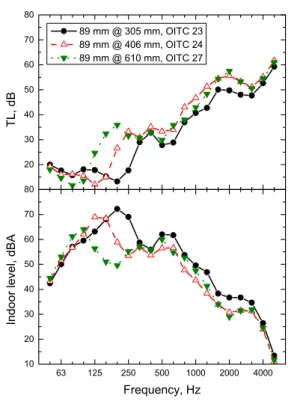
63 125 250 500 1000 2000 4000 10 20 30 40 50 60 70 80 Indoo r l e vel, dBA Frequency, Hz 20 30 40 50 60 70 80 89 mm @ 305 mm, OITC 23 89 mm @ 406 mm, OITC 24 89 mm @ 610 mm, OITC 27 TL, d B
Figure 2. Measured transmission loss (TL) (upper) and indoor sound levels (lower) for wood frame constructions with varied wood stud spacing.
Another example of the results of the wall tests is given in Figure 2. This figure shows transmission loss and indoor sound levels for wood frame walls with varied wood stud spacing. There is an obvious dip in the transmission loss and a corresponding peak in the indoor sound levels that systematically varies with the stud spacing. Increasing the stud spacing from 305 to 610 mm moves this sound level peak from 200 Hz to 100 Hz. Thus the design of the stud system significantly affects the performance of the wall by varying the level and frequency of the dominant low frequency indoor sound. Further results of the wall sound transmission loss measurements are found in [3].
The measurements of the sound transmission loss of walls also included studies of the effects of resilient channels. These are thin metal pieces (0.5 mm thick) that provide a resilient connection between the interior gypsum board and the wood stud system. They are widely used to improve the sound transmission loss of walls and floors. Figure 3 includes sketches of resilient channels and also shows the effects on the resulting sound transmission loss of adding these to a wall. The
addition of resilient channels substantially improves the sound transmission loss at most frequencies. However at very low frequencies the sound transmission loss actually decreases when they are added. To better understand the effects of adding resilient channels, a mathematical model of their performance was developed [4]. By considering the resilient channels as vibrationaly isolating the gypsum board from the rest of the wall, one can calculate the transmissibility of the vibration isolation, which indicates the expected increase in sound transmission loss of the wall.
63 125 250 500 1000 2000 4000 10 20 30 40 50 60 70 80 Modified mass-air-mass resonance
Primary structural resonance
GP GPS BM none TL , d B Frequency, Hz GP GP (Special) BM
Figure 3. Sketches of sections of resilient channels (right) and measured sound transmission loss (TL) with and without the use of resilient channels to mount the gypsum board.
The results of the various measurements of wall sound transmission loss were combined into a design chart for more convenient use. The laboratory tests also included a number of measurements of the sound insulation of various roof constructions. These included measurements of the effects of various roof vents that are necessary to avoid moisture problems in attic roof spaces of buildings. In total over 100 wall and roof constructions were tested and the resulting sound transmission loss values were used to create a database of results for common Canadian constructions.
OTTAWA AIRPORT TEST HOUSE
In order to better understand the effects of the various angles of incidence of the aircraft noise and the transmission of aircraft noise into complete buildings, a small test house was built on the property of Ottawa Airport. It was located 1000 m from the end of a runway and 240 m to the side of the flight track of aircraft taking off from this runway. It was the simplest possible structure that would be representative of a small wood frame house and included two main rooms facing the passing aircraft as shown in Figure 4. The structure was systematically modified to change the indoor surfaces, to add roof vents, and eventually to add windows. During some tests additional masking walls were added parallel to one of the exterior walls so that measurement results would be indicative of sound transmission through only one of the two exterior walls of each room. One end of the house was exposed to approaching aircraft and the other to departing aircraft.
The simplest configuration was to measure sound transmission through only the wall facing the passing aircraft and to mask off the other wall. Figure 5 compares measured and calculated noise reductions for this case in room A. The calculated noise reductions were based on laboratory tests of the same wall construction. Measured and calculated noise reductions agree well at mid-frequencies. At low frequencies there is a large dip in the calculated values that is not included in the results measured in the test house. This is partly because the laboratory sound transmission loss measurements of this construction have a prominent dip at 125 Hz and this is not found in the field measurements in the test house. The complete cause of the differences between measured and calculated results was explained by analysis of the results of other configurations of the test house.
The laboratory measurements of the sound transmission loss of this construction include a dip at 125 Hz. This dip is related to the stud spacing and is not present when the interior surface is mounted on resilient channels. A wall construction that included resilient channels was included in the measurements at the test house and the results are included in Figure 6. In Figure 6 there are large differences between measured and calculated noise reductions. At low frequencies, measured noise reductions were better than expected from the calculations. This is due to the effects of ground reflections at low frequencies. In making these measurements the incident sound was measured at a point in the free field 8.5 m above the ground. The sound incident on the house was a
combination of direct sound and ground-reflected sound. At low frequencies the ground-reflected sound tends to interfere negatively with the direct sound and hence reduces the actual sound pressure incident on the building façade. This causes the measured noise reduction (relative to the free-field microphone) to appear to be larger than expected. At higher frequencies Figure 6 shows that the measured noise reductions are less than expected from the calculated results. In practice the expected increase in noise reductions due to the addition of the resilient channels is not observed. This is due to structural flanking paths. The sound energy is transmitted into the receiving room via other paths in the structure of this light-weight construction as illustrated in Figure 6.
Figure 4. Views of the Ottawa Airport Test House showing passing aircraft and the floor plan.
63 125 250 500 1k 2k 0 10 20 30 40 50 60 70 Field measurement Calculated from lab results Calculations with corrections
Noise Redu
ction, dB
Frequency, Hz
Figure 5. Comparison of measured and calculated noise reductions in room A with only the wall facing the passing aircraft transmitting aircraft noise.
These same structural flanking paths also cause the differences between measured and calculated noise reductions at high frequencies in Figure 5. The data in Figure 5 labelled ‘Calculations with corrections’ include empirically derived estimates of these two effects and greatly improve the agreement with measured noise reductions. Similar results were obtained for the end wall facing the departing aircraft but for the end wall facing the approaching aircraft there is a further source of error. Aircraft are quite complex directional noise sources and tend to radiate less noise forward than to the side and rear of the aircraft. Thus the free field microphone results overestimate the sound levels on the approach wall of the building and lead to apparently larger noise reductions.
The simple predictions over-predicted indoor sound levels by about 6 dBA on average. The improved calculations including flanking paths and ground reflection effects over-predicted indoor levels by about 3 dBA. This remaining 3 dBA difference is mostly due to the different behaviour of the walls in the 125 Hz region. For the case where the walls had windows, the dominant frequencies of the transmitted sound are the mid-frequencies between 250 and 500 Hz. The windows consisted of two layers of 3 mm glass separated by a 13 mm air space. The main factors limiting the predictions of the walls without windows are no longer so important, when windows are included in the wall. For cases having walls with windows the average difference
between measured and predicted indoor sound level was only 0.5 dBA. 63 125 250 500 1k 2k 0 10 20 30 40 50 60 70 Field measurements From lab measurements Noi s e Re duc ti on , d B Frequency, Hz Direct Structural flanking 63 125 250 500 1k 2k 0 10 20 30 40 50 60 70 Field measurements From lab measurements Noi s e Re duc ti on , d B Frequency, Hz Direct Structural flanking
Figure 6. Comparison of measured and calculated noise reductions for walls with resilient channels.
VARIATION OF INCIDENT AND TRANSMITTED SOUND WITH ANGLE OF INCIDENCE
Several measurement standards include the use of façade-mounted microphones to measure the incident sound [5]. In our tests the incident sound was measured both with a free-field microphone mounted on an 8.5 m high mast and also with a façade mounted microphone. Comparisons of the two measurement techniques revealed that results obtained with façade-mounted microphones can be quite difficult to interpret. Simple theory would suggest that the incident levels at a façade-mounted microphone would be 6 dB greater than at the free-field microphone due to pressure doubling. Measurements of incident sound levels are also sometimes made at positions 2 m from the building façade with the expectation that levels will be 3 dB greater than at a free-field position due to energy doubling. However, such simple relationships are not found.
63 125 250 500 1k 2k 4k -8 -6 -4 -2 0 2 4 6 8 Vertical angle, degrees 44 46 51 56 61 66 F ac ade O ut doo r, d B Frequency, Hz
Figure 7. Measured differences of incident sound
between a free-field microphone and a façade microphone as function of the vertical angle of F28 type aircraft.
The differences between free field measurements and those at the façade surface are more complicated than simple theory suggests and can vary greatly with the vertical angle of elevation of the aircraft as shown in Figure 7. As the angle of elevation decreases (i.e. approaching normal incidence) and as frequency increases, results are closer to the simple expectation of +6 dB pressure doubling. At higher angles of incidence, the difference between façade-microphone and
free-field results is close to 0 dB for a wide range of frequencies. There are much larger differences from the expected +6 dB at lower frequencies. The large differences at lower frequencies are due to interference between the direct and ground reflected sound. At 80 Hz the incident sound measured at the façade microphone is as much as 12 dB less than expected. At medium and higher frequencies the variations with vertical elevation of the aircraft are thought to be due to variations in diffraction effects. Similar results were obtained for a finite sized model façade in tests in an anechoic room.
The effective measured noise reductions also varied due to the directionality of the sound radiated by aircraft. At one end the aircraft were approaching towards the façade and at the other end aircraft were departing away from the façade. In general aircraft radiate
lower sound levels forward than behind and hence the approach façade receives lower incident sound levels. Because the incident sound was measured at the free field microphone and integrated over a complete aircraft passby, the effect of the directionality of the aircraft was not included in the predictions.
We also expect from theoretical considerations that sound transmission through the building envelope will vary with angle of incidence. In the measurements at the test house such variations of measured noise reductions with angel of incidence of the sound were small and were largely masked by the effects of aircraft directionality and ground reflections at the ground floor façade of the test house.
IBANA-CALC SOFTWARE
The results of the laboratory and field measurement studies were combined to create the IBANA-Calc software that makes it possible to conveniently calculate indoor aircraft noise levels for various building constructions. The user first picks the level and type of outdoor aircraft noise. The user then selects construction types for each element of the building envelope from the program’s database of laboratory sound transmission loss results and also enters the area of each element. Each wall can include several components such as windows and doors. The program then calculates the indoor sound levels in 1/3 octave frequency bands. The user can compare the results of several proposed designs both graphically or by listening to simulated indoor aircraft noise for each design. The program is a convenient calculation tool and is also a useful tutorial aid for explaining the differences between various designs.
II. DERIVING ACCEPTABLE VALUES FOR PARTY WALL SOUND INSULATION FROM SURVEY RESULTS
THE SURVEY
The results from a field survey of the sound insulation of walls separating multiple unit housing in 3 Canadian cities were used to derive acceptable values for the airborne sound insulation of party walls[6]. The survey included extensive face-to-face interviews in subjects’ homes as well as complete sound transmission loss measurements of the party walls between homes and ambient noise measurements in each home over a complete 24 hour period. To focus on the average community response, only aggregate data for groups with similar sound insulation ratings are considered in this paper.
A total of 600 subjects were interviewed in 300 pairs of homes. Homes were equally distributed among the combinations of owners and renters, two housing types and three cities. The two housing types were row housing (homes adjacent side by side) and apartments (i.e. homes adjacent up and down as well as side by side). The three cities, Toronto, Montreal and Vancouver, have different climates and differences in construction styles. Subjects were first approached by letter asking them to participate in a building satisfaction survey and were subsequently interviewed in their homes. Initial questions obtained spontaneous responses without any mention of sound insulation or noise. These included ratings of the satisfaction with their building, whether they would like to move and how considerate their neighbours were. Subsequent questions obtained directly elicited responses concerning whether they heard various sounds and how annoying they were. For most survey questions, responses were obtained using 7-point response scales. The survey procedure was essentially the same as that found to be successful in a smaller pilot study [7,8].
In this paper only the STC sound insulation ratings of the walls will be presented. The 300 common walls had apparent STC ratings (i.e. including possible flanking paths) varying from 38 to 60 with a mean of 49.8. Data were aggregated into 8 groups by apparent STC rating.
THE IMPORTANCE OF SOUND INSULATION
Direct questions about noise or sound insulation can potentially bias results by sensitizing subjects to the importance of sound insulation between homes. The initial questions were intended to avoid this problem by obtaining spontaneous responses related to the importance of sound insulation. When subjects were asked if they would like to move from their present home, the percentage saying yes was significantly related to the measured STC of their party wall. The percentage wanting to move decreased significantly for higher STC values. Of the people saying they would like to move in each of the 8 STC groups, 94 to 100 % of them gave a noise related reason. That is, sound insulation seems to be a major cause of people wanting to move and noise problems appear to be an almost ubiquitous reason for wanting to move.
When subjects were asked how satisfied they were with the building in which they lived, the responses were significantly related to measured STC values (see Table II) and subjects with better sound insulation were more
satisfied with their building. Even though there was no mention of noise or sound insulation, there was again evidence of the importance to the residents of the sound insulation between homes.
Subjects’ responses concerning how considerate their neighbours were, were also significantly related to measured STC values. That is, subjects with lower sound insulation tended to blame their neighbours as being less considerate. Poor sound insulation between homes is thus seen to be a potential cause of social disruption.
When asked how often they were awakened by noises from neighbours in their building, their responses were again significantly related to measured STC values (see Table 2). Thus the reported quality of resident’s sleep is related to the amount of sound insulation between their homes.
Response R2 p <
Percentage wanting to move. 0.560 0.033
How satisfied with your building? 0.832 0.002
How considerate are your neighbours? 0.857 0.001
How often awakened due to noise from neighbours? 0.602 0.024
Subjective rating of sound insulation. 0.921 0.000
Table 2. Summary of relationships with measured STC values. (R2 is coefficient of determination, p is probability of the result occurring by chance).
When subjects were asked to rate the sound insulation between them and their neighbours, their responses were significantly related to measured STC values. There seems no doubt that subjects are aware of the quality of the sound insulation, it is important to them, and it affects their quality of life.
GOALS FOR BETTER SOUND INSULATION
The questionnaire included many items that asked directly how often they heard specific sounds and how annoying they were considered to be. The more important items concerned: (a) sounds from neighbours either side, (b) sounds of neighbour’s voices, (c) sounds of neighbour’s radios and televisions, and (d) music related sounds from their neighbours. Other questions concerned more specific sources of noise that were not always present in all types of buildings. A factor analysis of the responses simply suggested that each pair of responses concerning hearing and being annoyed by a particular type of sound were related. Thus in the principal analyses the averages of each pair of responses is considered.
Figure 8 plots the averages of responses concerning questions asking about sounds from their neighbours either side of them. These averages included responses to questions asking how often they heard these noises and how annoying they were, as well as the responses to two other questions asking how annoying these sounds were at different times of day.
35 40 45 50 55 60 1.0 1.5 2.0 2.5 3.0 R2 = 0.818, p < 0.002 Sounds f rom eit her side STC, dB
Figure 8. Average responses concerning sounds from neighbours either side versus STC.
The analyses of the other principal responses showed similar average responses versus measured STC values. For lower STC values, the responses do not vary with STC but for higher STC values the responses systematically decrease with increasing STC. Disturbance from neighbours’ noises depends, not only on the amount of sound insulation, but also on how
noisy their neighbours are and how frequently they make noise. For lower STC values, the sound insulation was not very effective and the average frequency of hearing neighbours simply depends on how often the neighbours are noisy. It is only above about STC 50 that these responses decrease systematically with increasing sound insulation. Therefore sound insulation of greater than STC 50 is required to decrease the disturbance of these noises. Figure 9 compares the curves that were fitted to each set of average responses. They were all sigmoidal fits based of a Boltzman equation.
The R2 values on each plot varied from 0.772 to
0.944 and indicate the goodness of fit between the data points and these regression curves. In all cases the agreement is statistically
significant (p <0.004 or better). 35 40 45 50 55 60 1.0 1.5 2.0 2.5 3.0 Side Voices Radio TV Music B e st f it c u rv e s STC, dB
Figure 9. Comparison of regression fits to average responses versus STC for, sounds of their neighbours either side (Side), sounds of their neighbours’ voices (Voices), sounds of their neighbours’ radio or television (Radio TV), and music related sounds from their neighbour (Music).
If one compares the point at which each curve starts decreasing with increasing STC value, one can estimate where sound insulation starts influencing subjects’ perceptions of various types of sounds. For voice sounds, this point is probably a little less than STC 50. For radio and television sounds, as well as more general sounds from neighbours either side, the critical point is about STC 50. However, for music related sounds, the sound insulation must be greater than about STC 55 to reduce the impact on residents. These differences are consistent with the likely strength of these sounds, and their potential disturbance. Thus for most types of sound, the benefits of sound insulation only occur when the STC rating of the wall is substantially above STC 50. However, for music related sounds, the sound insulation is more
effective if the party wall has an STC rating well over STC 55.
Two of the average responses reduce to a score of about 1 at STC 60 indicating that at this point residents would not hear these sounds from their neighbours at all and they were ‘not at all annoyed’ by them. The other two average responses in Figure 9 are greatly reduced for a mean sound insulation rating of STC 60 suggesting that walls with STC 60 would practically eliminate problems related to inadequate sound insulation.
RECOMMENDATIONS
Noise from neighbours in multi-unit buildings is a serious problem that degrades the quality of life of the residents. Many of their spontaneous and directly elicited responses are strongly related to the measured STC values of the walls between their homes.
It is only when sound insulation is approximately STC 55 or greater, that sound insulation is effective in minimizing the negative effects on residents.
STC 55 is therefore recommended as a realistic goal for acceptable sound insulation and STC 60 as a more ideal goal that would practically eliminate the negative effects of neighbours’ noises.
Figure 10. Photograph of 3 impact sound sources. From left to right are the Japanese tire drop machine, a resilient rubber ball and the standard tapping machine.
III. SUBJECTIVE RATING IMPACT SOUND INSULATION
Although impact sounds can be very disturbing to people living in apartments and other multiple-residence buildings, there is not complete agreement concerning how to rate the disturbing aspects of such sounds. There are standard procedures [9,10] that use a standard tapping machine. However, these procedures are said to not predict disturbance due to impact sounds very well. Accordingly, new rating procedures have been proposed for use with the standard tapping machine [11] and new impact sources have been introduced [12] to develop improved rating procedures. There is still a need for subjective studies to develop and test improved methods for rating the disturbance of impact sounds.
STANDARD RATING PROCEDURES
Standard procedures for rating the sound insulation of floors are described in ISO 140-6 [10] and ASTM E492 [9]. These use a standard tapping machine
illustrated in the photograph of Figure 10. When this impact source is placed on the test floor the resulting sound levels are measured in the room below. The 1/3 octave band spectrum of the received impact sound levels is then compared with a standard rating contour (see Figure 11) and a single number impact sound isolation rating is determined. The ASTM E989 approach produces an Impact Insulation Class (IIC) rating [13]. The ISO 717 [14] procedure is similar and results
in a Ln,w rating such that Ln,w ≈ 110 – IIC
with some variation due to the inclusion of the 8 dB rule in the ASTM approach, but not in the ISO approach.
NEW IMPACT SOUND SOURCES
The impact sound created by the standard
tapping machine is quite different than that produced by footsteps. Many have argued that the different spectral characteristics of impact sound from a tapping machine and natural footsteps is a major weakness of the standard procedure. Accordingly there have been attempts to develop better impact sources that more closely approximate footstep sounds. The Japanese standard JIS 1418 [15] describes the tire impact machine shown in the photograph of Figure 10. The tire machine has not been accepted in other countries and the force applied to the floor can be excessive for some lightweight floors. Other work in Japan [12] has developed two different resilient balls to be better impact
sound sources. The second ball is said to be more resilient than the first. Both weigh 2.5 kg and have a diameter of 180 mm. One of these is also shown in the photograph of Figure 10. 63 125 250 500 1k 2k 4k 60 65 70 75 80 85 N o rm aliz ed le vel, dB Frequency, Hz ASTM/ISO Bodlund
Figure 11. Comparison of the impact sound insulation rating contour from ASTM E989 [13] and ISO 717 part 2 [14] with the proposed rating contour of Bodlund[11].
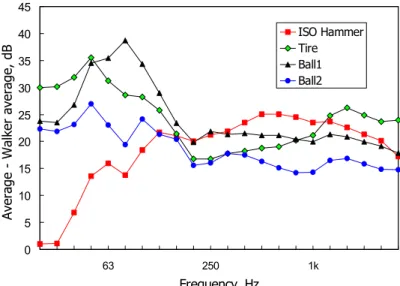
Extensive work by Warnock at the National Research Council of Canada has compared all three impactors to natural footsteps for the results from tests of about 190 different floors [16]. Figure 12 shows the mean differences in resulting impact sound levels for each source relative to that from natural footsteps. The standard tapping machine is seen to produce less low frequency sound energy than natural footsteps. The
0 5 10 15 20 25 30 35 40 45 63 250 1k Frequency, Hz A v era g e - Wa lk er a v era g e, dB ISO Hammer Tire Ball1 Ball2
Figure 12. Mean difference between the impact spectrum for each device and the walker spectrum. [16]
tire machine and Ball1 produce more low frequency energy than natural footsteps. Ball2 produces impact sounds with a spectrum most similar to that of natural footsteps.
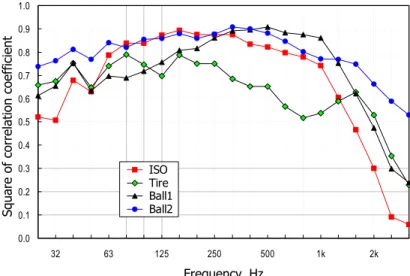
Warnock also correlated the measured impact sound levels in each 1/3 octave band from the mechanical impact sources with the levels obtained for a human walker. Figure 13 plots the values of the correlation coefficients
squared (R2) for each impact source and in each frequency band. At most frequencies (25 Hz to 1 kHz) the
results for Ball2 are correlated most strongly with those from the walker. In particular the correlations are a little higher than for the tire machine in this frequency range.
Although Warnock’s studies did not include subjective ratings of the transmitted impact sound, his demonstrations that the Ball2 results are most similar to natural footstep sounds indicate that this source is potentially an improvement over the standard tapping machine.
NEW IMPACT SOUND RATING CONTOURS
Another approach is to try to develop a new procedure for rating the transmitted impact sounds from the standard tapping machine. This would have the advantage that the same standardized impact source could continue to be used. Bodlund [11] develop an improved rating contour from survey results of ratings of impact sounds in apartment buildings. His proposed rating contour is included in Figure 11 along with that included in the ISO and ASTM standards. The positive slope of the contour may somewhat compensate for the lack of low frequency energy produced by the tapping machine. Although Bodlund found it to be better, the resulting correlation of measured impact sound levels with subjective ratings was not greatly improved.
PROPOSED NEW SUBJECTIVE EVALUATION OF IMPACT SOUND INSULATION
It is proposed to build on NRC’s considerable experience in the measurement of impact sound insulation and carry out subjective studies to develop better ratings of impact sound insulation. The new work would use existing sound simulation capabilities.
Subjective evaluations can be carried out in the field and in the laboratory. Field studies where subjects are interviewed in their own homes can assess more realistically the effects of long term exposure to various sounds. Because there are many other factors that influence the rating of sounds from neighbours, the results of such field studies usually include considerable scatter. Laboratory studies are more suitable for considering the effects of small differences in rating procedures.
The NRC acoustics laboratory has developed two facilities for simulating sound fields for subjective evaluations. Figure 14 shows a photograph of the room acoustics sound field simulation system. It consist of 8 loudspeakers arranged equi-distant from the subject. Tests sounds are fed to each loudspeaker with various delays and reverberation to simulate sound in a variety of indoor spaces. Most recently we have used this system to examine speech intelligibility and
subjective ratings of speech communication conditions in rooms. The processing of the signals to the 8 loudspeakers is performed by 4 Yamaha DME32 digital mixing engines that can modify the sounds as required under computer control. Figure 15 illustrates another simulation set up that has been used to evaluate speech security of meeting rooms. A subject hears speech sounds from the loudspeakers in front of them, modified to simulate sound transmitted through a wall. At the same time the ceiling mounted loudspeakers produce simulated ventilation type sounds. This system uses the same computer controlled
0.0 0.1 0.2 0.3 0.4 0.5 0.6 0.7 0.8 0.9 1.0 32 63 125 250 500 1k 2k Frequency, Hz Square of correl a ti on coeffi ci ent ISO Tire Ball1 Ball2
Figure 13. Correlations between spectra from the impactors and from the walker [16].
Figure 14. The room acoustics sound field simulation system in the NRC anechoic room.
DME32 units to created the desired changes to the simulated sounds under computer control. The same set up could be equally well used to simulate impact sounds from the floor above using our large amount of measured impact sound insulation data to guide the simulations.
IV. Discussion
Two possible areas of research are suggested: (1) extensions to the work on sound insulation against aircraft noise, and (2) derivation of better impact sound insulation ratings.
The work on sound insulation against aircraft noise could be extended to consider road and rail noise sources and to high rise buildings. These extensions would include more common examples of noise intrusion than the original aircraft noise work. However, they also would allow a more complete investigation of more fundamental issues. Although road and rail noise have different spectral characteristics, they would also lead to different angles of incidence of the sound on buildings. Including high rise buildings would also necessitate further consideration of different angles of incidence as well as quite different constructions. Therefore the proposed new work would not only extend the
practical application of our previous sound insulation studies, but could improve the accuracy of all calculations of the sound insulation of building envelope components by providing a more complete understanding of the effects of angel of incidence of the outdoor sound.
Ambient loudspeaker Ceiling Curtain Transmitted speech loudspeaker Foam
Figure 15. A section through the room acoustics test space showing the location of loudspeakers for subjective ratings of simulated transmitted sounds.
The lack of a procedure to accurately rate the adverse effects of the impacts of footstep sounds is recognized as a major problem in many countries. Although a solution is not available, there have been advances with the introduction of better impact sources and potentially better rating contours. New subjective studies could accurately evaluate these and other possible solutions to more confidently recommend a better approach to rating impact sound insulation.
References
1. ASTM E90 – 97, “Standard Test Method for Laboratory Measurement of Airborne Sound Transmission loss of Building Partitions and Elements”, Am. Soc. for Testing and Materials, Philadelphia.
2. ASTM E1332, “Standard Classification for Determination of Outdoor-Indoor Transmission Class”, Am. Soc. for Testing and Materials, Philadelphia.
3. Bradley, J.S. and Birta, J.A., “On the Sound Insulation of Wood Stud Exterior Walls”, J. Acoust. Soc. Am., vol. 110, No. 6. Pp. 3086-3096, (2001).
4. Bradley, J.S. and Birta, J.A., “A Simple Model of the Sound Insulation of Gypsum Board on Resilient Supports”, Noise Control Eng. J., vol. 49, no. 5, pp. 216-223, (2001).
5. Bradley, J.S. and Chu, W.T., “Errors When Using Façade Measurements of Incident Aircraft Noise”, Proceedings Inter Noise 2002, Dearborn, USA.
6. Bradley, J.S., “Deriving Acceptable Values for Party Wall Sound Insulation
from Survey Results”, Proceedings Inter Noise 2001, The Hague, The Netherlands (Aug, 2001). 7. Bradley, J.S. “Subjective Rating of Party Walls”. Canadian Acoustics, Vol. 11, No. 4, 37-45, (1983). 8. Bradley J.S., “Acoustical Measurements in Some Canadian Homes”, Canadian Acoustics, Vol. 14, No.
4, 1986, 19-21, 24-25, (1986).
9. ASTM E492 Standard Test Method for Laboratory Measurement of Impact Sound Transmission through Floor-ceiling Assemblies using the Tapping Machine.
10. ISO 140-6, Acoustics, Measurement of sound insulation in buildings and of building elements, Laboratory measurements of impact sound insulation of floors.
11. Bodlund, K., Alternative reference curves for evaluation of the impact sound insulation between dwellings, J. Sound and Vibration (1985), p381-402.
12. Tachibana, Tanaka, Koyasu. “Heavy impact source for the measurement of impact sound insulation of floors”, Proc. INCE 92, p 643.
13. ASTM E989 Standard Classification for Determination of Impact Insulation Class.
14. ISO 717 Acoustics — Rating of sound insulation in buildings and of building elements Part 2: Impact sound insulation.
15. JIS 1418 Japanese National Standard describing impact testing of floors.
16. Warnock, “Floor Research at NRC Canada”, Proceedings Conference in Building Acoustics, ‘Acoustic Performance of Medium-Rise Timber Buildings”, December 3-4, (1998), Dublin.