Publisher’s version / Version de l'éditeur:
Vous avez des questions? Nous pouvons vous aider. Pour communiquer directement avec un auteur, consultez la
première page de la revue dans laquelle son article a été publié afin de trouver ses coordonnées. Si vous n’arrivez pas à les repérer, communiquez avec nous à PublicationsArchive-ArchivesPublications@nrc-cnrc.gc.ca.
Questions? Contact the NRC Publications Archive team at
PublicationsArchive-ArchivesPublications@nrc-cnrc.gc.ca. If you wish to email the authors directly, please see the first page of the publication for their contact information.
https://publications-cnrc.canada.ca/fra/droits
L’accès à ce site Web et l’utilisation de son contenu sont assujettis aux conditions présentées dans le site LISEZ CES CONDITIONS ATTENTIVEMENT AVANT D’UTILISER CE SITE WEB.
Fourth International Conference on Concrete Under Severe Conditions
[Proceedings], pp. 1423-1430, 2004-06-01
READ THESE TERMS AND CONDITIONS CAREFULLY BEFORE USING THIS WEBSITE.
https://nrc-publications.canada.ca/eng/copyright
NRC Publications Archive Record / Notice des Archives des publications du CNRC :
https://nrc-publications.canada.ca/eng/view/object/?id=1d38d990-034b-4fb2-b81d-12aa6a8769a7 https://publications-cnrc.canada.ca/fra/voir/objet/?id=1d38d990-034b-4fb2-b81d-12aa6a8769a7
NRC Publications Archive
Archives des publications du CNRC
This publication could be one of several versions: author’s original, accepted manuscript or the publisher’s version. / La version de cette publication peut être l’une des suivantes : la version prépublication de l’auteur, la version acceptée du manuscrit ou la version de l’éditeur.
Access and use of this website and the material on it are subject to the Terms and Conditions set forth at
Field performance of corrosion inhibiting systems in reinforced
concrete bridge barrier walls
Field performance of corrosion inhibiting systems in reinforced
concrete bridge barrier walls
Qian, S.; Cusson, D.
NRCC-46436
A version of this document is published in / Une version de ce document se trouve dans :
4
thInternational Conference on Concrete under Severe Conditions:
FIELD PERFORMANCE OF CORROSION INHIBITING SYSTEMS
IN REINFORCED CONCRETE BRIDGE BARRIER WALLS
Shiyuan Qian and Daniel Cusson
Institute for Research in Construction, National Research Council Canada, Canada
Abstract
Corrosion inhibitors have been considered as one of the most effective solutions to address the problem of corrosion of steel reinforcement in concrete structures. However, limited information is available on their actual field performance and cost-effectiveness. In this study, the field performance of nine commercially available corrosion-inhibiting systems for use in concrete were assessed on a newly reconstructed barrier wall on the Vachon Bridge near Montreal. These corrosion-inhibiting systems included concrete admixtures, reinforcing steel coatings, and/or concrete surface coatings/sealers. Special rebar ladders were embedded in the barrier wall to provide different thicknesses of the concrete cover for accelerated corrosion and rapid evaluation of the performance of the applied corrosion-inhibiting systems. On-site corrosion surveys, including half-cell potential and corrosion rate measurements, along with concrete coring were conducted yearly. Electrochemical tests on the performance of corrosion-inhibiting systems were also carried out in the laboratory. The results indicate that the system containing the inorganic-based admixture performed better than the other systems in delaying and/or reducing the corrosion of reinforcement in the concrete barrier wall.
1. Introduction
Corrosion inhibitors have been used increasingly in the past 15 years in reinforced concrete structures to reduce corrosion and extend their service lives. Earlier studies on
corrosion inhibitors focused mainly on sodium benzoate,1 various nitrites, and
chromates/dichromates2. None of these inhibitors performed satisfactorily and many of
them led to detrimental effects on the strength development of concrete. A study of the efficiency of calcium and sodium nitrites as corrosion inhibitors was reported in the
1970’s.3 Since then, calcium nitrite became commercially available and has been used
extensively in reinforced concrete structures exposed to chlorides.4 During the 1990’s, a number of organic inhibitors, such as various amines, alkanolamines, their salts with organic and inorganic acids, and emulsified mixtures of esters, alcohols and amines were developed.
The effectiveness of most corrosion-inhibiting products on the market is based on laboratory experiments or empirical pass/fail results obtained from periodic field testing. Data on long-term field performance of these products is very limited in the literature and there is little evidence of a solid understanding of the factors that govern the in-service inhibiting mechanisms.
In this paper, the field performance of different commercial corrosion-inhibiting systems was assessed for 5 years at the Vachon Bridge near Montreal, Canada. Field corrosion measurements such as half-cell potential, linear polarisation and concrete resistivity were performed over the main reinforcement, as well as over special embedded rebar ladders. Additional laboratory corrosion tests5 in electrochemical cells and material testing of field cores were also carried out to support the field study.
2. Experimental
2.1 Field installation and exposure conditions
Ten 34-m long spans of a reinforced concrete barrier wall on a highway bridge were rebuilt in 1996 using 9 corrosion-inhibiting systems and one control system, as described in Table 1. The barrier wall reinforcement consisted of eight 15-mm longitudinal bars (incl. 4 bars near the front surface), and 15-mm transverse bars spaced at 230 mm along the barrier wall length. The grade of steel was 400R (CAN/CSA G30.18-M), except in one test span in which epoxy-coated reinforcement was used. The concrete had a water-cement ratio of 0.36 and a 28-day compressive strength of 45 MPa. More details on the concrete design and a layout of the test spans were presented previously.6
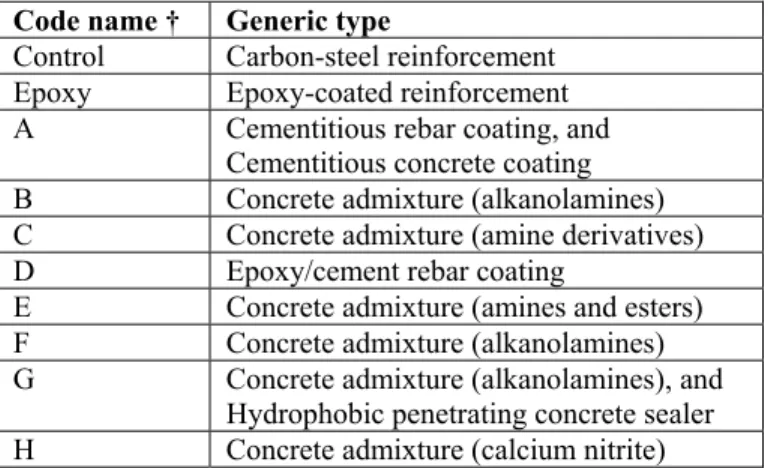
Table 1. Generic description of corrosion-inhibiting systems tested
Code name † Generic type
Control Carbon-steel reinforcement
Epoxy Epoxy-coated reinforcement
A Cementitious rebar coating, and
Cementitious concrete coating
B Concrete admixture (alkanolamines)
C Concrete admixture (amine derivatives)
D Epoxy/cement rebar coating
E Concrete admixture (amines and esters)
F Concrete admixture (alkanolamines)
G Concrete admixture (alkanolamines), and
Hydrophobic penetrating concrete sealer
H Concrete admixture (calcium nitrite)
† The commercial names of these systems are not identified in this paper to maintain confidentiality as requested by the product suppliers.
The bridge structure was exposed to the severe Canadian climate. Several wet-dry cycles (30-100% RH) and up to 23 freeze-thaw cycles were recorded over the 5 study years (1996 to 2001). Severe restrained shrinkage cracking was observed in the barrier wall a few days after construction.7 The resulting transverse cracks had an average spacing of 800 mm and a maximum width of 0.3 mm. This raised a concern that such cracking would lead to early initiation of reinforcing steel corrosion due to moisture and chloride ingress, and would result in premature spalling of the protective concrete cover.
2.2 On-site corrosion measurements
On-site corrosion surveys were performed annually in the spring, including measurements of the half-cell potential, corrosion rate and resistivity. A saturated copper/copper sulphate reference electrode (CSE) and a Fluke multimeter 867B were used to measure the half-cell potential following the ASTM C876-99 procedure. The measurements were taken at 110, 345 and 550 mm from the top of the barrier wall, and horizontally at 300-mm intervals over the central 15-m section of each span. The corrosion rates and resistivity were measured using sensors A and B of a Gecor 6 instrument (James Instruments Inc.). In each test span, measurements were taken on vertical and horizontal bars at selected cracked and uncracked locations.
Half-cell potentials and corrosion rates were also taken for special rebar ladders
embedded in the barrier wall (2 ladders per span).6 These rebar ladders had varying
concrete cover thickness ranging from 13 mm for the upper bar and 25 mm, 38 mm and 50 mm, respectively, for the 3 other horizontal bars. This reinforcement arrangement allowed for early detection of corrosion and, hence, early performance evaluation.
3. Results of on-site corrosion surveys
3.1 Half-cell potential
Figure 1 shows the half-cell potential measured in the barrier wall. Each data point shown is a linear regression result of over a hundred readings taken in each test span. The half-cell potentials were about –350 mV in 1997 (except in the epoxy span) and shifted gradually over time towards more negative values in all spans. The epoxy span, which had an initial potential of –250 mV in 1997, showed the sharpest change towards negative potential values over the years. According ASTM C876, corrosion would be occurring in all test spans. However, high-density concrete was used, and the oxygen depletion in concrete probably resulted in a negative potential shift. Also, severe early-age cracks appeared in all spans due to autogenous shrinkearly-age and uncontrolled thermal effects.7 These cracks probably caused early corrosion of reinforcing steel, resulting in a localized negative shift in potential.
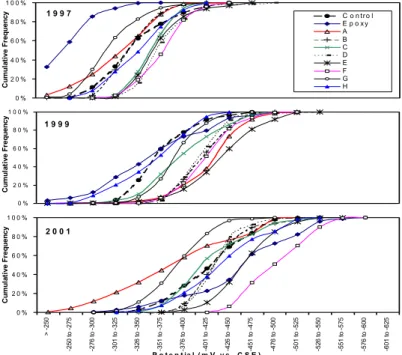
Figure 2 shows the cumulative distributions of half-cell potentials obtained on the 10 spans for the 1997, 1999 and 2001 surveys. From 1997 to 2001, the half-cell potentials shifted towards more negative values, which is a clear indication of the increase in the probability of corrosion. By 2001, the potentials had also spread over a wider volt range.
-500 -450 -400 -350 -300 -250 Time (year) control P o te nt ia l ( m V v s. C S E ) Epoxy A B C 19 97 19 98 19 99 20 00 20 01 -500 -450 -400 -350 -300 -250 D 199 7 19 98 19 99 200 0 20 01 E 19 97 19 9 8 19 9 9 20 0 0 20 01 F 19 97 19 98 19 99 20 00 20 01 G 19 97 19 98 19 9 9 20 00 20 01 H
Figure 1: Half-cell potential obtained during the 1997-2001 surveys.
0 % 2 0 % 4 0 % 6 0 % 8 0 % 1 0 0 % C um ul a ti v e Fr e que nc y C o n tr o l E p o x y A B C D E F G H 0 % 2 0 % 4 0 % 6 0 % 8 0 % 1 0 0 % C um ul a ti v e Fr e q ue n c y 0 % 2 0 % 4 0 % 6 0 % 8 0 % 1 0 0 % > -2 5 0 -2 50 t o -2 75 -2 76 t o -3 00 -3 01 t o -3 25 -3 26 t o -3 50 -3 51 t o -3 75 -3 76 t o -4 00 -4 01 t o -4 25 -4 26 t o -4 50 -4 51 t o -4 75 -4 76 t o -5 00 -5 01 t o -5 25 -5 26 t o -5 50 -5 51 t o -5 75 -5 76 t o -6 00 -6 01 t o -6 25 P o t e n t ia l ( m V v s . C S E ) C um ul a ti v e Fr e q ue n c y 2 0 0 1 1 9 9 7 1 9 9 9
Figure 2: Cumulative distributions of half-cell potential in 1997, 1999 and 2001. The epoxy span shows less negative half-cell potentials than all other spans in 1997. This is due to the initial high electrical resistance of epoxy coating on the reinforcement. However, a substantial negative shift occurred in 2001, which was more pronounced than for the other systems. This may be due to the galvanic effect of corrosion on the epoxy-coated rebars. In 2001, Span F showed the most negative potentials followed by the epoxy span and Span E. The control span showed average performance while Spans G and A, on the other hand, had the least negative potentials.
3.2 Corrosion rate and concrete resistivity
The average corrosion rates obtained at selected cracked locations (C) and uncracked locations (UC) for each span are shown in Fig. 3. Initially, some test spans showed relatively high corrosion rates in 1997 and 1998. These high rates were probably due to the formation of an oxide film on the reinforcement. After 1998, the rates were low in almost all spans (≤0.5 µA cm-2), probably due to the corrosion-inhibiting systems or oxygen depletion at the steel surface, or both. As expected, higher corrosion rates were found at cracked locations than at uncracked locations in most spans. In the epoxy span, the corrosion rates were low, especially at uncracked locations, but increased continuously with time. In Span G, the equipment limitations made it impossible to measure the corrosion rates in the first three years due to the very low conductivity of the concrete surface (hydrophobic penetrating sealer in System G). In general, the corrosion rates of all systems are still low; more time is necessary to evaluate further their effectiveness.
In 1997, the measured resistivity was relatively low in most spans (8-16 kΩ cm),
probably due to the high moisture content in the new concrete. It increased with time in all spans except the epoxy and the control spans. In the epoxy span, the resistivity decreased with time and was probably due to deterioration of the epoxy coating.
3.3 Measurements on the rebar ladders
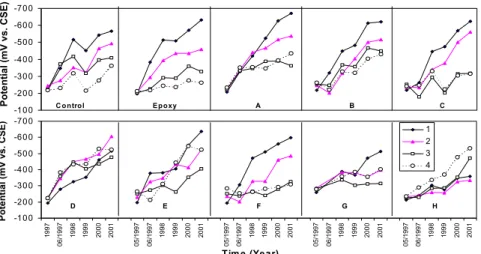
Figure 4 shows the half-cell potentials measured on the special rebar ladders for each span. In all spans, it can be seen that the half-cell potentials became more negative with time. Half-cell potentials had the most significant change on the top bar (bar 1 with 13 mm cover, faster chloride ingress) and less change on the lower bars (bars 2, 3 and 4 with thicker covers), as expected. Similarly, the corrosion rate was much higher on the top bar (thinnest cover) than on the second bar in most spans. On Spans E and G, a horizontal crack and rust stains along the top rebar were noticed. This is consistent with the high corrosion rates observed at these locations in 2001. In Spans D and H, the corrosion rate was quite low on both the first and second bars.
3.4 Chloride ion content
The total content of chloride ions by weight of concrete was determined according to ASTM C114-00. Figure 5 illustrates the chloride profiles at four different times for each test span. In general, the chloride ion content increased over time and decreased with concrete depth. At depths of 25-50 mm, the chloride content in all spans was below the threshold value of 0.1% by weight of concrete8 after the first two winters. By 2001, all concretes had a chloride content exceeding the critical threshold value. At depths of 50-75 mm (rebar level), all concretes had a chloride ion content below the threshold value after 5 years, suggesting that corrosion of the reinforcing steel was unlikely at uncracked locations. However, localized corrosion was very likely to have developed at cracked locations due to the high chloride content readily available at the rebar level. Of all systems tested, the concrete in Spans E, F and H (but not in Span G with its added sealer) effectively blocked the penetration of chloride ions.
0.0 0.2 0.4 0.6 0.8 1.0 Corros ion ra te (uA c m -2) C-97 C-98 C-99 C-00 C-01 0.0 0.2 0.4 0.6 0.8 1.0 Control Epoxy A B C D E F G H Span Corros ion ra te (uA c m -2)
UC-97 UC-98 UC-99 UC-00 UC-01
Figure 3: Corrosion rate measured at cracked (C) and uncracked (U) locations.
-70 0 -60 0 -50 0 -40 0 -30 0 -20 0 -10 0 1997 06/ 1997 1998 1999 2000 2001 05/ 1997 06/ 1997 1998 1999 2000 2001 05/ 1997 06/ 1997 1998 1999 2000 2001 05/ 1997 06/ 1997 1998 1999 2000 2001 05/ 1997 06/ 1997 1998 1999 2000 2001 Pot e nt ial ( m V vs. CSE) 1 2 3 4 D E F G H -70 0 -60 0 -50 0 -40 0 -30 0 -20 0 -10 0 P o te ntia l (mV v s . C S E ) C o n tro l E p o xy A B C Tim e (Year)
Figure 4: Half-cell potential measured on the embedded rebar ladders (concrete cover thickness: 13, 25, 38, 50 mm for bars No. 1, 2, 3, 4).
4. Comparison and ranking of performance of corrosion inhibiting systems
As expected in such a comparative study, a particular system may provide the best performance of the group in a particular set of tests and provide less satisfactory performance in some other tests. To provide a meaningful comparison of the field performance of the different systems, a simple approach was developed. Several sets of corrosion-related measurements in the field were selected. For each set of measurements, the systems were ranked from 1 (most effective) to 10 (least effective) based on the measured performance. To determine the overall ranking for field performance, the individual ranks were averaged for each system. Complete details can be found elsewhere.5
0.0 0.1 0.2 0.3 0.4 0.5 0.6 Span C h lo ri de C o nt e n t (% b y w e ig h t o f co nc ret e ) 0-13 mm 13-25 mm 25-50 mm 50-75 mm Low High Content 19 9 7 19 9 8 2000 2001 Control A B C D E F G H 199 7 199 8 20 0 0 20 01 1997 199 8 200 0 20 01 1997 1998 200 0 200 1 19 9 7 19 9 8 2000 2001 199 7 19 9 8 20 0 0 2 001 1997 1998 2000 2001 1997 199 8 200 0 20 01 199 7 19 9 8 20 0 0 2 001
Figure 5: Total chloride ion content measured on concrete cores from the bridge. System H had the best overall performance in the field (score of 3.7 compared to a range of 4.4 to 6.9 for the others systems). The epoxy-coating system and System F (organic-based admixture) had a relatively good performance. Both of them had an overall ranking of 4.4, which is considered better than the ranking of 5.8 obtained for the control system. It is crucial to mention that the field performance results obtained were based on a short period of time (5 years). The relative performance of these corrosion-inhibiting systems may change after a longer time. Further monitoring is required to validate or modify the early findings.
5. Summary and Conclusions
The field performance of ten 34-m spans of a bridge barrier wall repaired with 9 corrosion-inhibiting systems and 1 control system were evaluated for 5 years. Initiation of corrosion was detected early on the main reinforcement at cracked locations, and on the special embedded rebar ladders with low concrete cover thicknesses (13 and 25 mm). The effects of the corrosion-inhibiting systems were also detected and compared based on the measured values of half-cell potential, corrosion rate, electrical resistivity and chloride ion content obtained.
In general, the systems including a concrete admixture inhibitor performed better in the field than the systems composed of rebar coatings or concrete coatings. More specifically, System H (calcium nitrate admixture) consistently provided the best performance of the group. It was followed by System F (alkanolamine admixture) and the epoxy-coating system. However, the latter showed signs of decreasing performance over the years, due to the growing damage of the epoxy coating.
Further monitoring is needed to confirm or possibly modify the above conclusions, as the corrosion rates of the main reinforcement, although increasing, were still considered low after 5 years.
6. Acknowledgements
The financial and technical contributions of our project partners are gratefully acknowledged, namely: Ministère des Transports du Québec (MTQ), Axim Concrete Technology, Caruba Holdings, Euclid Admixture Canada, Israel Richler Trading, Master Builders Technologies, Sika Canada, W.R. Grace & Co, the Regional Municipality of Peel, and IRAP.
7. References
1. Treadaway, K.W., and Russel, A.D., "Inhibition of the corrosion of steel in concrete - Part 2", Highways and Public Works, 36, 1968, pp. 40-41.
2. Berke, N.S., "Corrosion Admixtures in concrete", Corrosion 89, Paper 445, NACE, Houston, Tx, 1989.
3. Rosenberg, A.M., Gaidis, J.M., Kossivas, T.G., and Previte, R.W., "Corrosion Admixture formulated with calcium nitrite for use in reinforced concrete", Chloride Corrosion of Steel in Concrete, America Society for Testing and Materials, Philadelphia, STP 629, 1977, pp. 89-99.
4. Berke, N.S., and Weil, T.G., "World-wide review of corrosion Admixtures in concrete", Advances in Concrete Technology, 1992, pp. 899-924.
5. Qian, S.Y., Cusson, D., "Electrochemical evaluation of the performance of corrosion-inhibiting systems in concrete bridges," Cement and Concrete Composites, August 2003, 31 p.
6. Cusson, D. and Mailvaganam, N., “Monitoring and Evaluation Techniques for Corrosion-Inhibiting Systems in Reconstructed Bridge Barrier Walls,” Concrete
International, 21(8), August 1999, pp. 41-47.
7. Cusson, D., and Repette, W., “Early-age cracking in reconstructed concrete bridge barrier walls,” ACI Materials Journal, 97(4), July/August 2000, pp. 438-446.
8. Stoltzner, E., Knudsen, A. and Buhr, B., “Durability of marine structures in denmark,” In Proceedings of the Int. Conf. on Repair of Concrete Structures, From
Theory to Practice in a Marine Environment, Editor: Aage Blankvoll, Norway, 1997