A Case Study of the Formation of an Eastern Pacific
Tropical Cyclone
by Terence Kung
B.S. Atmospheric and Oceanic Sciences (1997) University of Wisconsin at Madison
Submitted to the Department of Earth, Atmospheric and Planetary Sciences in Partial Fulfillment of the Requirements for the Degree of
MASTER OF SCIENCE IN METEOROLOGY at the
MASSACHUSETTES INSTITUTE OF TECHNOLOGY June 1999
© 1999 Massachusetts Institute of Technology. All Rights Reserved.
Author ... ... ... ... ...
Department of Earth, Atmospheric and Planetary Sciences May 6, 1999 Certified by ... ... Kerry A. Emanuel Professor of Meteorology Thesis Supervisor A ccepted by... Ronald G. Prinn
I MASSACHUSETTS INSTITUTE Department Head
OF TECHNOLOGY
JUN 0 1 1999
LIBRARIES
A Case Study of the Formation of an Eastern Pacific Tropical Cyclone by
Terence Kung
Submitted to the Department of Earth, Atmospheric and Planetary Sciences on May 7, 1999 in partial fulfillment of the requirements
for the Degree of Master of Science in Meteorology
Abstract
A case study is performed to investigate the nature of tropical cyclogenesis in the eastern Pacific Ocean. Focus is given to the formation and development of the initial circulation which eventually intensified into Hurricane Fefa. Using satellite imagery, the author studies the development of convective activity in the genesis region. Gridded reanalysis data are used to document the synoptic-scale flow, with emphasis on tracing the easterly wave which is associated with the formation of Fefa. The data show that the easterly wave propagated across the Caribbean Sea and the Central American mountains, and the initial circulation developed while the wave had moved into the eastern Pacific. The wave is found to have moved through an unstable basic state while it was in the Caribbean, which is favorble for its growth and maintenance. Two phenomena are observed prior to the formation of the low-level circulation. These include an easterly jet in the eastern Pacific that may have been associated with the blocking effect of the Central American mountains, and a southerly wind surge into the monsoon trough region.
In addition, aircraft observations collected during Tropical Experiment in Mexico are used to study the evolution of the mesoscale system. Initially, a circulation in the middle troposphere with a cold core in the boundary layer, and a shear line located to the west were found. One day later, a low-level warm core vortex had developed, and it was displaced from the mid-level vortex. It is suggested that the low-level vortex formed from the spin-up of the monsoon trough, independent of the mid-level vortex.
Thesis Supervisor: Kerry A. Emanuel Title: Professor of Meteorology
Acknowledgements
I would like to thank professor Kerry Emanuel for stimulating my interest in the problem of tropical cyclogenesis, and suggesting this topic to me. I thank him for his guidance, constructive criticisms along the way, and reviewing several drafts of my thesis. I would also like to thank professor Alan Plumb for providing me financial support, and acting as my academic advisor. I value the friendships with fellow graduate students in the department. I appreciate their warmth and concerns with me.
I thank Lodovica Illari for supplying me tapes of the NCEP/NCAR reanalysis data. I also thank Luis Farfan of the University of Arizona for sending me the satellite images, and helping me out in some displaying problems.
I thank all brothers and sisters in the Boston Chinese Evangelical Church for their love and spiritual support. Most of all, I thank my parents for their love, support and understanding.
Table of Contents
1 1.1 Introduction 11
1.2 Overview of the Tropical Experiment in Mexico (TEXMEX) and Hurricane
Fefa 13
1.3 Review of previous work on tropical cyclogenesis 14
2 Data and analysis methods 23
2.1 Doppler radar data 26
2.2 In situ data 29
2.3 Satellite data 30
2.4 NCEP/NCAR reanalysis data 30
3 Observations of the synoptic-scale circulation 31
4 Aircraft data analysis results 51
4.1 Flight 1P 51
Flight 2E 58
Flight 3P 62
4.2 Comparison to the genesis of Guillermo 70
5 Summary and suggestions for Future Work 73
List of Figures
Figure 2.1: Tracks of aircraft-estimated vortex centers of TEXMEX cases that developed
into hurricanes (from D. Raymond) 24
Figure 3.1: Winds and relative vorticity from the NCEP/NCAR reanalysis at 700 mb 32
Figure 3.2: Winds and relative vorticity from the NCEP/NCAR reanalysis at 1000 mb 37
Figure 3.3: Infrared images from GOES 41
Figure 3.4: Absolute vorticity from the NCEP/NCAR reanalysis at 700 mb 45 Figure 4.1: Observations in pre-Fefa MCS during flight IP 52 Figure 4.2: Observations in pre-Fefa MCS during flight IP (cont'd) 57 Figure 4.3: Observations in pre-Fefa MCS during flight 2E 59 Figure 4.4: Observations in Tropical Storm Fefa MCS during flight 3P 63
Chapter 1
1.1 Introduction
Tropical cyclones are fascinating natural phenomena for many meteorologists. One reason is that over the years these storms have caused enormous loss of human lives and significant economical impact. The second reason is that they are still not fully understood and pose great challenges to the scientific community. An outstanding problem in current tropical cyclone research is their formation, or the genesis problem. It is not only a subject of scientific interest, but also of practical interest. It is because many mariners and coastal or island communites are quite vulnerable to sudden formation of tropical cyclones. If the time and location of their formation can be well predicted, more advanced warnings can be given to these communities and thereby human
and economic loss can be minimized.
The necessary environmental conditions for tropical cyclones to form have been well established. They include large values of low-level relative vorticity, a coriolis parameter greater than some finite value, weak vertical wind shear, and sea surface temperatures exceeding 260C (eg. Gray 1968). However, the sufficient conditions for their formation are less clear, as evidenced by the fact that only a small fraction of the disturbances observed in the Tropics grow into tropical storms even when the necessary conditions are met. One of the difficulties is that there are limited data over the oceans where tropical cyclones form. A detailed observation of the formation process is needed to further our understanding of this problem.
The subtropical eastern Pacific Ocean is the most prolific region in the world for the formation of tropical cyclones. The tropical cyclones in this region are often associated with African easterly waves (Avila and Pasch 1992). While these easterly waves have often been observed to trigger tropical cyclones, the real mechanism has not yet been well understood. It is not
clear whether they transform directly into tropical cyclones, or they merely provide a favorable background environment for pre-existing tropical disturbances to develop into tropical cyclones.
The purpose of this study is to provide a detailed documentation of the formation of Tropical Cyclone Fefa in the eastern Pacific. Fefa formed during the Tropical Experiment in Mexico (TEXMEX), an intensive research program on tropical cyclone formation in the eastern North Pacific. Aircraft observations provide detailed mesoscale data during the cyclone's formation. Attention is given to the thermodynamics of the genesis process. In addition, NCEP/NCAR reanalysis, received on 2.50 x 2.50 grids, are used to study the characteristics of the large-scale environment. Particular attention is given to the evolution of the easterly wave associated with the formation of Fefa.
In section 1.2, an overview of TEXMEX and hurricane Fefa is given. The next section contains a thorough review of previous studies of tropical cyclogenesis.
Chapter 2 gives a description of the data sets and methods of analysis. Chapter 3 describes the observations of the large-scale environment. Chapter 4 contains an analysis of the aircraft data. A summary of the overall findings of this study and suggestions for future work are given in the final chapter.
1.2 Overview of the Tropical Experiment in Mexico (TEXMEX) and Hurricane Fefa
One of the outstanding problems in tropical cyclone research is why so many disturbances in the tropics fail to develop into tropical cyclones. Rotunno and Emanuel (1987, hereinafter RE) suggested that convective downdrafts in the core of the incipient disturbances bring air of low equivalent potential temperature (0e) into the boundary layer, suppressing further convection and thereby preventing their subsequent development. For the disturbances to further develop, the negative effect of the downdrafts has to be overcome. In principle, this can be accomplished by an increase of the equivalent potential temperature in the middle troposphere, an increase of relative humidity so that evaporation of rain is suppressed, and/or an increase of wind speed in the boundary layer so that the sea surfaces fluxes can keep replenishing the Ge in that layer. The simulations of RE and Emanuel (1989), in which a warm core vortex was used in the initial state, suggested that an increase of Oe in the middle troposphere is necessary for tropical cyclogenesis. The main goal of TEXMEX was to test a hypothesis stated in the TEXMEX Operations Plan (Emanuel 1991): The elevation of ee in the middle troposphere just above a near surface vorticity maximum is a necessary and perhaps sufficient condition for tropical cyclogenesis. It was assumed that the elevation of
ee
is accomplished by deep convection bringing high 8e to the middle troposphere, as occurred in the models initialized by warm core vortices. In the case study of the genesis of hurricane Fefa, analysis showed that there was a moderate increase of ee at 3 km altitude, and the pre-Fefa system evolved quickly into a tropical storm. The TEXMEX hypothesis is not rejected, at least, by this case study. But in another TEXMEX case study ie. the genesis of hurricane Guillermo (Bister and Emanuel 1997, hereinafter BE), observations suggested that the increase of Oe in the middle troposphere is not a necessary condition for tropical cyclogenesis.During the first flight into the pre-Fefa system, the surface circulation is already strong, and it is displaced well to the west of the 700 mb circulation (Raymond et al., 1998). The fact that
no flights surveyed the earliest state of the system suggests that this case study may not be the most ideal one for testing the TEXMEX hypothesis. But the study is interesting in its own right, partly because the formation of Fefa looks so different from the formation of Guillermo. This suggests that different mechanisms might have taken place, or played the major roles, in the genesis process in the two cases. One unresolved question posed in BE is whether the downward extension of the cold core vortex is a necessary condition for the development of the warm core vortex. The case study of Fefa serves to further address this question. Moreover, the focus of BE was on the mesoscale aspects. In this study, emphasis is also put on the large-scale environment. The premise of this study is that by combining detailed analyses of the large-scale data and the mesoscale data, one can obtain a more complete picture of the mechanisms involved in tropical cyclogenesis.
1.3 Review of previous work on tropical cyclogenesis
Two major theories have been proposed to explain the instability mechanism responsible for the growth of tropical depression. The first one is referred to as Conditional Instability of the Second Kind (CISK), proposed by Charney and Eliassen (1964). This mechanism states that tropical depressions intensify by utilizing the Convective Available Potential Energy (CAPE) through a cooperative feedback between cumulus clouds and the large-scale flow. In the region where there is low level cyclonic vorticity, frictional convergence at the surface forces vertical motion. The rising parcels are warmed relative to the environment by latent heat release. This warming is balanced by an in-up-out seconary circulation that provides convergence in the lower troposphere, which increases the low level vorticity through vortex stretching. The increased vorticity then leads to increased frictional convergence at the surface and thereby more vertical motion and latent heat release. Thus a positive feedback loop is established. The CISK mechanism does not require large-scale saturation, but it does require that the atmosphere be conditionally
unstable. The existence of CAPE in the atmosphere associated with conditional instability has been challenged (eg. Xu and Emanuel 1989). They showed that soundings from the deep tropics are nearly neutral to reversible ascent in the lower and middle troposphere. Another important drawback of CISK is that its closure is valid only after an incipient vortex has attained sufficient strength and organization. It does not explain how the incipient vortex forms. As noted by Ooyama (1982), this theory was never intended for inquiry into the question of tropical cyclogenesis.
More recently, an alternative theory to CISK, known as air-sea interaction theory or Wind-Induced Surface Heat Exchange (WISHE) has been proposed (Emanuel 1986; RE 1987; Emanuel 1989). The basic idea of WISHE is that tropical cyclones intensify and maintain themselves entirely by self-induced anomalous fluxes of moist enthalpy from the sea surface, which are primarily determined by the magnitude of the surface winds. An advantage of WISHE is that it does not require any contribution from preexisting CAPE in the troposphere. However, the WISHE mechanism requires that an initial vortex be sufficiently strong in order for a cyclone to develop into hurricane intensity in a reasonable time. The theory does not account for the processes by which the finite amplitude rotary system (or 'starter vortex') itself forms.
As suggested above, it is important to know how the 'starter vortex' forms in order to solve the problem of tropical cyclogenesis. One proposed source of these initial vortices is given by the propagation of synoptic-scale easterly waves. These waves generally originate over western Africa, move across the Atlantic, and eventually reach the Caribbean Sea (eg., Burpee 1972; Reed et al., 1988). They typically have a cyclonic vortex at midddle levels with a weak cold core below the vortex and a warm core above, as required by thermal wind balance. The waves often manifest themselves as vorticity anomalies elongated into the form of a trough aligned in the northeast-southwest direction (eg., Shapiro 1986). When the waves move across Central America and enter the eastern Pacific, they apparently gain energy (Nitta and Takayabu 1985). The reason for this is
still unknown. Observations from satellite imagery suggest a link between the passage of easterly waves over the Caribbean and the subsequent formation of tropical cyclones in the eastern Pacific. Avila and Pasch (1992) were able to associate each eastern Pacific tropical cyclone with a synoptic-scale easterly wave from Africa for the 1991 hurricane season. However, it is not clear from observations what physical mechanisms may result in the reduction of horizontal scale of the waves. Besides, it is known that a large fraction of the easterly waves fail to transform into hurricanes (Avila 1991). While Shapiro (1986) showed that strong African waves can maintain their structure while propagating across the Atlantic Ocean and into the eastern Pacific, there have been suggestions that eastern Pacific easterly waves might develop due to local or upstream instabilities, instead of being the same waves that formed in Africa (Molinari et al., 1997).
From a theoretical perspective, Shapiro (1977) proposed a storm genesis criterion based on the nonlinear dynamics of the easterly wave. Attempts have been made to simulate the transformation of an easterly wave into a tropical storm (Kurihara and Tuleya 1981; Kurihara and Kawase 1985). They showed that diabatic heating due to the condensation of water vapor is essential for the development of the wave into a tropical storm. They also showed that for westward wave propagation, an easterly shear in the basic flow is favorable for wave growth because it helps to advect warmed upper air in the same sense as the phase propagation of the wave. Pytharoulis (1999) used the United Kingdom Meteorological Office (UKMO) Unified model to show that the transformation of an initially cold core African easterly wave into a warm core tropical cyclone took place after strong convective bursts. He emphasized the importance of the role of regions with enhanced latent heat fluxes along the track of these waves for strong convective events. He further showed that evolution over warm sea surface temperatures (SST) has
enhanced likelihood for development.
Some researchers have emphasized the role of the orography of Central America on eastern Pacific tropical cyclogenesis. One proposed mechanism is that an easterly wave incident on the Central American mountains is modified by the topography (Zehnder 1991). That author showed that there is a southward deflection of the incident flow by the anticyclonic circulation over the mountains and a reduction of planetary vorticity. To conserve potential vorticity, cyclonic vorticity must occur in the lee of the mountains. The area of vorticity has a structure that is consistent with the circulations that intensify in the WISHE theory. Another mechanism related to the topographic influence of the Central American mountains that does not require a synoptic-scale easterly wave to propagate across the mountains was proposed by Mozer and Zehnder (1996). They showed that when there is a stably stratified easterly barotropic flow over idealized topography representative of the Sierra Madre, a barotropically unstable jet results from the blocking of the low level flow by the topography. Low level vorticity maxima are continuously produced downstream of the mountain, resulting in a low level easterly wave train in the region that corresponds to the eastern Pacific. The authors suggested that surface fluxes of heat and deep convection in the Pacific would allow for a further intensification of the vorticity that developed in their study.
One different approach to the problem of tropical cyclogenesis places emphasis on external forcing. As early as in the 50's, the importance of eddy angular momentum fluxes associated with upper-level wave asymmetries in the environment of mature tropical cyclones was recognized (Pfeffer 1958). Observational studies have demonstrated an initiation of the cyclogenesis process through interaction with surrounding upper-tropospheric synoptic systems, particularly upper-level troughs (eg., Riehl 1948; McBride and Keenan 1982). Sadler (1976) showed that tropical cyclone formation in the western North Pacific often occurs in association with intense cyclonic cells embedded in the Tropical Upper Tropospheric Trough (TUTT). Observations during the
Australian Monsoon Experiment (AMEX) document the formation of tropical cyclones Irma and Jason (Davidson et al., 1990). Their work suggest that both cyclones formed in association with an equatorward-moving TUTT. But while Sadler hypothesized that the upper-level troughs played a kinematic role in facilitating the development of the tropical cyclone's characteristic upper-level outflow channel, other researchers (eg., Holland 1983) demonstrated that the role of the adjacent upper-level troughs in developing tropical cyclones is to bring about large imports of relative angular momentum by eddy fluxes at outer radii in the upper troposphere. Challa and Pfeffer (1990) further substantiated this idea by using a three-dimensional primative equation model to illustrate rapid hurricane development in cases of strong eddy momentum flux convergence toward the storm center. Using a moist nonlinear balanced model, Montgomery and Farrell (1993) showed that an upper tropospheric potential vorticity (PV) anomaly approaching a weak surface cyclone may result in the spin-up of the surface cyclone. Molinari et al. (1995) stressed the importance of scale reduction of the upper-tropospheric PV anomaly by the upper-tropospheric anticyclone associated with the tropical cyclone prior to their superposition. They noted that this helps to reduce the magnitude and duration of vertical wind shear associated with the upper-tropospheric PV anomaly which would hinder the tropical cyclone's development. In our study, there was no evidence in the NCEP reanalysis data of any independent upper-tropospheric positive PV anomalies in the vicinity of the region where hurricane Fefa formed, though, to be sure, the eastern Pacific is nearly devoid of data.
One important source of initial cyclonic circulations over the eastern Pacific region is Mesoscale Convective Systems (MCSs). The MCSs form over inland Mexico or over the Central American mountains. They propagate westward under the influence of the tropical easterlies, and eventually move over the warm waters of eastern Pacific, where they may evolve into hurricanes. MCSs typically have a horizontal scale of hundreds of kilometers, and a lifetime of hours. In ~^_I__^ __~___ _~L _^____ ~___I *L*II--*sUILIIP~~XIU
satellite imagery, MCSs can be identified as the large areas of cloud with temperatures lower than
-700C. Studies show that some MCSs develop an inertially stable, warm core vortex in a trailing
stratiform region referred to as Mesoscale Convective Vortex (MCV) (Brandes 1990; Chen and Frank 1993). The MCVs have a horizontal scale of approximately 100 to 200 km, and the vorticity maximum is in the middle troposphere. Bosart and Sanders (1981) tracked a mid-latitude MCS in an observational study. When it was still over the continent, it developed a mid-level vortex but there was no surface circulation. But later when the system moved over the ocean, the system developed into a tropical cyclone. Velasco and Fritsch (1987) found evidence from satellite imagery that MCSs lead to tropical cyclogenesis. They suggested that when these MCSs propagate into a large-scale environment favorable for tropical cyclogenesis, the generated MCV may play a catalytic and crucial role in initiating tropical storm development. The question of how MCSs form is still unanswered, and is beyond the scope of this study.
Theories have been proposed to explain the formation and maintenance of MCVs. Latent heat release due to convection warms the stratiform-cloud region of an MCS and evaporation of rain cools the region below the cloud, sharpening the potential temperature gradient near the cloud base. Mesoscale convergence and stretching that develops just above the cloud base (Houze 1977) produces a positive PV anomaly. Raymond and Jiang (1990) (hereinafter RJ) proposed that the interaction of the PV anomalies with a sheared environment can produce enough low-level lifting to feed the observed convection. Chen and Frank (1993) studied the formation of the mesovortex by a three-dimensional hydrostatic mesoscale model. They suggested that within a saturated stratiform rain region, the local Rossby radius is reduced to a scale below the scale of the stratiform rain region of the MCS due to the reduction of vertical stability in the saturated region. As a result, gravity waves cannot be sustained. This facilitates the conversion of latent heating to warming and creates balanced mesovortices within the stratiform region.
In an observational study, Fritsch et al. (1994) (FMK, hereinafter) documented a case in which a warm core mesoscale cyclone forms in conjunction with a mid-latitude MCS, and through repeated cycles of deep convection, it strengths and grows. In their case, the PV and potential temperature patterns were basically the same as those postulated by RJ. FMK found that in most of the redevelopment cycles, each outbreak of new convection occurred well within the vortex circulation, usually near its center. Note that in FMK, the mesovortex developed in an atmosphere characterized by a low-level southwesterly jet of high
ee
air overlain by a deep, warm, midlevel layer of slightly weaker wind speeds and very weak vertical wind shear. The low-level jet plays the role of feeding new convective developments. Though many studies have documented cases where MCSs developed into tropical depressions, a fundamental problem is that in MCS events the midlevel vortices are attended by surface mesohighs with anticyclonic circulations. The persistence of high surface pressure presents great difficulties in arguing that the midlevel vortices can be instrumental in initiating tropical cyclogenesis. For a tropical depression to form, the surface mesohigh must be replaced by a mesolow with cyclonic circulation. One way to achieve this is by a downward migration of the midlevel vortex. Once the vortex migrates downward to the surface and becomes in contact with the oceanic heat and moisture source, the air-sea interaction instability can get started and the surface cold core may transform into warm core. But the question still remains as to what physical mechanism is responsible for the downward migration of the midlevel vortex. Rogers (1997) proposed that a possible mechanism is increasing the strength of the PV anomaly by initiating convection within the existing anomaly. Strengthening the PV anomaly will increase the penetration depth (Hoskins et al., 1985). It is conceivable that after several convective redevelopments, the cyclonic circulation will eventually reach the surface. By a three-dimensional mesoscale model, Rogers attempted to simulate the MCS event in FMK, and found that the cyclonic circulation penetrated approximately 100 mb closer to the surface. As in FMK, theconvection is initiated by the advection of high Oe air within a strong low-level jet ascending over the cold pool left from the previous convective cycle.
Some researchers have emphasized the importance of vortex interaction in tropical cyclogenesis. Ritchie et al. (1993) hypothesized that certain configurations of the midlevel PV anomalies, or certain configurations of the large-scale flow would lead to a merger of the mesovortices, resulting in a large rotation center of enhanced PV, and thereby an increased penetration depth. In a study of the formation of Typhoon Irving during the Tropical Cyclone Motion (TCM-92) experiment, Ritchie and Holland (1997) noted a cooperative interaction between environmental and mesoscale dynamics. They found that besides the interactions between midlevel vortices which lead to a combined vortex of greater depth, there is an interaction between midlevel vortices and the low-level circulation which produces a development downward of the midlevel vorticity, and strengthens the surface vortex. Simpson et al. (1997) investigated this scale-interaction in other cases of tropical cyclone formation, and emphasized the importance of the spinup of the monsoon trough in the background, which provides enhanced conditions for the downward development of the midlevel vortices to the surface.
There is yet another theory for the downward migration of the midlevel vortex. BE hypothesized that evaporation of rain below the stratiform precipitation region increases the
relative humidity in the lower troposphere and leads to a downdraft that advects the vortex downward. Using an axisymmetric model, they showed that if the precipitation lasts long enough, the vortex will be able to reach the boundary layer. As a result, convection redevelops and this leads to a further increase of vorticity below the maximum heating and the formation of a warm core near the surface.
In summary, we now have a modest understanding of the mechanism by which a tropical storm intensifies. However, no well-accepted, closed theory for the formation of the initial
circulation yet exists. Plenty studies have shown that easterly waves are intimately related to tropical cyclogenesis. But the mechanism responsible for the transformation of these waves into tropical cyclones is not completely clear. For genesis in the eastern Pacific region, it is apparent that the Central American mountains play a role. But questions still remain as to what their exact role is and how important it is compared to other factors. The influence of upper-level PV anomalies is not well understood. It is not known how important in practice they are for tropical cyclogenesis, and in what exact way they initiate the formation process. The problem of how MCSs evolve into tropical cyclones is also not completely solved. Various mechanisms have been proposed for the downward migration of the mid-level vortex to the surface. But it is not known which mechanism is dominant in practice. Furthermore, there still might be other mechanisms not yet discovered. Our understanding of tropical cyclogenesis will remain incomplete until all the aforementioned problems are solved.
Chapter 2
Data and analysis methods
TEXMEX was designed to observe intensively the process of tropical cyclogenesis, with the principal aim of testing the aforementioned hypothesis about how genesis takes place. This hypothesis was tested by making measurements inside developing and nondeveloping cloud clusters, using the WP-3D aircraft operated by the National Oceanic and Atmospheric Administration's (NOAA) Office of Aircraft Operations and the National Center for Atmospheric Research (NCAR) Lockheed Electra. Both aircraft were equipped to make in situ measurements of standard meteorological variables, and the WP-3D had the additional capability of deploying Omega dropwindsondes (ODW) and making detailed Doppler radar measurements. The aircraft measurement systems are described in detail in the TEXMEX Operations Plan (Emanuel 1991).
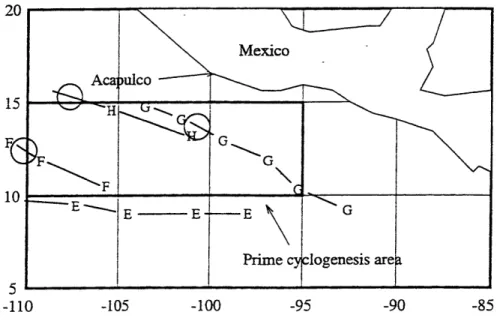
The eastern tropical North Pacific region was selected for the field program, as it has the highest frequency of genesis per unit area of any region worldwide (Elsberry et al., 1987) and the main genesis region is only a few hundred kilometers south of Acapulco, Mexico, which has an airport well suited to research flight operations. The field phase of the experiment began on 1 July and ended on 10 August 1991. During this project there were six intensive operation periods (IOPs) that surveyed one short-lived convective system, one nondeveloping mesoscale cloud cluster, and four cloud clusters that ultimately developed into hurricanes. The tracks of those systems that developed into hurricanes are shown in Fig. 2.1. Detailed description of the aircraft flight operations are provided in the TEXMEX Data Summary (Renno et al., 1992).
5. . . ,
-110 -105 -100 -95 -90 -85
Figure 2.1: Tracks of aircraft-estimated vortex centers of TEXMEX cases that developed into hurricanes (from D. Raymond). Circle shows where each disturbance was declared a tropical storm by National Hurricane Center. E is for Enrique, F for Fefa, G for Guillermo and H for Hilda.
As the principal working hypothesis concerned thermodynamic transformations of the lower and middle troposphere, most flight operations were conducted near the 700-mb level and in the subcloud layer. Most of the NOAA WP-3D flights at 700 mb deployed ODWs, and the tail Doppler radar on the WP-3D operated almost uninterrupted through all of the flight operations. In order to maximize the temporal continuity of observations of evolving cloud clusters, while obeying operational contraints, the aircraft flew alternating missions at approximately 14-h intervals. Most flight missions lasted 7-9 hours, of which 1-3 hours were used in transit to the target area.
A case study of the genesis of hurricane Guillermo has been performed (BE). In this work, the MCS that developed into hurricane Fefa was chosen as the case study, because it has the best documented data apart from the Guillermo case. It has relatively good data coverage. The early state of the system was captured during the first flight. The system also has an interesting low level
cold core structure like the pre-Guillermo system. This study serves as an additional case study to test the hypothesis made in the BE study, and also allows us to do a comparison between the two
cases.
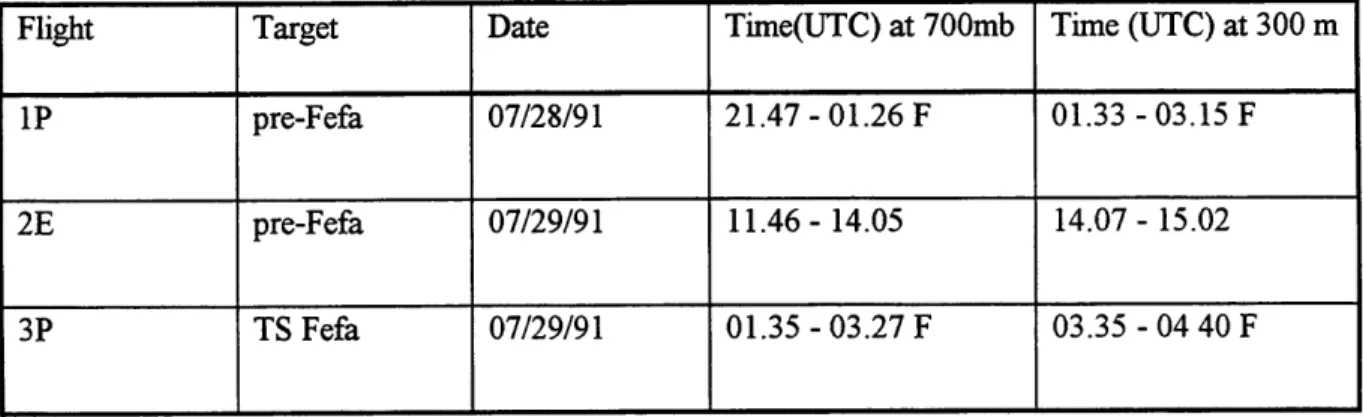
The MCS that developed into hurricane Fefa on 31 July 1991 was the target object of IOP4 from 28 July 1991 to 29 July 1991. Three flights were flown during IOP4. The first and the third flights were flown with the WP-3D. These flights are labeled IP and 3P, respectively. The second flight was flown with the Electra, and is labeled 2E. The flights are summarized in table 2.1. Each flight consisted of several flight legs at 3 km (700 mb), and several more at 300 m.
Flight Target Date Time(UTC) at 700mb Time (UTC) at 300 m
IP pre-Fefa 07/28/91 21.47 - 01.26 F 01.33 - 03.15 F
2E pre-Fefa 07/29/91 11.46- 14.05 14.07- 15.02
3P TS Fefa 07/29/91 01.35 - 03.27 F 03.35 - 04 40 F
Table 2.1 Summary of flights into (pre-)Fefa. F is for following day, TS is for tropical storm
In the stratiform precipitation areas, measurements made by the the ODWs often showed 100% relative humidity, indicating wetting of the instruments. Owing to the wetting, the ODW data are not used in the data analysis. Geostationary Operational Environmental Satellite (GOES) imagery was obtained from L. Farfan of the University of Arizona.
2.1 Doppler radar data
The characteristics of the WP-3D Doppler radar are given in Table 2.2. The unambiguous range and velocity are dictated by the pulse repetition frequency and the wavelength. The number of samples per each radar grid volume depends on the distance of the grid volume from the aircraft. There are at least 32 samples per each radar grid volume. The number of samples per grid volume increases with distance from the aircraft, being 128 for distances larger than 38.4 km.
Radar characteristic Value
Frequency 9.315 GHz
Wavelength 3.22 cm
Pulse length 0.55 ps
Pulse repetition frequency 1600 per sec
Beam width -along track 1.350
Beam width -across track 1.900
Unambiguous velocity 12.88 m/s
Unambiguous range 93.75 km
Table 2.2 The characteristics of the NOAA WP-3D aircraft's Doppler radar
At least two beams from different angles are needed for the determination of the three dimensional wind. In TEXMEX the WP-3D Doppler radar was used in the Fore-Aft Scanning Technique (FAST) mode. In this mode, the antenna tilt angle, defined forward or aft from the perpendicular to the ground track, is changed between each rotation of the antenna about the aircraft's longitudinal axis.
When FAST is used, Doppler velocities are contaminated by the component of the velocity of the aircraft in the direction of the antenna. Thus, wind measurement is prone to errors in the aircraft's ground velocity. On the other hand, the FAST mode is practical when it is not possible to plan the flight pattern in advance. This is because the two components of the wind can be retrieved from one flight leg.
The Doppler data were mapped to a 3 x 3 x 0.5 km grid (0.5 km in the vertical direction) by averaging the data in the horizontal direction and interpolating in the vertical direction. The components of the aircraft's ground velocity and precipitation particle fallspeed in the direction of the antenna were subtracted from the radial velocities. The terminal fallspeed was estimated using empirical fallspeed -radar reflectivity relations (eg. see Marks and Houze 1987). The velocities were then unfolded using Bargen and Brown's method (1980). An independent measure of the wind speed is needed to unfold the velocities. The in situ aircraft measurement of wind was used for this purpose. Manual editing of the data followed automatic unfolding. Possible wrong unfolding was corrected for by adding a suitable number of unambiguous velocities (see Table 2.2) to any suspicious values. If the velocity still seemed unrealistic, the data were deleted. Most of the data deleted were from 0.5, 1.0, and 1.5 km altitudes. Data from these altitudes appear to have been compromised by sea clutter. Suspicious looking winds at higher altitudes were relatively rare, and probably owing to second or multiple trippers, or sidelobes. Finally, the three- dimensional wind was calculated from the two radial components in the following way (the computer program was written by John Gamache of Hurricane Research Division/ NOAA): First, the horizontal wind components were calculated assuming that the vertical component is zero. Then, the horizontal components were used to calculate the first guess of the divergence field. Starting from the lowest level, the following procedure was repeated for each level until a prescribed accuracy was attained or until 50 iterations had been done. The vertical wind component for the first iteration was
calculated from the anelastic continuity equation using vertical wind velocities from the level below, and the first guess estimate of divergence at the current level. Then, the three wind components were adjusted using the Least Squares method. The solution using this method usually converged to the desired accuracy in less than 50 iterations.
The data from separate flight legs had to be merged in a suitable way for the analysis of the whole MCS. A correction was made for the movement of the MCS by using a translation velocity, estimated by tracking the vortex center from one flight to the next, to move each data point to an appropriate position at some reference time. If more than one datapoint was moved to the same gridvolume, an average was calculated. The data were mapped to a 5 x 5 x 0.5 km grid, 0.5 km being the vertical resolution.
Sea clutter can affect the data far from the aircraft, and when the antenna is pointing downward. When the aircraft flies at 3 km altitude and the antenna is pointed horizontally, the mainlobe of the beam will touch the sea surface at 90 km range. The problem of sea clutter contamination becomes worse when the antenna is pointed downward. For example, when data are collected from an altitude of 1.5 km above the sea surface and the flight altitude is still 3 km, the mainlobe touches the sea surface as close as 45 km from the aircraft. The Doppler velocities in the case studied were noisy below 2 km altitude. Where data from below 2 km was used in the analysis, care was taken that any suspicious looking winds were deleted. In addition to sea clutter problem, errors in the in the measured ground speed of the aircraft and errors in the estimated precipitation fallspeed can affect the wind data.
Airborne radars have additional error sources compared to ground based radars. The error in the antenna pointing angles relative to the aircraft are smaller than 0.50, and can be accounted for. The antenna position with respect to the ground is calculated using information of the aircraft altitude, given by the Inertial Navigation System. The aircraft altitude angles have errors less than
II~--0.50. The location and the velocity of the aircraft are retrieved by integrating the accelerations given by the Inertial Navigation System. The ground velocity of the aircraft is subtracted from the Doppler velocities to eliminate the velocity component that is owing to the movement of the Doppler radar itself. Therefore, errors in the ground velocity will introduce errors in Doppler winds.
The error in the measured ground speed is about 2-3 m/s. The error introduced to Doppler velocities owing to an error in the ground speed is constant with height. Therefore, vertical differences of wind are not affected. Assuming an error of 1 m/s in the terminal fallspeed (see Atlas et al., 1973), the associated error in the horizontal wind speed can be estimated. The errors are less than 1 m/s for horizontal distances of more than 4 km from the flight track, assuming that no data farther than 4 km above or below the aircraft is used in the analysis. Moreover, for straight flight tracks this error is perpendicular to the flight track and shows up as spurious divergence or convergence.
2.2 In situ data
Intercomparison of instruments onboard NOAA WP-3D and the NCAR Electra was made using data from two sets of intercomparison flights in the beginning and at the end of the field experiment. The differences of the temperature and the dewpoint temperature measures by the two aircrafts were less than 0.3 K during both flights, and they were accounted for in the data analysis, by interpolating the differences in time and subtracting them from the data of the other aircraft. Data were excluded from the analysis if the magnitude of the vertical velocity exceeded 1 m/s, in order to minimize the effect of active convective updrafts and downdrafts on the analyzed fields. Data were also excluded if the measured dewpoint temperature exceeded the measured
temperature. However, no data were excluded from the 300 m analyses. Using the same method as with the Doppler data, the data were renavigated to the appropriate locations at a given time, and
80 s (10 km) averages were calculated. These averages were then analyzed by hand.
2.3 Satellite data
The Geostationary Operational Environmental Satellite (GOES-7) provided us with infrared and visible images during the TEXMEX project. The imagery has a horizontal resolution of 8 km and covers Central and North America from 70 to 550N and from 600 to 140'W. In this study we only use the infrared images. Hourly image data for the period of the TEXMEX project are interpolated to 0.10 x 0.10 area elements and converted to infrared brightness temperatures. The satellite imagery is used to track the disturbance that developed into hurricane Fefa. Particular attention is given to the location of convective regions.
2.4 NCEP/NCAR Reanalysis data
This recently released dataset is described in detail by Kalnay et al. (1996). In this study, we only used the wind fields. All the data have a temporal spacing of 6 hours (0000, 0600, 1200 and 1800 UTC) and are put on a 2.50 lat x 2.50 long grid. The dataset has 17 mandatory levels ranging from 1000 to 100 hPa.
Chapter 3
Observations of the synoptic-scale circulation
The tropical easterly wave that developed into Fefa was well observed. The wave first emerged from the northwest coast of Africa on 17 July. It then propagated across the Atlantic Ocean and the Caribbean Sea in the next eight days without development, and finally emerged over the eastern Pacific Ocean on 25 July, as indicated by the Balboa, Mexico, rawinsonde data (Rappaport and Mayfield 1992).
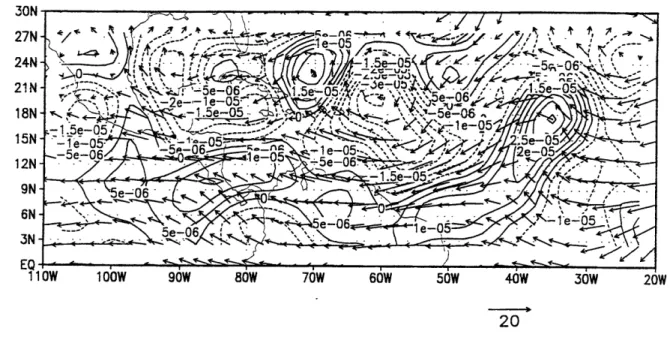
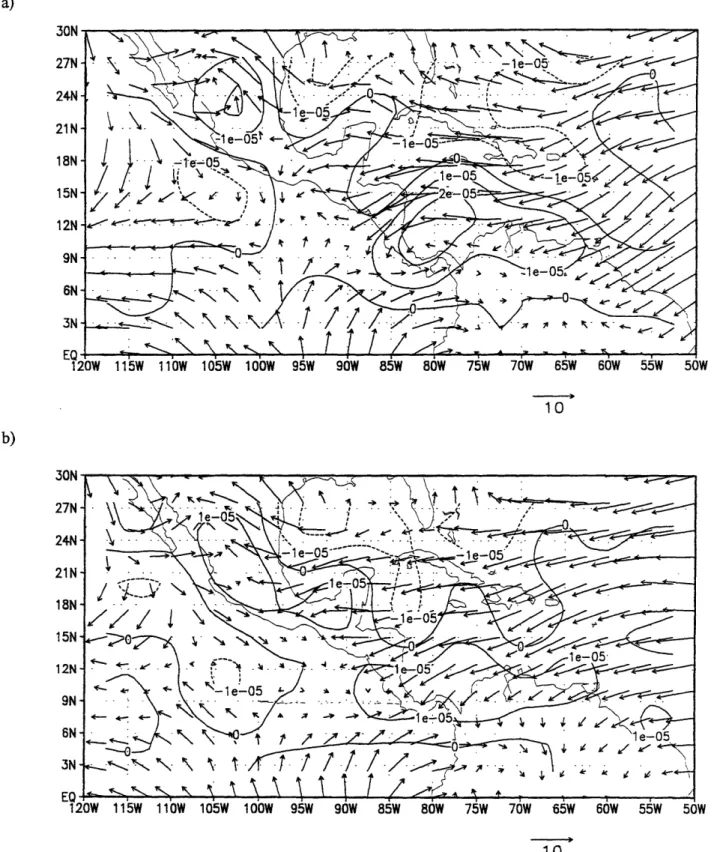
The location and propagation of the wave in the NCEP/NCAR re-analysis is shown in Fig. 3.1, which shows the wind vectors and isopleths of the relative vorticity at 700 mb. At 00 UTC 20 July (Fig. 3. la) the wave axis, which is defined by the location of the line of wind shift or vorticity maximum, was near 380W, with the axis tilted in a northeast-southwest direction. The latitudinal extent of the wave to the south seems to reach 100N or even further south. The relative vorticity contours show that there is a maximum of cyclonic vorticity located around the axis and it is flanked by regions of anticyclonic vorticity to the east and west. The wave had a similar position and structure at 500 mb and 850 mb (not shown), but it is better defined at the 700 mb level.
The wave propagated steadily westward at a speed of about 70 longitude per day. At 00 UTC 22 July the axis was near 500W (Fig. 3. lb). On the follwing day the wave propagation seems to accelerate and the wave axis reached 64°W at 00 UTC 23 July. At this time the relative vorticity maximum becomes less obvious (Fig. 3. Ic). The relative vorticity maximum at 850 mb disappears and the winds in the eastern Caribbean at that level were predominantly easterlies (not shown). At 00 UTC 24 July the wave axis past south of Haiti and reached 750W. The wave became better defined again as seen in the relative vorticity isopleths (Fig. 3.1d). The wave continued to propagate westward and 24 hours later the axis was near 80'W, very close to the mountains of
20W 20 b) 30N 27N - / + 24Ne- -2e 05 .0 --2e-055 N ' 21N e 0 r 5er 0 Z 1.5e-05 1V8N eu 15N 5 - - 5e-06 5e5e06 12N- -5e . ... 1e-05 - 5e-06 1 e-05 9N 7%0 % 1e0 6N e 5--3N 11W 100W 90W 80W 70W 60W 50W 40W 30W 2 20
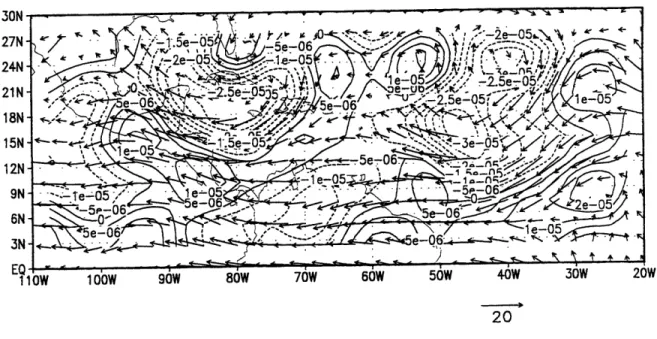
Figure 3.1: Winds and relative vorticity from the NCEP/NCAR re-analysis at 700 mb and 0000 UTC for (a) 20 July, (b) 22 July, (c) 23 July, (d) 24 July, (e) 25 July, (f) 26 July, (g) 27 July, (h) 28 July. The reference vector is in m/s.
30N 27N 24N 21 N 18N 15N 12N lW -100W 90W 80W 70W 60W 50W 40W 30W 20W 20 d) 30N-27N 2 - 5 -le-05 e u 2,e,, ,5 -2e-05 V 1 5 e --- ee0 -2 5-.-5 .. . , 219N - I- -e-065 0 e- 6N -e - ~ .5e-05 -18N - 1.5e05--5 EeW 100W 90W 80W 70W 60W 50W 40W 30W 201 20
Figure 3.1 (cont'd) le- 41
20W 20 110W 105W 100W 95W 90W 85W 80W 75W 70W 20
f)
30N 27N 24N 21N 18N 15N 12N- 9N- 6N- 3N- EQ-12( Figure 3. -- '\\ \- le-- le--le-- --- --- \ -- ..,- . _,- , :, 1 e-05, Se-05 e-/ " 1 - -- • _. . 3W 115W 1 (cont'd) -^- L. .-.-- ~--l~d~--isXI(sII~ II*W1_4-.^-.--h) 30N 27N -24N 21N - 18N-15N 12N 9N 6N 3N -EQ 120W 115V Figure 3.1 (cont'd) 10 50W 10 ___ _Ilpn
Central America (Fig. 3.le). The relative vorticity isopleths show a maximum more to the southeast, near Panama. Fig. 3. 1d also shows that on 24 July there is wavelike structure located at 50N, 990W. The feature seems to retrograde eastward and reach 90'W at 00 UTC 26 July. It is
uncertain whether that feature might be an artifact of the analysis, and whether it plays any significant role in the genesis of Fefa. At the same time, the easterly wave was making its passage across Central America, emerging into the eastern Pacific Ocean. The region of maximum relative vorticity remains over Central America on 26 and 27 July, while the wave axis entered the eastern Pacific. At 00 UTC 28 July, the wave axis reached 1040W. A relative vorticity maximum appeared over the eastern Pacific near 1030W which is distinguished from the one over Central America
(Fig. 3.1h). An examination of the 6 hourly fields reveals that the relative vorticity maximum seems to have developed in situ and emerged from very low latitudes. This maximum remained relatively weak until 29 July, when it became more prominent and was located at the genesis region
of Fefa.
During the period in which the wave was propagating across Central America, there is no eveidence of any organized low level circulation over the eastern Pacific. Fig. 3.2a shows the winds and isopleths of relative vorticity in the NCEP/NCAR re-analysis at 1000 mb at 00 UTC 26 July. Vorticity over the eastern Pacific was generally near zero or slightly negative. There is an area of cyclonic vorticity in the southern Caribbean near Panama. This vorticity maximum is a climatological feature of that region (eg. Nitta and Takayabu 1985), and it persisted throughout the period of our interest (Fig. 3.2 a-d).
One day later, at 00 UTC 27 July, the easterly wave was already in the eastern Pacific, as seen in the 700 mb analysis. But at 1000 mb there still is no evidence of closed circulation over the Pacific (Fig. 3.2b). We can see the ITCZ located along 90N, extending from the Central America to about 100°W as an axis of deformation. The signature of the ITCZ is also evident at 925 mb _ _l~~Xli___ -I CXII.~~F-L---.~I_~- I^*IYIIIC-~I~- -- i~- Y--.---~- I-~I~Y~~II~LIUI~Y~-~I~ipll L. _-XI_1~~ 1
24N 2130N 1 e-05 <-- ,1 18N - le e e 0 15N - j 2e-05 3N- .. 120W 115W 110W 105W 100W 95W 90W 85W 80W 75W 70W 65W 60W 10 b) 30N 27N - . . . ' 24N
W
1N 12W --- W -9e-05 e5e-0590W- 85W-8-- 7e-05" W
e1005 UTC for (a) 26 July,
18N) 27 July, (c) 28 July, (d) 29 July.
N -e -0 5
EQ
12)W 115W 110W 105W 100W 95W 90W 85W 80W 75W 70W 65W 60W
10
Figure 3.2: Winds and relative vorticity from the NCEP/NCAR re-analysis at 1000 mb and 0000
27N S'---2e-05 24N. . . .. . 21N l e-05"
7/
' _ _ 18N 15N-zg
.1-- e-05 9N -6N 3N -\
-- +A&0 EQ 120W 115W 110W 105W 100W 95W 90W 85W 80W 75W 70W 65W 60W 55W 50W 10 d) 27N N V , S-... le-05 24N -e --1e-05 21N- 0 18N 12N - - -le-05 1e 5 e50 9N- 1-ee.05 6N -3N\ EQ 120W 115W 110W 105W 100W 95W 90W 85W 80W 75W 70W 65W 60W 55W 50W 10 Figure 3.2 (cont'd)Irxl-i~- ---- ---)I i-llrrriua --l.i-- -n~-~~---sl--~..
-r;-i-~-r-(not shown). The winds were northeasterlies to the east of the mountains of Central America, and the wind speed reached over 10 m/s.
The first evidence of a region of cyclonic vorticity at low levels in the eastern Pacific occurred at 00 UTC 28 July (Fig. 3.2c). A distinct area of positive relative vorticity was located at 90N, 960W. The maximum of vorticity had a magnitude in excess of 2 x 10⁵' s '. During the formation of this vorticity maximum, the 700 mb wave axis has already reached 1040W. An important contribution to the formation of the area of cyclonic vorticity is provided by the development of strong easterly winds to the south of the Gulf of Tehuantepec, which were absent a day earlier. The maximum speed of the easterly winds reached 8 m/s. This easterly jet was also observed at the 925 mb level (not shown), and was present since 12 UTC 27 July. An explanation of the formation of this easterly jet was provided by Mozer and Zehnder (1996). According to their argument, when the winds to the east of the mountains of Central America are from an easterly direction, they will be incident on the mountains. This results in a blocking of the flow at low levels and a diversion of the flow to the south. They then argue that by the conservation of the Ertel potential vorticity this blocking causes an increase in magnitude of the easterly winds in the lee of the mountains ie. over the eastern Pacific. In a study of the genesis of Hurricane Guillermo, Farfan and Zehnder (1997) also observed the prescence of strong easterly winds south of Mexico and west of Central America, preceding the formation of the storm. But one interesting difference is that in their case the 700 mb wave was propagating northwestward and was still located in the western Caribbean when the strong easterlies in the eastern Pacific formed, while in this case the wave has entered the eastern Pacific. It is also interesting to note that approximately one day prior to the formation of the strong easterly winds south of Mexico, the speed of the winds incident on the
The area of maximum vorticity had not increased significantly in its horizontal extent by 00 UTC 29 July (Fig. 3.2d). Note that the southerly winds to the south of the region has increased in magnitude, indicating the occurrence of a wind surge. In the region of positive relative vorticity, the easterly winds were replaced by southerly winds, and a cyclonic curvature of the flow can clearly be seen. The wind surge is also evident at the 925 mb level (not shown), occurring at about the same time. It is suggested that the formation and growth of the low level cyclonic circulation can be associated with to the development of the easterly jet to the north followed by a southerly wind surge later.
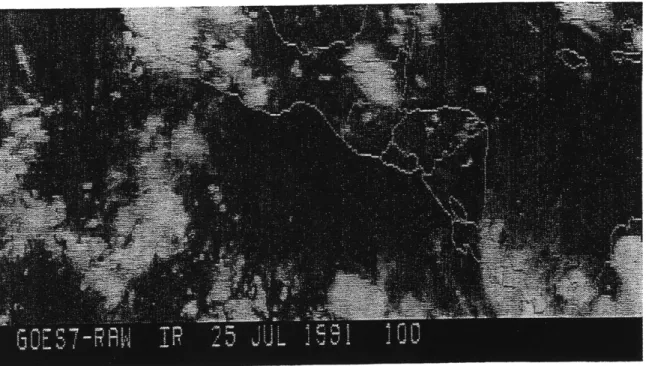
The development of the mesoscale system was investigated using satellite imagery. At 00 UTC on 25 July (Fig. 3.3a) , there was an absence of convection in a large region south of the Gulf of Tehuantepec. Any convective activity was confined to the west or to latitudes south of 100N,
and was rather scattered. At 01 UTC on 26 July (Fig. 3.3b), more convective activity is seen in the eastern Pacific, though it was still disorganized. The area of convection extended from about 1100W to the the coast of Central America, and was still confined to south of 100N. Note that
there is a train of clouds oriented in a NNE-SSW direction in the Caribbean Sea north of Honduras. This is the time when the wave axis was crossing Central America. 12 hours later (Fig. 3.3c), convective activity in the eastern Pacific decreased somewhat, and the train of clouds in the Caribbean had lost much of its signature. At 12 UTC on 27 July (Fig. 3.3d), convective activity in the eastern Pacific rejuvenated. There were several regions of moderately intense convection, some of which were located to the north of 100N. On the next day (Fig. 3.3e), convection became more organized, and was greater in areal extent. A concentrated area of convection is first seen at 12 UTC on 29 July (Fig. 3.3f). It was located near 120N, 1090W, and corresponds quite well with the
location of the circulation center derived from aircraft observations. At that time the system had developed into a tropical depression. When Fefa reached tropical storm strength at 01 UTC on
b)
Figure 3.3: Infrared images from GOES at (a) 0000 UTC 25 July, (b) 0100 UTC 26 July, (c) 1200 UTC 26 July, (d) 1200 UTC 27 July, (e) 0000 UTC 28 July, (f) 1200 UTC 29 July, (g) 0100 UTC 30 July.
d)
f)
Figure 3.3 (cont'd)
30 July (Fig. 3.3g), the convection associated with the circulation center became more intense and its area increased. Note that there is another small area of convection to the northwest of the major convection area. That small area of convection might be associated with the low-level circulation center, which was displaced to the northwest at that time.
Burpee (1972) noted the existence of a sign reversal of the meridional gradient of potential vorticity (qy) over Africa, which satisfies the Charney-Stem necessary condition for instability of internal jets. Molinari et al. (1997) extended the geographical location under observations of this kind of PV structure and discussed the relationship between the fluctuation of the Caribbean and eastern Pacific sign reversals of the Ertel potential vorticity and eastern Pacific tropical cyclogenesis. In a later study, Molinari et al. (1999) show that in the period preceding the genesis
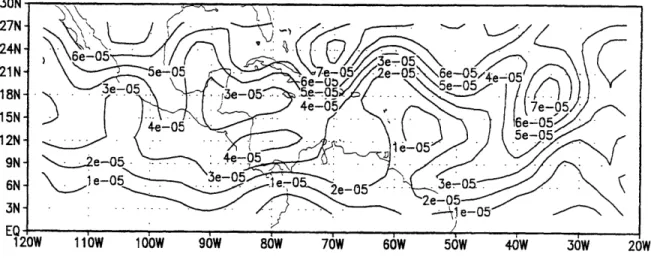
30N 27N 24N 21N 18N 15N 12N 9N 6N b) 30N 24N 15N 4e 05e055e-05 21N-18N- 6e-05 C 15N - -e-05 4e 12N- . ... I N " 3e-05 2e-Uz- 1 e-05 6N - u3e-z05 e2e-05 3N - e-05 EQ 120W 110W 100W 90W 80W 70W 60W 50W 40W 30W
Figure 3.4: Absolute vorticity from NCEP/NCAR re-analysis at 700 mb and 0000 UTC for (a) 20
30N 27N -24N 21N 3e-05 18N 15N -12N - 4e-05 9N . e-.,0 6N -3N EQ 120W 110W d) 30N 27N 0 24N 21N -<4e-05 18N -3e05 15N -5e-12N 9N 6N 3N -EQ 110W 100W Figure 3.4 (cont'd)
f) 30N 27N / 21N 18N 12N 9N 6N 3N . EQ 3 o Figure 3.4 (cont'd)
of Hurricane Hernan of 1996, the easterly wave moved through a background state which had a strong sign reversal in the meridional gradient of the absolute vorticity, which is favorable for the maintenance and growth of the wave. It is found that such a favorable background state also existed before the genesis of Fefa. Fig. 3.4 a-f shows the isopleths of the absolute vorticity at 700 mb. There is clear evidence of a sign reversal in the western Caribbean Sea as early as 20 July, when the easterly wave was still in the eastern Atlantic. The strength of the sign reversal increased somewhat over the next three days, while the easterly wave was propagating into the Caribbean Sea. On 24 and 25 July, when the wave was propagating across the western Caribbean, the strength of the sign reversal decreased. In the eastern Pacific, on the other hand, there is no clear evidence of a sign reversal. In conclusion, these analyses suggest that the easterly wave moved through an unstable basic state in the Caribbean Sea.
Chapter 4
The target object of IOP4 of TEXMEX was the MCS that eventually developed into Hurricane Fefa. This IOP was conducted from 28 July 1991 to 29 July 1991. Altogether three flights were flown. The first and the third flights were flown with the NOAA WP-3D, and were labeled 1P and 3P, respectively. The second flight was flown with the NCAR Electra, and was labeled 2E. Flights 1P and 2E consisted of several flight legs at both 3 km and 300 m altitudes, while flight 3P consisted of flight legs at 3 kmn and 450 m altitudes. In the following, a summary of the observations made during these flights is presented.
4.1 Flight 1P
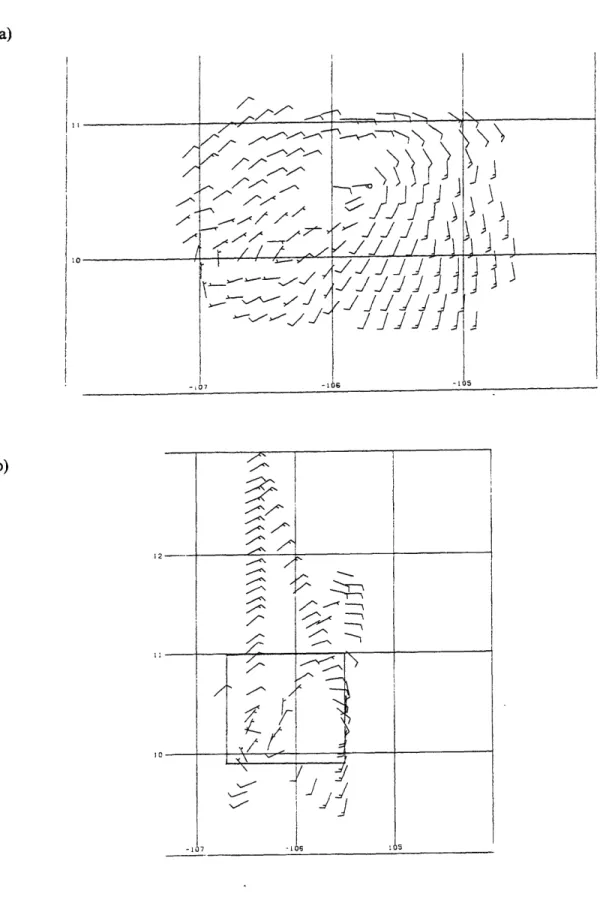
This is the first flight into the pre-Fefa system. Fig. 4. l1a shows the Doppler radar wind at 3 km altitude. A mesoscale circulation pattern can be seen. Fig. 4. lb shows the in situ observations of the wind at the same level. Combining these two figures, a vorticity center is estimated to be located near 10.3' N, 105.90 W. Fig. 4.1c shows the Doppler radar wind at 1 km altitude. No closed circulation was found at this altitude. There was a WSW-ENE oriented shear line between 100 and 110 N and 1070 and 1060 W, which was to the west of the 700 hPa (3 km) vorticity center. The winds south of this shear line are generally SW'ly, and are stronger than the winds at higher levels. The in situ observations of the wind at 300 m (Fig. 4. ld), which were collected at a later time, only captured the SW portion of the 700 hPa vorticity center, showing SW'ly winds of 15
-20 m/s. The flight pattern also captured the shear line to the west of the 700 hPa vorticity center, which had moved northward by about 80 latitude since the 3 kman altitude flight. Assuming that the vortex is in balance with the thermal field, the vertical shear of the wind between two levels gives a proxy for the temperature anomalies in the corresponding layer.
b)
12
Figure 4.1: Observations in pre-Fefa MCS during flight 1P. (a) Doppler wind field at 3 kmn, (b) in situ winds at 3 km. Long barb is 5 m/s.
c) -=L -7 j \ yJJJJ \~ - j -/JJ J
J
j
J JJ J = d)1 2 1 4 S 7 8 9 10 11 12 1 1 i 15 8 17 t8 19 20 21 22 3 24 29 2 27 2 21 30 31 336 339 iMo II
c
10--3Figure 4.1 (cont'd): (e) change of wind from 1 to 3 kan, (f) time series of virtual potential temperature on leg 2, (g) relative humidity at 3 kmn in percents, (h)
ee
at 3 klan. Temperature in Kelvins. so 80 9 ,g 167. aGI----
---1 2 3 4 S 8 7 8 5 10 11 12 13 14 110 17 1 21 22 23 24 2 28 4 i 00
-1o
10 15 20 25 145 -1145 314+ 1 2 3 4 5 8 7 8 I 1 I 13J 14 1 1 I iI I I 1 2 3 4 5 6 7 3 9 10 11 12 13 14 19 16 "17 t8 12 20 21 22 23 24 25 20Figure 4.1 (cont'd): (j) time series of Oe on leg 4, (k) time series of in situ winds on leg 4, (1) time
series of virtual potential temperature on leg 4, (m) map showing leg 2 and leg 4.
If the wind shear is cyclonic (anticyclonic), then the vortex has a cold (warm) core. Fig. 4. le shows the vertical difference between the wind at 3 km and 1 km. There is a region of cyclonic shear near 10.80 N, 105.80 W, suggesting a cold core located to the north, and not very far away from the vortex. Fig. 4. If shows the time series of the virtual potential temperature recorded on leg 2 of the 3 km flight pattern, as indicated in Fig. 4. l1b. The conspicuous trough in the curve corresponds to the cold core. However, there is also a region of anticyclonic shear near 10.80 N, 105.60 W, suggesting a warm core located to the NE of the vorticity center. The relative humidity at 3 km altitude is quite high in the region of the vortex core (Fig. 4. 1g). It varies between 80% and 100%. The relative humidity in the environment is only about 70%. The analysis of the equivalent potential temperature (0e) at 3 km (Fig. 4.1.h) shows a maximum near the vortex core, collocated with the region of highest relative humidity. Fig. 4.1 .j shows the time series of Oe recorded in leg 4 of the 3 km flight pattern. This leg runs directly through the vortex center, indicated by the shift of wind (Fig. 4.1k). There is an obvious peak of
ee
(342.5K) at the vortex center. Note that theee
in the environment of the MCS is only about 335K, which is about 6K lower. The analysis of the virtual potential temperature roughly agrees with the Fig. 4.1e. It does not show a distinct cold anomaly in the vortex core. This is further illustrated in the time series curve of the virtual potential temperature in leg 4 (Fig. 41).The analyses of the
ee
and virtual potential temperature in the boundary layer (1 km altitude) are shown in Fig. 4.2a and Fig. 4.2b, respectively. Although the flight pattern missed the region of the 700 hPa vortex center, the flight leg closest to the vortex center does show that both variables have negative anomalies near that region. So it suggests that in the region of the 700 hPa vortex, a cold core exists at low levels. In the region of the trough or the shear line, however, both variables have relatively high values, though the winds in that region are no stronger than thosec) d)
14ti 302
-30
ro~l ---~c~Sol ~ it0
44. - 301 42 300. 301 2"2. 26.5 - - . . 041 - 230 ---205 --- 4 1 2 3 4 S 7 0 O 10 11 12 13 14 i5 to 17 1 t 20 2 2 2 2 3 24 25 2 27 21 30 1 2 3 4 6 7 9 0 10 11 12 11 IA4 1 16 17 IS I0 20 21 22 23 243 25 27 28 20 30
Figure 4.2: Observations in pre-Fefa MCS during flight 1P. (a) Oe at 300 m, (b) virtual potential temperature at 300 m, (c) time series of e on leg 9, (d) time series of virtual potential temperature on leg 9.
02
-/- 0
Figure 4.2 (cont'd): (e) map showing leg 9.
near the vortex core. This is clearly illustrated in the time series of these two variables in leg 10 (Fig. 4.2c, 4.2d). Both variables increase substantially in the region of the trough.
Flight 2E
Whereas in the first flight no distinct vortex can be seen at 3 km altitude, during flight 2E a vortex center became obvious. Fig. 4.3a indicates a vortex center located at 12.20 N, 109.30 W. The height of the 700 hPa surface shows a minimum at the vortex center (Fig. 4.3b). Compared to the first flight, the altitude of the 700 hPa height minimum has decreased by about 20 m. At 3 kan altitude, the relative humidity generally varies between 80% and 90% near the vortex center (Fig. 4.3c). But note that to the north of the vortex center, there is a small region where the relative humidity is rather low (<80%), indicating the presence of some dry air. This is illustrated in the time series curve of the relative humidity in leg 4 of the flight pattern (Fig. 4.3d). Note the drop in