The Cartel in Retreat
by
M.A. Adelman
MASSACHUSETTS INSTITUTE
SEP
05
1996
ABSTRACT
In 1981, the price of oil was $34 in current dollars ($50 at 1992 price levels). The consensus was that it would keep rising toward the cost of synthetic crude oil or some such long-run ceiling. In fact, the cartel had fixed the price far above the point of maximum profit. OPEC members did not lose their power, they regained their wits, and
saw their limits.
The drop in consumption in belated response to the two price explosions was borne entirely by OPEC as price guardian. Non-OPEC production rose. OPEC market share fell to less than 30 percent.
OPEC members kept a remarkable cohesion. During 1982-1985 Saudi Arabia absorbed most of the loss, and prices declined moderately. But when Saudi exports went to near-zero, they ceased to be the restrictor of last resort. The price fell below $10, until OPEC could patch up a market sharing deal and bring it back to the neighborhood of $18,
where it has remained.
Consumption revived, and OPEC exports have approached but not equaled the old peak. The once-massive excess capacity dwindled, but in theory and in fact this had little effect on the price. Each
increase in exports meant a fresh contention over sharing it among members. OPEC meetings and disputes became almost continuous. Each member did its best to push the burden of restriction on to others. This limited OPEC cohesion and power over price.
The oil market became "commoditized," with many re-sellers probing for even a slight gain. Adherence to a fixed price became much more difficult to monitor. Increasing reliance had to be placed
on production restraint.
Low prices caused Iraq to be hailed as savior for threatening Kuwait and Abu Dhabi, but this in turn provoked invasion and war.
Despite the shutdown of two major producers, then one, prices have not revived.
The cartel mission is to trade off market share against a higher price. But their market share remains too low to bear the losses a higher price would bring. Until it increases, the cartel stays in a
trap.
Whether revenues were higher or lower, OPEC members overspent them and ran current-account and budget deficits. They had difficulty raising money for oil capital expenditures, which were only a small fraction of total government expenditures. The Iraqi aggression was an extreme example of this tension, and of the temptation of a rich neighbor.
The world oil industry is an oddity. Socialism is repudiated everywhere, yet most oil is produced by bumbling state companies. The travail in the Former Soviet Union is the extreme example. Taxes on crude oil production in non-OPEC countries is usually regressive and hinders development. But past mistakes are present opportunities, and make likely continued long-time growth of non-OPEC oil, with the OPEC price stuck in the market share trap.
TABLE OF CONTENTS
THE CARTEL IN RETREAT 1981-1992 . . . . . . . . . . FIGURE 1: CRUDE OIL PRICES 1973-1992 . . . . . . . The clear blue sky . . . . . . . . . . . . . . . . FIGURE 2 & 3: PRICE FORECASTS . . . . . . . . . . . THE YEARS 1981-1992: A PREVIEW . . . . . . . . . . From reserve price-raising power to market share-pr tradeoff . . . . . . . . . . . . . . FIGURE 4: OPEC: REAL & SUPPOSED DEMAND CURVES . . . TABLE I: CONSUMPTION & OPEC EXPORTS 1986-1992 . . . TABLE II: RESULTS OF AN OPEC PRICE INCREASE . . . . The market share trap . . . . . . . . . . . . . . .
The awakening . . . . . . . . .
STRUCTURAL CHANGES IN THE 1980s . . . . . . . . . . Dis-integration and spot and term prices . . . . . "Commoditization" . . . . . . . . . . . . . .
Illusion: "the market sets the price" ... Open markets promote competition . . . . . . . . . NON-OPEC SUPPLY . . . . . . . . . . . . . . . . . . TABLE III: . . . . . Price, cost, and value . . . . . . . . . . . . . . The United States ex-Alaska . . . . . The new areas: Alaska, North Sea, Mexico . . . . . Other non-OPEC producers . . . . . . . . . . . TABLE IV: Non-OPEC Producers . . . . . . . . . . . Non-OPEC Investment Requirements . . . . . . . . . The taxation of oil production . . . . . . . . . . Taxes still regressive in 1992 . . . . . . . . . .
ice . , . , 3 3
5
5 58
9 9 11 13 14 14 16 16 1718
20 21 21 23 26Regressive taxes increase risk and abort discovery THE PRICE PATH DOWNWARD 1981-1985 . . . . .
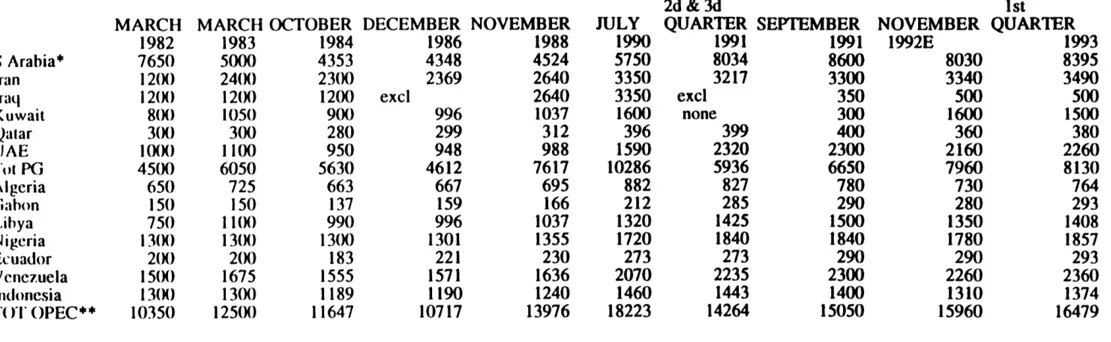
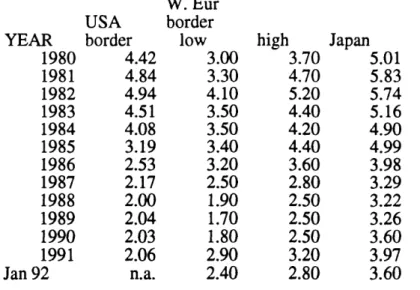
Spot and contract prices . . . . . . . . . TABLE V: Saudi Exports & Revenues . . . . "Haggling" invades the market in 1980-1981 Long run comfort . . . . . . . . . . . . . Production limited in March 1982 . . . . . Production limited in March 1982 . . . . . TABLE VI: OPEC QUOTAS 1982-1993 . . . . . . Prices, policy and the long term . . . . .
"Divisive" differentials ... . Managing total OPEC output . . . . . . . . An appraisal of 1982 . . . . . . . . . . . Harbingers: Saudi Arabia now overpricing THE SLIDE RESUMES IN 1983 . . . . . . . . . Cooperation, dialogue, interdependence . The March 1983 production allocation: Saudi
producer . . . . . . . . . . . . . . . Efforts to expand capacity . . . . . . . . The felt need for enforcement . . . . . . . The Mabro proposal . . . . . . . . . . . . THUNDER WITHOUT RAIN IN 1984 . . . . . . . Prices hold, supply shaky . . . . . . . . . The horizon still fair . . . . . . . . . . Barter deals . . . . . . . . . . . . . . . Light crudes start a decline . . . . . . . THE SAUDIS ARE PUSHED TOO FAR IN 1985 . . . Emergency meeting, data gaps,
. . . 29 . . . 29 . . . 30 . . . 31
. . . .. 35
. . . .. 37 . . . 39 . . . 39 . .. . . . . 40 . . . 41 . . . .. 42 Arabi. * .
the.
44 44 48 48 5255
57 swing. .
27Short run gloom, long run rosy . . . . . . . . . . . . TABLE VII: GAS . . . . . . . . . . . . . . . . . . . . The Saudi dilemma: retaliation invites general collapse The Saudis draw back for a jump . . . . . . . . . .
THE RANKS COLLAPSE AND REFORM: 1986-1987 . . . . . The seductive netback as price hedge . . . . . . . Pain inflicted . . . . . . . . . . . . . . . . . . Mr. Bush speaks on All Fools' Day . . . . . . . Netbacking continues . . . . . . . . . . . . . . . The July-August meeting stops the price decline . . Yamani dismissed at end-October . . . . . . . . . . More production cuts; stable prices in last quarter An Appraisal of OPEC in Retreat 1981-1986 . . . . . UNWILLING PRICE STABILITY 1986-1992 . . . . . . . . A disappointing period . . . . . . . . . . . . . . Stability in 1987 . . . . . . . . . . . . . . . . . Term contracts, without fixed prices . . . . . . . Iraq expands; Saudi Arabia again swing producer . . Rosy long term . . . . . . . . . . . . . . . . . . Prices held: Saudis repudiate swing role . . . . . Prices decline again; supply grows . . . . . . . . Supply conditions and capacity expansion . . . . . Quota impasse, and sagging prices . . . . . . . . . Iran-Iraq war ends: expansion plans . . . . . . . . Jennings and Ali Jaidah sum up . . . . . . . . . . Price decline at end-1988 . . . . . . . . . . . . . EXPANSION BRINGS CONFLICT IN 1989-1990 . . . . . .
. . . 75 . . . 78 . . . 78
. . . . .
80
. . . 83 . . . . . 84 . . . 87 . . . 90 . . . 92. . . 95
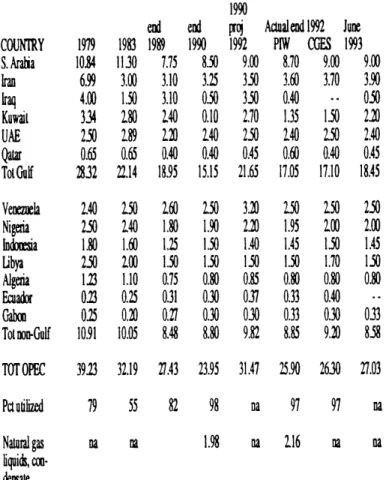
. . . 97 . . . 97 . . . 99 . . . 100 . . . 101 . . . 105 . . . 105 . . . . . 112 . . . 113 . . . . 114 . . . 115 . . . 116 . . . 119TABLE VIII - OPEC CAPACITY 1979-1992 . . .
.
Capacity expansion and its obstacles . . . . The decline rate, four Gulf producers . . . . TABLE IX - DECLINE RATES . . . . . . TABLE X - OPEC OIL WELLS DRILLED . . . . . . Collapse and revival of OPEC drilling . . . . Barriers to capacity expansion . . . . . . . Insufficient funds? . . . . . . TABLE XI: OPEC O&NG CAPEX/OIL REVENUES . . . The Flabby National Dinosaurs . . . . . . . . Bring the foreigners back? . . . . . . . Non-OPEC Countries . . . . . . . . . . . . . STABILITY IN 1989 . . . . . . . . Non-OPEC producers . . . . . Pricing formulas . . . . . Rebuilding capacity for higher quotas . . . . Beyond the horizon . . . . . . Kuwait's policy reversal (expansion cost) . . The long June 1989 meeting: rising demand shaover market share . . . . . From the June to the September meeting . . . The September meeting . . . . . . . . From September to November . . . . . . "Breakthrough" at the November 1989 meeting . THE FIRST HALF OF 1990 . . . . . . Capacity expansion in first half 1990 . . . . TABLE XII: OPEC CAPACITY: ACTUAL & PROJECTED Expectations in the first quarter of 1990 . .
.... . . . .. 119 ... 119 ... 119 ... 120 . . . 121 . . . . . 121 . . . 124 . . . 124 . . . 125 . . . ... 125 . . . 127 . . . 129 . . . 130 . . . 130 . . . 130 . . . 131 . .... 131 1I ' ' 134 rpens strugg S. . . 136 S . . . 140
. . . .
141
... 144
S . . . .
.
147
. . . 147
. . . 150
152
. . . . . . .Expert opinion: prices to rise, OPEC expansion Prices in the first quarter 1990 . . . . . . A brief friendly meeting . . . . . . . . . . Markets awaken in April . . . . . . . . . . . The emergency meeting . . . . . . . . . . . . Still good times ahead . . . . . . . . . . . Pledged reductions not fulfilled in May-June Heads of state take over in July . . . . . .
IRAQ: . . . . .. . . . . ..
The attack on Iran 1980-1988 . . . . . . . . From Enforcer to Hijacker in 1990 . . . . . . The policy of the USA . . . . . . . . . . . . Invasion, blockade, and dilatory OPEC . . . . "Ridiculous surplus" .. . . . . . . . . Appraisal of the 1990 crisis . . . . . . . .
THE POSTWAR MARKET IN 1991-1992 . . . . . . . Pricing methods show chronic oversupply . Co-operation, dialogue, interdependence
Foreign investment . . . . . . . . . . . . OPEC: MARKET SHARE CONTENTION AS USUAL . . . The 1991 meetings: "capacity is king" . . . . THE SOVIET IMPLOSION . . . . . . . . . . . . FSU oil industry . . . . . . . . . . . . . .
World market . . . . . . . . . . . .
REFERENCES . . . . . . . . . . . . . . . . . Price turning point . . . . . . . . . . . . . Defining the cartel . . . . . . . . . . . . .
in doubt . . . 152 . . . 153 . . . 154 . . . 155 .. . . . . 156 . . . 157 . . . ... . 158 .. ... 160 . . . . .. . 162 . . . . . . .. 163 . . . 164 . . . 166 . . .. . 168 . . . 174 . . . 175 . . . 179 . . . . . . . . 179 . . . . . . . . 182 .. ... 184 .. ... 193 . . . . . . 193 . . . . . . . . 208 . . . . 208 . . . . . . . 214 .. . . . . . 215 . . . . . . 221 . . . 221
Limits of OPEC power . . . . . . . . . . . . . . . . . FIGURE 4 -- REAL & ILLUSORY D-CURVES . . . . . . . . . TABLE II -- RESULTS OF AN OPEC PRICE INCREASE . . . . . The market share trap . . . . . . . . . . . . . . . . . Before expropriation . . . . . . . . . . . . .
Cartel quota allocation . . . . . . . . . . . . The bumpy road down: 1981-1985 . . . . . . . . The Saudis reject the burden of being "swing pr EXCESS CAPACITY AND PRICE CHANGE . . . . . . . The economics of excess capacity . . . . . . .
FIGURE 5: OPEC CAPACITY USE & PRICE CHANGE TABLE XIII: OPEC CAPACITY USE & PRICE CHANGE The supposed link of capacity with price change Excess capacity as bargaining tool . . . . . . WILL MARKET SHARE RISE AT CURRENT PRICE? . . . Shaky stability since 1986 . . . . . . . . . . Consumption . . . . . . . . . . . . . . . . . . Natural gas back on track . . . . . . . . . . . Non-OPEC expanding . . . . . . . . . . . . . . Reserves are inventories . . . . . . . . . . . Regressive taxation: the real barrier . . . . . OPEC "willingness" to expand . . . . . . . . . "Capital crunch?" . . . ... TABLE XI - OPEC ME & AFRICA CAPEX . . . . . . . The flabby national dinosaurs: OPEC . . . . . . Bring back foreign companies? . . . . . . . . .
. . .
221
. . .
222
. . .
222
.
. .
222
. . . 223 . . . . 224 .. . . 225 oducer" . . . 226 . . .. . 226 . . . 227 . . .. . 227 . . . . . . 227 . . . . . . 227 . . . 228 . . . 229 . . . . . . 229 . . . 230 . . . . . . . 231 . . . . . . . 232 . . .. . . 232 . . . . . . . 233 . . . 233 . . . 234 S . . . . . . 235 . . . . . . 235 . . . . . . . 235The Former Soviet Union (FSU) . . . 238 APPENDIX A. RATES OF RETURN ON OIL DEVELOPMENT INVESTMENT . 240 Example: West Siberia . ... .. ... . 241
THE CARTEL IN RETREAT 1981-1992 M. A. Adelman
1981 "Sometime in the future (perhaps as long as two years) a gradual real [price] increase up to the cost of production of synthetic liquid hydrocarbons." --James E. Akins
1982 "[Oil] supply shortage may hit after 1985 ... anywhere from 9- to 21-million barrels daily.
--International Energy Agency
1983 "American strategists have always found a silver lining in the stable pro-Western Gulf that high oil prices helped create."
--New York Times, March 6
1984 "The world is running out of oil." --Daniel Yergin
1984 "After the days of luxury, we have become A lamb in the midst of the jungle.
Like a gang, the wolves of the market Swarm around us."
-- Sheik Manei Saeed Al Otaiba, Oil Minister, Abu Dhabi
1985 "There is no fear in OPEC of a price decline." [Price eventually equates to synthetic hydrocarbons' cost.]
--James E. Akins
1985 "Market realities will again give way to geological realities. ... And that will eventually put the era of surplus behind us."
-- Daniel Yergin
1985 "If [the U.S.] Congress does not go for a (gasoline] tax soon, it will have missed its best chance of returning the world to cheap oil, low inflation, low
interest rates and rapid growth." --The Economist (London)
1986 "The protection of American security interests requires action to stabilize the falling price of oil".
--George H. W. Bush
1986 "U.S. officials root for higher oil prices." --Wall St. Journal, December 19
1987 "Saudi Arabia has contributed billions of dollars...in areas where the
executive branch has been unwilling or unable to gain Congressional support. As the payments to the Nicaraguan contras demonstrate..."
--New York Times, June 21
1987 "Better relations with Washington have moderated Iraq's behavior considerably." -- State Department source in Wall St. Journal, March 31
1988 "I just cannot understand how this low price can sustain investments in high-cost oil areas."
--Ali M. Jaidah
1989 "A consistent underestimation of potential supply and a consistent
underestimation of the consumers' ability to adjust their demand ... led OPEC (and usually leads every other cartel) to overestimate its strength."
--Sheikh Ali Al Khalifa Al-Sabah,Oil Minister, Kuwait
1990 "Iraq has modified its behavior and policies in large part because of our diplomatic efforts." --U.S. Ambassador Glaspie
1991 "What we had before was a special relationship [with Saudi Arabia]. Now we have a
more special relationship." --Daniel Yergin
2
THE CARTEL IN RETREAT 1981-1992 INTRODUCTION - OPEC AT THE PEAK
By the middle of 1981, the second price explosion was over. In January, Minister Yamani said that the 1979-80 increase was "another corrective action" like the earlier one, a long-delayed adjustment. [PIW 3-9-81 SS:1-4] In early 1981: "Fear of soft market seems behind latest Mideast price rise" [PIW 1-19-81:1, emphasis added] That is bizarre under competition, but rational conduct under collusion: since you must soon defend the price line, advance it as far as possible. (A last pre-emptive push was to come in October 1981.)
[FIGURE 1: CRUDE OIL PRICES 1973-1992]
Figure 1 shows that in 1979-1981, as in 1974, spot prices fluctuated while the OPEC nations kept excess capacity at bay, and kept raising effective contract prices. But by mid-1981, various crude oil prices which under stable conditions are close to one another, and which had been widely separated after 1978, were now rejoined. One could stop to characterize the new
conditions of the 1980s.
The clear blue sky As perceived in the producing and
consuming countries in 1981, all signals were Go, and prices were [FIGURE 2 & 3: PRICE FORECASTS]
headed up and away. Figure 2 shows the consensus forecasts tabulated by the International Energy Workshop, and Figure 3 those of the Society of Petroleum Evaluation Engineers. Implicit in each forecast are two assumptions: first, the current price is
Figures
1 a-1c.
Crude Oil Prices, 1973-1992
1973-1978 73 M M 1 $ N 74 M M 1 S N 75 M M P A I A 0 F A J A 0 A I - Saudi Export - Iran jSN 4 M M S Nm M M 1 N 1 M MI SW A 0 DPA I A O DA F J A 0 DPA A 0- Saudi Light Spot
UAE 1978-1982
lPMAM J I ASOND7 MAMII ASOND PMAMI IASONDSIPMAM IASONUFMAMJ J AOND
. Saudi Export .-. Saudi Light Spot
-.- Iran
-
UAE
1982-1992
IMM I S NoMM I NiMM I S NiuMM SI NMMM I S NIMM I S NoMM I SNmM S NWMMJSN I S N SMM S )M I SN FAJ IODFAIP AODPA IAODPAJAODPAJAODPAJAODPAIAODFAJAODFAIODFAJ AODFAIJAo
- Saudi Export -. Saudi Light Spot
FIGURE
2
Crude Oil Prices (1990 $
/barrel)
Actual and Successive IEW Polls
I U0.0 A
90.00
80.00
70.00
60.00
50.00
40.00
30.00
20.00
10.00
0.00
1970
1980
1990
2000
2010
2020
I Actual
0Dec-81
*Jul-83
O
Jan.85
*
Jan-86
& R-89
X R-90
* R-91
-
R-92
FIGURE 3
SPEE 1991 SURVEY
Fi9 ure 17
OIL Price* Predicted at
1982 Thru 1991 for
10 Year= each Survey
March 1991 Survey sc- - -4---Y8
/
82 83 84 85 86 87 88 89 90 91 Cal endr Y8<-3 Y8
Z
Y8 /r' YB Jle J.R. Butl er 94 95 96 Y9 & Co. 98 99 00 U) N.o (V) (1J -4 ----r- r- I.- r- r~1
| ~ T-- I|--X,
I 97 -•--92 93Year
the long-run competitive price. If the price changes, that
changes the data, and enables a better initial estimate. Second, the price must increase from its current level because... how can you doubt it? [Lynch, 1992]
Yet, by 1983, the deflated value of OPEC revenues was
actually less than it had been in 1978, before the second price hike. Seldom has a mistake been so quickly punished, and so slowly understood.
THE YEARS 1981-1992: A PREVIEW
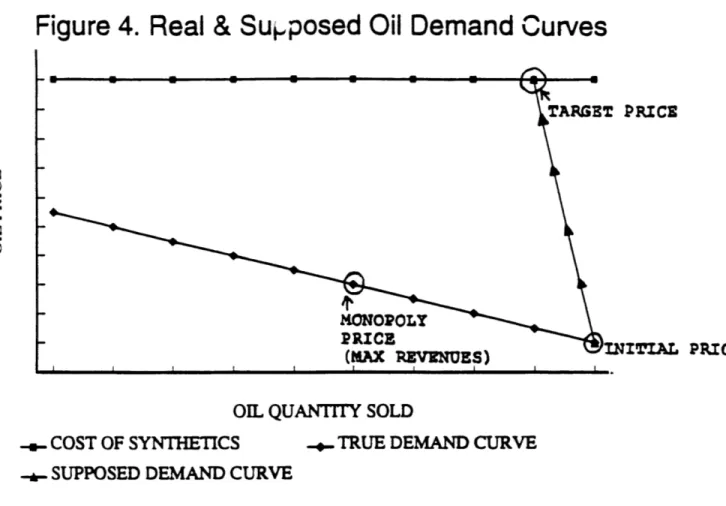
From reserve price-raising power to market share-price tradeoff For years, the OPEC members were guided by a vision of the market which is sketched in Figure 4.
[FIGURE 4: OPEC: REAL & SUPPOSED DEMAND CURVES]
(The whole figure shifts slightly to the right in a year of world economic growth, leftward in recession. We ignore these movements to avoid needless cluttering of the diagram.)
Demand for oil was viewed as highly price-inelastic. As noted in the previous paper, Minister Yamani in mid-1978 said oil demand price elasticity was zero. Surely he did not mean this
literally, only that the price could be profitably raised very high, with very little sales loss.
The target was a price just below the cost of producing synthetic crude oils in large amounts. This is logical for a monopoly. Only when oil-on-oil competition is suppressed can the price be set by the nearest alternative. We showed in earlier
Figure 4. Real & Supposed Oil Demand
Curves
w
•JLI CL ©
OIL QUANTITY SOLD
- COST OF SYNTHETICS - TRUE DEMAND CURVE
SUPPOSED DEMAND CURVE
TARGET PRICE
MONOPOLY
PRICE INITIAL PRIC
(MAX REVENUES)
IC
papers that the vision in Figure 4 was the explicit guide to the first generally fixed price, on December 31, 1973. The never-modest Shah of Iran called it his "new idea," but the U.S. State Department had already suggested it in 1970, and its author still clung to it at least as late as 1985. (Below, p. 69)
The synthetics' cost was also the goal set in the 1979 report of the Long Term Price Policy Committee, chaired by
Minister Yamani. The exact location of the ceiling was now seen as uncertain, but a long way up. In the interim, OPEC would have great unexerted price raising power. In early 1981, OPEC saw itself as still on the upward path, and expected to raise the price again in time. [PIW 3-9-81:SS 1, 4]
One 1980 estimate of the ceiling, by a renowned Oxford economist and previous U.K. Minister of Energy, was $90-$100
($148 to $164 in 1990 prices). "The restraint by oil exporters is entirely political," in deference to the U.S. [Balogh 1980] Of course this flattering legend of the "special relationship" is still believed. [Fesharaki 1980] expected the price to exceed $80 (in 1980 prices) because OPEC nations would reserve oil for domestic use rather than "deplete their dwindling asset to appease the appetities of industrial nations."
This final paper is concerned with the loss of an illusion, and OPEC's retreat since 1981, from a price above the monopoly optimum. It was gradually realized that demand was really much more elastic than had been supposed. Sales not only ceased to
grow but diminished.' An unexpected increase in non-OPEC output--which would have come about even without any price increase--made things worse.
[TABLE I: CONSUMPTION & OPEC EXPORTS 1986-1992] [TABLE II: RESULTS OF AN OPEC PRICE INCREASE]
The market share trap With the benefit of hindsight, i.e. history, we can see that the OPEC mission has become to trade market share for a higher price.
The purpose of Table II is to capture the relation between market share and demand elasticity, 2 both for total OPEC and for Saudi Arabia. Table II is much oversimplified, but the reader can substitute his own assumptions at several places. The column
"notation" shows how to set up the table as a Lotus file, and experiment with the parameters.
The demand for crude oil is derived from the demand for oil products, whose long-run price elasticity was estimated by
[Griffin 1979] as around unity.3 The price elasticity of crude oil is equal to the product elasticity, multiplied by the
crude/products relation, which in the OECD was only about 11
1 I once speculated, on no firmer basis than the average lifetime of
taxable business equipment, that the half-life of the consumption response was about nine years, i. e. that 7.7 percent of the response was felt the first year, and thereafter 7.7 percent of what remained. It is hard to measure any such slow-acting process.
2 If Q=pE, In Q = E In P. Differentiating, 1/Q = E/P (dP/dQ) E = P/Q (dP/dQ), the conventional elasticity definition.
3 [Kouris 1983] seems to indicate a modal value around 0.85. [Dahl &
Steiner 1991] estimate around unity for gasoline, the least elastic of oil products. [CGES 1992] estimates product price elasticity at 0.85.
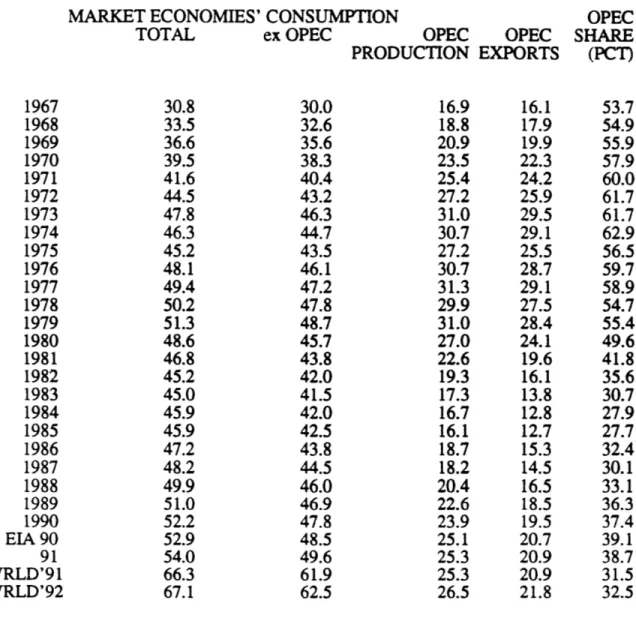
TABLE I. MARKET ECONOMIES' CONSUMPTION & OPEC EXPORTS, 1967-1992 (IN MILLIONS OF BARRELS DAILY)
MARKET ECONOMIES' CONSUMPTION
TOTAL ex OPEC OPEC OPEC
PRODUCTION EXPORTS 1967 1968 1969 1970 1971 1972 1973 1974 1975 1976 1977 1978 1979 1980 1981 1982 1983 1984 1985 1986 1987 1988 1989 1990 EIA 90 91 WRLD'91 WRLD'92 30.8 33.5 36.6 39.5 41.6 44.5 47.8 46.3 45.2 48.1 49.4 50.2 51.3 48.6 46.8 45.2 45.0 45.9 45.9 47.2 48.2 49.9 51.0 52.2 52.9 54.0 66.3 67.1 30.0 32.6 35.6 38.3 40.4 43.2 46.3 44.7 43.5 46.1 47.2 47.8 48.7 45.7 43.8 42.0 41.5 42.0 42.5 43.8 44.5 46.0 46.9 47.8 48.5 49.6 61.9 62.5 16.9 18.8 20.9 23.5 25.4 27.2 31.0 30.7 27.2 30.7 31.3 29.9 31.0 27.0 22.6 19.3 17.3 16.7 16.1 18.7 18.2 20.4 22.6 23.9 25.1 25.3 25.3 26.5 16.1 17.9 19.9 22.3 24.2 25.9 29.5 29.1 25.5 28.7 29.1 27.5 28.4 24.1 19.6 16.1 13.8 12.8 12.7 15.3 14.5 16.5 18.5 19.5 20.7 20.9 20.9 21.8 OPEC SHARE
(PCT)
53.7 54.9 55.9 57.9 60.0 61.7 61.7 62.9 56.5 59.7 58.9 54.7 55.4 49.6 41.8 35.6 30.7 27.9 27.7 32.4 30.1 33.1 36.3 37.4 39.1 38.7 31.5 32.5 Source: 1973-1990, BP Annual Statistical ReviewOPEC consumption from CIA, 1973-1989; estimated for earlier years. 1990-1992, EIA, International Petroleum
Statistics Report. (Format change after July 1992) Natural gas liquids included.
TABLE II. RESULT OF AN OPEC PRICE INCREASE
AGGREGATE ALL SELLERS New price: ratio to old price Price elasticity of demand New sales volume: ratio to old New revenues: ratio to old
SUB-GROUP Initial market share
New sales volume: ratio to old
New revenues: ratio to old Sub-group elasticity of demand
notation P E Q=P^E PQ=PA(E+1) G Q(G) = Q-(1-G)/G PQ(G) = PA(E(G)+1) InPQ(G)/InP = (50 PERCENT INCREASE)
CRUDE OIL CRUDE OIL ONE YEAR 1.5 -0.10 0.96 1.44 0.37 0.89 1.34 -0.28 (Saudi) 0.12 0.67 1.01 -0.97 FIVE YEARS 1.5 -0.20 0.92 1.38 0.37 0.79 1.18 -0.58 (Saudi) 0.12 0.36 0.54 -2.51 10 PCT TAX ON PRODUCTS (LONG TERM) 1.10 -1.00 0.91 1.00 Total 0.34 0.73 -3.23
percent in 1970, but 53 percent by 1982. Crude price elasticity, earlier negligible, was now worth estimating.
We take the initial price as unity, and a hypothetical price increase of 50 percent. Following [EMF 1992], we take the price elasticity of crude oil demand4 at -.1 in one year, -.26 in a decade, and 0.38 to 0.56 after 20 years.5 The initial OPEC market share is assumed at .34. It was lower in 1982-1987, and
is now, because of the integration of Former Soviet Union (FSU) production into the world market. The Saudi market share is
assumed at one-third of the OPEC share, which it has been recently.
A 50 percent price hike increases non-OPEC revenues by 50 percent. All the curtailment of output is by OPEC, which gains
34 percent in revenues. If nobody in OPEC cheats, the Saudis too gain 34 percent. If everybody cheats, they gain only 1 percent. What actually happens is somewhere between these two extremes--at
first. Over time elasticity rises, the OPEC sales loss grows, and more of it is gradually loaded on to Saudi Arabia. It is an unattractive prospect for them. The incentive is strong for
everyone to join in a firm quota agreement, and to keep their word, at first. But it does not last. The table can be used to
see the effects of the incessant pull and heave of the OPEC
' This may be over-conservative because we set to zero the elasticity of supply in non-OPEC countries. As we will see in a moment, the non-OPEC supply response was swamped by changes in taxation and regulation.
5 It is safe to assume that elasticity increases at a decreasing rate, e.g., proportional to the logarithm of time. Then E = -.10 + 2.3 In(t), and at t=5, E = -.21.
members trying each to get just a bit more, and the final impact on Saudi sales.
There is a risk for all OPEC: the demand response may not be as expected. For the Saudis there is the additional risk that other members will cheat. With the possible exception of Kuwait:
all OPEC members are weak risk-bearers. [Adelman 1986] They are compelled to bet heavily on every price decision because they have few sources of income except oil. Some of them have spent heavily, of course, to start other industries, but with little
result. The purchase of downstream refining - marketing assets has been profitable to Venezuela, and possibly to Kuwait and
Saudi Arabia, but the exceptions are simply too small. With everything riding on their oil revenues, they must fear making another big mistake. After 1981, nearly every member was
overspending its revenues. The cash squeeze made each one bitterly resist any reduction in volume or in price. Yet both were needed.
Table II is not a model, but it does show that OPEC's first concern is the interplay between what would be good for the group as a whole and what would serve the largest single member. The three problems which OPEC needed constantly to keep solving and re-solving were: price, total output, and output division.
The far right-hand panel of Table II shows the long-run result of a 10 percent sales tax on oil products, assumed to be fully
passed on. OPEC loses 27 percent of its sales revenues. Nothing else was to be expected, yet we must note with amazement that
when OPEC nations threatened to retaliate for tax increases with additional price increases, they were taken seriously in the consuming countries.
The awakening The story of the 1980s is OPEC's slow
realization that the the real world is in Table II and the lower, not the upper, line of Figure 4. They had to awaken from the comforting dream of unexerted price-raising power, "lots more where that came from", and it was not easy.
But the sharper conflict was within the group. Even in the 1970s, when prices were being raised, market division was always Topic A at OPEC meetings. From the squabbles of 1975-1977 they had progressed to the secret agreement of 1978, the proposed safety net of end-1979, and the gentlemen's agreement of 1980
(aborted by the Iran-Iraq war). Ahead were an endless succession of annual and quarterly and special meetings and agreements.
The price decline during 1982-1985 was relatively mild, showing OPEC members' impressive cohesion. But power is not wisdom. They were unable to cooperate to share the burden of lower output, and they let all the pressure flow on to Saudi Arabia. By 1985, total OPEC sales were 29 percent of the Market Economies' consumption, and Saudi Arabia was only 6 percent. Table II shows how elastic their demand had become.
In late 1985 the Saudis refused to keep carrying the rest of the cartel, and the price collapsed. In 1985-86, unlike 1983, it took not two but nearly nine months to patch together an accord at a price whose deflated value was about half where it had been
in 1981.
From late 1986 to mid-1990, despite reviving OPEC exports, and disappearing excess capacity, they could not get the price up, and it was always in danger of further decline under the pressure of discounting. Saddam Hussein was the savior in July
1990 and a demon in August. When he failed and was kept out of the world market, the rest of the cartel benefited, but could barely cope with the zero-sum game of market division, and failed
to raise the price.
There, at the end of 1992, we must leave it. STRUCTURAL CHANGES IN THE 1980s
Dis-integration and spot and term prices Outside of Nigeria, Indonesia, and some Persian Gulf remnants, the multinational oil companies had been formally stripped of
ownership by the mid-1970s. But they had remained in charge of producing operations, and marketed most or all of the host government's production. They were compensated by a price
preference or margin. But this connection was jolted apart by the rapid increase in spot prices beginning in late 1978.
For over two years, as supply fears swelled the demand for hoarding and speculation, and raised spot prices, the producing governments repeatedly raised their official prices in pursuit of spot. They disregarded contracts, openly or by various fictions. Some would add various non-money elements to the price,
principally destination restrictions. It was often forbidden to resell to South Africa or Israel, or the United States.
10 There is no evidence that these restrictions had any effect on the actual pattern of shipments. At most, they allowed the non-restrictors to charge a slightly higher price. But
restrictions helped weaken or destroy the force of contracts. Strangely, some commentators saw these restrictions as permanent. They did not explain how a market could remain with permanent excess demand. But by June 1982, the OPEC state oil companies had discarded the restrictions, even Saudi Arabia. [PIW 6-28-82:1] They were costly. [PIW 7-26-6-28-82:1]
The multinational companies ceased to sell OPEC crude oil. In a few countries (Abu Dhabi, Nigeria and Indonesia the most important) they lifted oil for their own use. Term contracts shrank greatly in importance, "thanks to quarterly price reviews and phase outs and unilateral mid-quarter price changes."
Security of supply was proved non-existent. "Japanese buyers in particular feel hard done by in their past term dealing with OPEC suppliers." [PIW 4-5-82:1]
Customer-supplier relationships continued, to a lesser degree, because they saved transaction costs, of search and negotiation. But prices were not fixed in the term contracts. They were linked to the spot price, which fluctuated over and under term prices, depending on short-run market conditions. (In 1988-1991 inclusive, term prices were perceptibly lower. (Below, p. 181)
In Saudi Arabia, Aramco became Saudi Aramco, and the four companies (Chevron, Exxon, Mobil, Texaco) who had once been its
manager-operators became suppliers of special management and engineering skills. The four companies bought at a small fixed differential from a contract price which was close but not
identical to the spot price.
"Commoditization" With dis-integration, short-term
bargains, and great price volatility, oil markets were rapidly "commoditized." [Verleger 1987] The general and trade press was supplemented by many individual services reporting prices in great local detail, by place and even time of day.
Markets rapidly developed in the forward sale of physical volumes of crude oil, notably Brent in the North Sea and Dubai crude oil at the Persian Gulf. Much more important were the various futures markets. In 1978, futures trading began in middle distillates (heating and Diesel oil). In the early 1980s, markets were set up for futures in other products and in crude oils. By late 1990, there were "about 10 active futures contracts trading worldwide, with combined daily volume equivalent to over 150-million barrels a day, or 130% more than total world demand."
[PIW 1990, p. 1]
Refiners and marketers, who depend on relatively thin
margins between the purchase price and resale price, can lose all profit and run big losses when even relatively small price
changes occur between the time they buy and the time they resell. Companies producing oil are at lesser but considerable risk
because of fixed tax payments. All of them urgently need markets where they can hedge against unforeseen fluctuations, and "lock
in" the current price. In late 1982, this was still a novelty. [PIW 10-18-82:1, "Refiners locking in future profits through oil futures trading."] It soon became routine.
Buying or selling futures transfers the risk to speculators, who are expected to win some, lose some, but on balance make a profit. It seems to be agreed that these markets have worked well, and provide liquidity and insurance to buyers and sellers. The futures markets now extend to three years from the date of the transaction, though the great bulk of the transactions are for 18 months or less.
Moreover, a set of futures markets provide information to the spot markets. Thus spot quotations have become better market indicators.
There has also been a limited synthetic long-term market through "swaps", a practice borrowed from the currency market.
[PIW 1990][Arshi 1992] Here a financial institution or sometimes a large non-financial company provides a fixed price to a buyer or seller, for a period which may be as long as ten years, but rarely exceeds three. The provider tries to make a bargain with a seller to offset every bargain made with a buyer, e. g. promising a refiner a fixed price for his sales and an airline a fixed
price for their jet fuel purchase. Thereby the provider avoids much or perhaps all of the risk. This is rarely attained. More commonly, the provider lays off the risk in the futures market.6
6 Spot prices and futures/forward prices were decried as "speculative", fly-by-night, no solid rock on which to base an industry. This was nothing new. Spot prices were dismissed and belittled in the early 1960s, when they
13 In contrast to the futures market, where the "open interest" is published, not much is publicly known about the size of the swaps market. In theory, swaps could provide finance for
investment in production, especially by governments strapped for cash. A variant of the swap is the simple pre-selling of oil, which in effect is an extension of credit from buyer to seller. This has not amounted to much, partly because the credit standing of most OPEC governments remains poor. But efforts will
undoubtedly continue as the OPEC countries try to find capital without capitalists.
The success of forward and futures markets has also
highlighted their limitations. Refiners/marketers and others can use these markets to cope with the kind of incessant up-and-down of margins, caused by seasonal changes, inventory overshoot, and changing refining patterns. But they can at best soften the
larger fluctuations caused by unforeseeable cartel actions. Forward bargains cannot be struck for more than a few months at most, and the insurance of futures contracts cannot be stretched past 3 years, because there is no assurance against big and
ruinous changes.
Illusion: "the market sets the price" The wealth of
quotations, and the constant interaction among them, give color to a half-truth: that "the market sets the price." Of course it
were first regularly reported. Invective shows there is more competition than the name-callers would like.
14 does; but who controls the market? Under competition, nobody does because nobody controls supply. Since the OPEC nations change supply up or down to set the price, they control the market. The various reporting systems discover the price, but they do not determine it.
Open markets promote competition But the existence of wide liquid markets has made one real difference. It has become easier for a producer to "find a home" for crude oil, or for a buyer to find crude oil. This has made competition more active. It has become harder to maintain an above-competitive price. There are too many parties constantly probing for a slightly better deal. In previous times, when most crude supply went through the
multinational companies, there were two great conservative
forces: inertia, and respect for each others' turf. There were few challenges to the customary price. After the early 1980s, as many sellers looked constantly for buyers, and many buyers looked for sellers, the challenges were many. More than ever, the price had to be maintained by deliberate changes in supply. Thus the "clumsy cartel" had to intervene often, and made the price more volatile. The transition still had some way to go, and was not complete until the mid-1980s.
NON-OPEC SUPPLY
The increase in non-OPEC production actually exceeded the drop in world oil consumption. This was a surprise. The powerful consensus had been "limited resources." Oil supply was expected to run down everywhere except at the Persian Gulf.
15 The famous 1977 CIA report on the Soviet Union merely put in writing what was generally believed: it was an old played-out province. Falling output and rising "needs" or "requirements," would make it an importer by 1985. As Yamani summed up: "All the
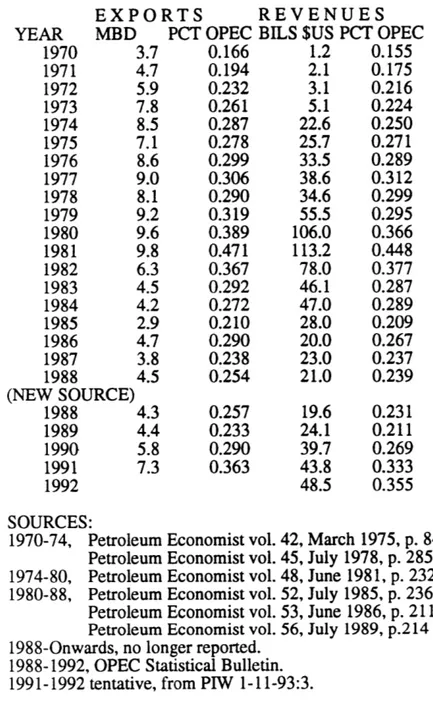
available studies point to the fact that the Soviet Bloc will be definitely importing oil sometime in the eighties...." [PIW 3-9-81:SS2] Instead, exports from the Communist blocs to the market economies, which were 1.8 mbd in 1976 (the base year of the CIA report) rose steadily to 2.9 mbd in 1985. [BP 1985 p. 18] (Some have suggested that the CIA report shocked the Communist high command into taking remedial steps. No support has been shown for this.)
But the non-Soviet non-OPEC countries increased output from 17 million barrels daily in 1973 to 18.7 in 1978, and then to 25.9 mbd in 1985. By that time, it seemed that higher prices had done their work on the demand and the supply side. When prices
collapsed in 1986, "symmetry" required a surge in demand and a collapse in supply. But the revival in consumption was well short of "symmetrical." And the drop in non-OPEC production did not happen at all.
It would be tiresome to cite the many bad predictions. But an impressive work with many authors forecast lower non-OPEC production in the 1980s, despite higher prices, because of the powerful resource constraint. [EMF 6, 1982] Instead prices slid,
collapsed and only partly recovered; yet non-OPEC output actually rose.
[TABLE III: National Petroleum Council (NPC) Projections]
Table III is based on projections drawn up in mid-1986 by a task force of the National Petroleum Council, which can draw upon an incomparable richness of experience among its constituent oil companies. They assumed alternatively a $12 price increasing at 4 percent annually, and an $18 price rising at 5 percent. We can compute their implicit supply elasticities, which range from a low of 0.11 to a high of 0.47. They obviously regarded the price drop of 1986 as being such a cataclysm or divide that one should not compute smooth functions across it. I would agree. But at either $12 or $18 per barrel, they could see nothing but
declining output. For the USA, given a price halfway between $14 and $22, the predicted 7.4 mbd is exactly.right. But the other non-OPEC sources all produced substantially more than expected. Obviously there has been some powerful offset to the lower
prices. We need to look at the connection among price, cost, and the inducement to invest.
Price, cost, and value A higher price increases the reserves in a project, and the value per barrel. First, the life of the reservoir is extended. If the daily operating cost of running an oil well is $100, and the price is $10, the well must produce at least 10 barrels daily or be shut in. At a price of $20, it can continue until it produces less than five barrels.
Second, the higher price makes it profitable to develop more intensively. This raises the needed investment, but it raises the present value even more. [Adelman 1990] Thus more is produced,
'I ABLE Ill. NATIONAL PETROLEUM COUNCIL (NPC) PROJECTIONS
OF NON-CARTEL OUTPUT UNDER LOWER PRICES
YIiAR 1985 1990 1991 1995 2000
(ACTUAL) ( projected ) (ACTUAL) ( projected )
()il. PRICE 25.67 14.04 21.88 17.09 17.08 27.92 20.78 35.64
CRUDE OIL PRODUCTION (million barrels daily)
SISA 8.9 7.1 8.0 7.4 5.7 7.0 4.5 6.4 W lFUROP 3.8 3.3 3.5 4.2 2.6 3.1 2.0 2.6 ()TI IER 9.7 6.5 7.6 11.6 6.6 7.9 6.4 7.5 N(I 2.7 2.5 2.6 3.1 2.4 2.6 2.2 2.4 B. ELASTICITIES I ISA 0.25 0.43 0.62 W EUROPE 0.11 0.37 0.47 ()Ti IER 0.36 0.36 0.29 NG;IL 0.11 0.18 0.19
S(I URCE: Survey conducted by Chevron for National Petroleum Council Reported in PIW, 10-6-86:3; OGJ 10-13-86:40
I)AI'A: OGJ 3-9-92:25; liquids from EIA, International Petroleum
Statistics Report July 1992, p. 5
Prices are for "total OPEC", published in Monthly Energy Review. Because the NPC takes "$12 oil" as the basis for increase at 4
percent, we use the price for "total OPEC", which was $12.21 in 1986.
1986 and $17.09 in 1991.
Other" production excludes Communist blocs. N()TE: Elasticities by formula E=ln(Q1/Q2)/In(PI/P2)
17 and sooner. Third, projects which were previously uneconomic are now worth undertaking.
But taxation and regulation may turn these rules upside down. We will look at some important examples, then try to draw the general rule.
The United States ex-Alaska [Adelman 1992] The discovery of large oil fields had peaked in 1929, and dwindled thereafter. Yet the amount developed into new oil reserves each year increased for thirty years, then stabilized around 1960. The unit cost per barrel added tended if anything to decrease through 1972. The decrease was mostly a one-time gain, the retreat from "market demand prorationing", a wasteful cartel of the more important producing States. [Adelman 1964] There is a hint worth
considering later.
What would have happened absent the first price explosion, we do not know. But the price rise plus oil price controls and pre-existing gas price controls worked a misfortune. Oil wells vary greatly in cost. Even taking only depth as an independent variable, in the USA the most expensive tenth of all wells absorb half the capital expenditures. For deep or exotic oil or gas
projects, which hard-working lawyers could somehow winkle into an exempt uncontrolled-price class, profits were huge. Investment in these projects boomed, raising factor prices and imposing
bottlenecks everywhere. Unit costs soared. This depressed the development of known fields, which produced the crude oil whose price was under control. It was an attack on the very process
18 which had kept the USA oil-gas industry in being--the continuing expansion of old fields.
Hence as prices rose, the reserves-added in the early 1970s were wretched--the lowest in decades. The decline in production was much slower, of course, from just under 9 million barrels daily in 1973 to just under 7 million by 1980. The decline would have accelerated, had not price controls begun to be limited, then abruptly ended in 1981. Reserves-added and production then
increased, despite weakening prices, until the collapse of 1986. Gas prices were not decontrolled but they had been considerably raised in early 1979.
Thus the effect of prices plus controls in the USA before 1980 was the contrary of what would have happened under
conditions of competition and stable taxes. Output declined when prices rose, rose when prices fell, declined again when prices fell very sharply. We cannot of course tell what would have
happened had the process continued, of diminishing returns versus increasing knowledge. But it could hardly have been so abrupt.
The new areas: Alaska, North Sea, Mexico We showed in a previous paper that all three were profitable and would have been
developed at prices existing before the first price explosion. In Mexico, output went from half a million bd in 1972 to over 3 mbd
in 1982. The national oil company Petroleos Mexicanos (Pemex) was the gaudy exemplar of investment spending for jobs, contracts, and payoffs. Its burgeoning revenues propped up the existing national economic policy of dirigisme and deficits. It was made
much worse by the confident expectation of revenues forever soaring as prices and outputs rose. With roughly 50 billion
barrels in reserves, and current prices exceeding $30 per barrel, the simple "Hotelling Valuation Principle" (value in ground
equals net wellhead price) would have yielded a current in-ground value of up to $1500 billion. To borrow only $60 billion abroad was conservative.
The resulting financial crisis starved Pemex and led to massive disinvestment in oil production. Published money figures
are indecipherable, but wells drilled in Mexico fell by 76 percent, from 434 in 1980 to 103 in 1987. We cannot tell how many of the wells were uneconomic, drilled to provide jobs and
contracts for local caciques. Mexican policy in the financial p crisis was as prescribed by the school of Nicholas Kaldor at
Cambridge (U.K): more nationalization, more barriers to imports, more subsidies, and more regulation. (For a good brief account, see [NYT 10-24-82:1F])7
The policy was slowly reversed after 1982, then more quickly under President Salinas after 1988. But revival and cleaning up the debris of decades of mismanagement is painful and slow.
7 Kaldor thought oil prices should be kept high. "The very large expenditures incurred on prospecting and developing new fields since the war would not have been possible if oil had fluctuated in price in the same way as
copper or tin. ... Recently there was a threat of a collapse of oil prices due to reduced demand which (in my opinion) was rightly received with a great deal of misgiving, even by the large oil-importing countries: since they realized that in the long run they are likely to fare worse under a regime of fluctuating oil prices than under a regime of stable prices, even though the latter would be a relatively high one in terms of industrial goods." [Kaldor
20
Output has held steady around 3 million barrels daily. It is botha tribute to many unsung engineers and workers, and an indication of how much fat there was to squeeze out. Thus the higher price levels resulted in less not more Mexican supply in the world market.
In the countries of private enterprise, the booming prices led to drastic tax increase to capture the windfall rents. In Alaska, it is not clear whether they inhibited expansion. Alaska reached 1.2 mbd by 1978, and slowly expanded for the next ten years, reaching just over 2 million in 1988, then declining, at 4 percent per year.
In the North Sea, the largest and earliest discoveries had been off Norway, and as late as 1975 Norwegian output was-six times British. But the UK expansion was far more swift, and one reason was a more flexible tax regime, particularly after 1979. British offshore production peaked at 2.6 mbd in 1984-1986, then declined and revived. A comprehensive survey by County Natwest Woodmac expects the UK to regain the peak in 1995 as fields under development come on stream. [OGJ 8-17-92:50]. Norwegian
production expanded steadily, and the combined North Sea rose throughout the period. There were strong cost reductions in the North Sea, where the slowdown gave designers the chance to
optimize with respect to prices and costs long run, instead of trying to maximize haste--which made for great waste.
Other non-OPEC producers There remained the miscellaneous "all others." Their output rose from 5.4 million barrels daily in
1973 to 10.3 mbd in 1992, an average 3.5 percent per year. Here too, "supply elasticities" were overlaid by more important
changes in costs and taxes.
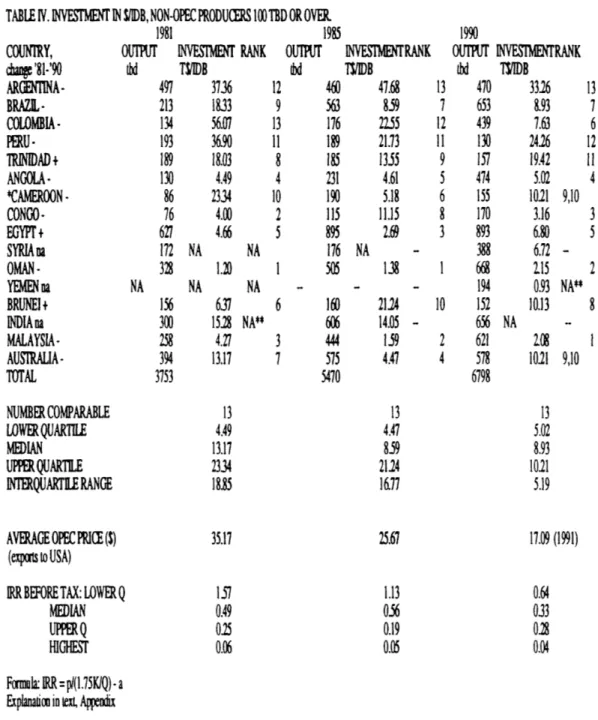
[TABLE IV: Non-OPEC Producers]
Non-OPEC Investment Requirements Table IV shows the investment per daily barrel in the 13 most important non-OPEC producers outside North America, i. e. those which by 1985 were up to 100,000 barrels daily. Their production rose from 3.8 mbd in 1981 to 6.8 mbd in 1990. 8
The calculations can all be replicated from sources publicly available. Anyone with access to better data can (and I hope
will) substitute them for ours at any point. In particular, they may be able to improve on the averages we have been compelled to use.
The start of the estimate is all wells drilled in the country in a given year. This overstates, because some wells, especially dry holes, are not for oil development but for exploration, or for gas production. The next step is to raise drilling costs 20 percent to allow for the non-linearity of the
8 A rare bit of published data: Arco in Indonesia expected total
Indonesian oil capital expenditures to be around $300 million during 1983. "This will help push production...to about 220,000 barrels a day from 120,000." [NYT 6-8-83:D9] This suggests the capital coefficient was $3,000 per daily barrel, close to the average in neighboring Malaysia. An offshore development well drilled to 3800 feet is said to cost $1261 thousand; the 1990
[API-JAS] gives the class at $1136. "Costs associated with offshore
development [in South East Asia] are similar to those in the Gulf of Mexico." J.A. Khin and D. Johnston, "Southeast Asia Drilling on the Rise," [OGJ 9-28-92:66, 70]
TABLE IV. INVESTMENT IN $/IDB, NON-OPEC PRODUCERS 100 TBD OR OVER.
COUNTRY,
chae
'81-'90
ARGMENINA- BRAZLCOLOMBIA PERU -TRINIDAD+ ANGOLA- *CAMEROON- CONGO-EGYIPT+ SYRIAna OMAN-YEMENmna BRUNEI+ INDIAna MALAYSIA - AUSTRALIA-TOTAL INVESIfN RANK TWDB OUlFPU Nd 1981 OUTPUT tbd 497 213 134 193 189 130 86 76 627 172 328 NA NA NA NA** NUMBER COMPARABLE LOWERQUARTILE MEDIANUPPERQUARTILE
INTERQUARTIE RANGEAVERAGE OPEC PRIE ($)
(exports to USA)
IRR BEFORE TAX: LOWERQ MEDIAN
UPPERQ
HIGHEST 13 4.49 13.17 2334 18S5 35.17 INVESTENTMRANK TS$IDB NA 6 160 606 3 444 7 575 5470 OUTPUT INVEENTRANK tNl T$/IDB 3736 12 460 18.33 9 563 56.07 13 176 36.90 11 18918.03
8
185
4.49 4 231 2334 10 190 4.00 2 115 4.66 5 895 NA NA 176 1.20 1 505 13 4.47 859 21124 16.77 25.67 Formla: IRR pl(1.75KQ)- a Explanation in text, AppendixNOTE: An increasing ratio of investment per IDB to oupt indicates rising cost, denoted by +. A lower ratio indicates declining cost, denoted by-.
Te comparis isof 1981 with 1990.
*Offshore only **Not available in a later or
earlieryear, ence rank eliminated
IRR BEFORE TAX, ASSUMING TRUE INVESTMENT 15 TIMES INDICATED (USER COST ALLOWANCE)
LOWER Q
MEDIAN QUPPER
Q
HIGHEST 3326 8.93 7.63 2426 19.42 5.02 10.21 3.16 6.80 6.72 215 0.93 10.13 47.68 13 470 859 7 653 22.55 12 439 21.73 11 130 1355 9 157 4.61 5 474 5.18 6 155 11.15 8 170 2.69 3 893 388 138 1 668 - 194 21.24 10 152 14.05 - 656 IJ9 2 621 4.47 4 578 6798 13 5.02 8.93 1021 5.19 17.09 (1991) NA** 9,1022 depth-cost relation, then double to allow for the difference
between the USA and the rest of the world. Finally we apply the USA allowance for non-drilling costs: lease equipment, enhanced recovery (gas and water injection, thermal and chemical methods, etc), and overhead.
The investment is divided by the gross capacity increment, estimated as the number of newly drilled oil wells multiplied by the average production of all oil wells. I think newly drilled wells tend to be bigger producers than average old wells. If so, the true increment to capacity is greater than as estimated, and the investment per unit is overstated. Whether and to what
extent capacity is really cheaper to install than we have calculated, must be left for later research. There is some confirmation in our calculation of decline rates (below, page 120).
Although one year's results may be temporarily high or low, the rankings stay fairly consistent. The measure is affected by changes in factor prices. The IPAA measure decreased by one
fourth between 1981 and 1985, then rose nearly 7 percent to 1990. More important are changed technology and the mix of projects.
In a given project, the greater the output, all else being equal, the greater the pressure on the reservoirs. Therefore a decrease in cost might reflect only less intensive development, or the culling of more expensive projects. If cost declines despite higher output, that is a good indication of a rightward shift in the supply curve, which is our concept of declining cost,
23 indicated by a (-) sign. If cost rises despite declining output, that signals a leftward shift (+). If cost and output change in the same direction, the larger change, in output or in cost, decides the sign.
Had the expectation been borne out, of lower output in the 1980s despite higher prices, the signs would have all been (+). Trinidad and Brunei do show increases. Peru, Egypt, and Oman are ambiguous. But most countries decreased. The median investment fell sharply from 1981 to 1985, then held. So did the lower-cost quartile. The more expensive countries improved sharply.
Table IV shows why predictions of declining output in 1981 and later years were and are far-fetched. Returns were very high on new development projects. From Table IV, we have an indication of the rate of return in oil development. The general break-even formula is explained in Appendix A. The bottom panel is a rough allowance for exploration cost/user cost.
During 1981-1990, the price (here measured by the average OPEC price on export sales to the USA) fell by half, but rates of return stayed high. Most interestingly: the return in the lowest cost countries fell from 1981 to 1990, but in the higher-cost countries it actually rose.
If costs and prices determined investment, we might expect with some confidence that output would keep rising for the group
as a whole. But costs are less important than taxes.
The taxation of oil production More important than cost changes, perhaps even in the North Sea and certainly outside of
it were changes in tax systems.9 The ideal system induces the operator to invest for maximum present value before tax, and
captures all economic rents, to offer the investor just enough prospective profit to make the investment worth while. The higher
the pre-tax rent, the higher the tax. With no rent, no tax. The ideal tax is progressive, not for equity but for efficiency. Suiting a tax system to a mineral industry is particularly difficult because of the difficulty of reckoning cost. In the United States, a rough but effective way to capture rent has been: cash bonus bids. The oil company is invited to estimate how much they expect to earn, over and above cost of exploration, development, and production; and to offer as much of it as they
think is needed to get the lease. U
Under stable conditions, bonus bidding is a very efficient rent-skimmer on the whole, with large individual gains and
losses. Even under unstable conditions, it seems to have worked well. The research of [Mead 1986] [Mead and Sorenson 1980] showed
that the return on oil leases won by bidding was normal or even subnormal. Other features of the tax system, notably the excises and royalties (a private tax) were shown by [Lohrenz et al 1981] to lessen investment and production, as in theory they should. But a cash bid system only works where the number of bidders is large enough to insure independent i. e. competitive bidding. The
9 The following account is based on [Bradley 1986] [Eckbo 1987], [Smith 1987], [Bradley and Watkins 1987] [Kemp 1987] and [Kemp and Reading 1992]
25 industry in the USA was large and long-established and the public was willing to (correctly) assume competition. Elsewhere, with
the partial exception of Canada, this was not the case.
The other vehicle for rent absorption, the "resource rent tax" was worked out in concept by [Garnaut and Clunies-Ross 1975]. Its practical difficulties are great. [Bradley 1986]
[Bradley and Watkins 1987] But an incomplete study [Eckbo 1987] concluded at least tentatively "that a resource rent tax combined with cash bonus bidding would capture rent in a tax neutral
fashion and behave robustly."
No country, however, has devised a tax system to capture rent and be neutral to investment. Even outside the third world, the air is thick with mistrust of private especially foreign
companies who had designs on the nation's precious bodily fluids, or crown jewels, or whatever metaphor took the place of thought. Taxes were badly designed or hardly designed at all. Changes were a patchwork; some fields were actually subsidized, while others were overtaxed. The higher prices of the 1970s led to taxes even
less tied to rent than previously.
There were also hidden regressive taxes, like requiring
crude oil or refined products to be sold at specially low prices; putting customs duties on machinery or materials; favoring or
requiring local labor or suppliers; local graft and/or
corruption"0; and so on. The two price explosions led to hasty ad
"1 An oilman explained: "Graft is when you must pay someone in the
Government to do what he should do without payment. Corruption is when you pay him to do what he should not do."