Associated with Practicing Reasoning Skills
The MIT Faculty has made this article openly available. Please share
how this access benefits you. Your story matters.
Citation
Mackey, Allyson P., Alison T. Miller Singley, Carter Wendelken, and
Silvia A. Bunge. “Characterizing Behavioral and Brain Changes
Associated with Practicing Reasoning Skills.” Edited by Sam Gilbert.
PLoS ONE 10, no. 9 (September 14, 2015): e0137627.
As Published
http://dx.doi.org/10.1371/journal.pone.0137627
Publisher
Public Library of Science
Version
Final published version
Citable link
http://hdl.handle.net/1721.1/99880
Terms of Use
Creative Commons Attribution
Characterizing Behavioral and Brain Changes
Associated with Practicing Reasoning Skills
Allyson P. Mackey1*, Alison T. Miller Singley2, Carter Wendelken2,3, Silvia A. Bunge2,31 Department of Brain and Cognitive Sciences, Massachusetts Institute of Technology, Cambridge, MA, United States of America, 2 Department of Psychology, University of California, Berkeley, Berkeley, CA, United States of America, 3 Helen Wills Neuroscience Institute, University of California, Berkeley, Berkeley, CA, United States of America
Abstract
We have reported previously that intensive preparation for a standardized test that taxes reasoning leads to changes in structural and functional connectivity within the frontoparietal network. Here, we investigated whether reasoning instruction transfers to improvement on unpracticed tests of reasoning, and whether these improvements are associated with changes in neural recruitment during reasoning task performance. We found behavioral evi-dence for transfer to a transitive inference task, but no evievi-dence for transfer to a rule genera-tion task. Across both tasks, we observed reduced lateral prefrontal activagenera-tion in the trained group relative to the control group, consistent with other studies of practice-related changes in brain activation. In the transitive inference task, we observed enhanced suppression of task-negative, or default-mode, regions, consistent with work suggesting that better cogni-tive skills are associated with more efficient switching between networks. In the rule genera-tion task, we found a pattern consistent with a training-related shift in the balance between phonological and visuospatial processing. Broadly, we discuss general methodological con-siderations related to the analysis and interpretation of training-related changes in brain activation. In summary, we present preliminary evidence for changes in brain activation associated with practice of high-level cognitive skills.
Introduction
Fluid reasoning, the ability to solve novel problems, was once thought to be a fixed trait, stable across the lifespan and immutable to environmental factors. However, mounting evidence sug-gests that it comprises a set of skills that can be strengthened through instruction and/or prac-tice [1–9]. Previously, we have reported changes in the structural and functional connectivity of the frontoparietal network following 100 hours of preparation for a standardized exam that involves reasoning skills (the Law School Admission Test, LSAT) [10,11]. Here, we investigate whether LSAT preparation, i.e., practice with complex reasoning problems, leads to improve-ments on transfer tasks of reasoning, and changes in neural recruitment during performance of these tasks.
a11111
OPEN ACCESS
Citation: Mackey AP, Miller Singley AT, Wendelken C, Bunge SA (2015) Characterizing Behavioral and Brain Changes Associated with Practicing Reasoning Skills. PLoS ONE 10(9): e0137627. doi:10.1371/ journal.pone.0137627
Editor: Sam Gilbert, University College London, UNITED KINGDOM
Received: October 27, 2014 Accepted: August 20, 2015 Published: September 14, 2015
Copyright: © 2015 Mackey et al. This is an open access article distributed under the terms of the
Creative Commons Attribution License, which permits unrestricted use, distribution, and reproduction in any medium, provided the original author and source are credited.
Data Availability Statement: The data associated with this manuscript are available at (https://openfmri. org) (ds000160).
Funding: This study was supported by the National Institute of Neurological Disorders and Stroke Program Project Grant (NS040813, Lead Principal Investigator: M. D’Esposito; Co-Investigator: S.A.B) (http://www.ninds.nih.gov); National Science Foundation Graduate Research Fellowship to A.P.M. (http://www.nsf.gov); National Institute of Child Health and Human Development F32HD079143-01 to A.P. M. (https://www.nichd.nih.gov); James S. McDonnell Foundation Scholar Award to S.A.B. (https://www.
Reasoning involves relational processing, or the identification of individual properties of complex stimuli, as well as relational integration, or the joint consideration of previously sepa-rate mental relations [12]. For example, to solve a transitive inference question such as“If Bill is taller than Dan, and Dan is taller than Matt, is Bill taller than Matt?”, it is necessary to pro-cess the relationships between Bill and Dan and between Dan and Matt in order to infer the relationship between Bill and Matt. The Analytical Reasoning subtest of the LSAT taxes rela-tional processing and integration. As a simplified example, consider the following premises for ordering objects A through D: 1) A is before B, 2) C is before D, 3) C is not directly next to D, 4) B is not last, 5) A is not first. These premises need to be integrated to determine the correct order: CABD.
Tasks requiring relational integration rely on the close cooperation of several prefrontal and parietal regions [13–15]–in particular, the area around the intraparietal sulcus (IPS),
rostrolat-eral prefrontal cortex (RLPFC), and, depending on the task demands, ventrolatrostrolat-eral PFC (VLPFC) and/or dorsolateral PFC (DLPFC). Reasoning practice, then, could alter patterns of activation at one or more of these frontoparietal nodes [16], in addition to changing the con-nectivity between the nodes, as we have observed previously [10,11]. Further, reasoning prac-tice could lead to a qualitative change in the brain regions involved in reasoning. For example, because LSAT instruction techniques focus on drawing spatial diagrams to tackle text-based problems, participants could shift their reasoning strategies from a verbal to a spatial approach, leading to shifts in the cortical resources brought to bear on reasoning tasks. Finally, because reasoning involves many cognitive processes in addition to relational processing and integra-tion, reasoning practice could lead to changes in the interactions between the frontoparietal network and other networks.
Because reasoning relies on abilities such as perceptual processing, attention, and working memory, reasoning practice may lead to improvements in these supportive skills. However, evidence for this type of cross-transfer is mixed [16–21]. Further, the reasoning instruction paradigm selected for this study intentionally minimized the working memory demands of complex reasoning problems by teaching students to break problems into tractable pieces and write down intermediate steps. Because of the nature of the instructional strategies employed during LSAT preparation, we predicted that we would observe selective gains in relational rea-soning, but were also interested in assessing the reach of transfer to other cognitive skills.
In the present study, we tested whether reasoning instruction led to improved performance on two reasoning tasks: a transitive inference task and a rule generation task. Both tasks included a condition that involved relational processing alone, and a condition that involved both relational processing and integration. Further, we investigated whether reasoning instruc-tion was associated with changes in brain activainstruc-tion during performance of these tasks. Finally, we examined whether reasoning instruction transferred to measures of matrix reasoning, working memory, and processing speed. To our knowledge, this is the first study to examine the effects of reasoning instruction on task-related brain activation.
Methods
Ethics Statement
Research was approved by the Committee for the Protection of Human Subjects at the Univer-sity of California, Berkeley. Written informed consent was obtained from all participants.
Participants
Participants in the LSAT group were recruited from the Blueprint Test Preparation course—an intensive, effective course that prepares students for the LSAT. This course consisted of 100
jsmf.org). The funders had no role in study design, data collection and analysis, decision to publish, or preparation of the manuscript.
Competing Interests: The authors have declared that no competing interests exist.
hours of classroom time: 35 for Logical Reasoning, 35 for Analytical Reasoning, and 30 for Reading Comprehension. Logical Reasoning instruction focused on the rules of formal logic. Analytical Reasoning instruction taught students to integrate multiple rules to determine the sequence or arrangement of a group of items. Reading Comprehension instruction covered tips for answering questions about short passages. A sample test is available athttp://www.lsac.org/ docs/default-source/jd-docs/sampleptjune.pdf.
To control for the effects of participating in research at two time points, including practice effects on tasks, increased familiarity with the scanner environment, and developmental changes between time points, we also recruited a group of law students who did not pre-pare for the LSAT between scanning sessions. Control group participants were recruited through pre-law organizations on campus and online postings. The control group was matched to the LSAT group on age, sex, IQ, and days between testing sessions (S1–S3Tables).
During an initial screening session, participants confirmed that they had learned English before the age of five and did not have a history of psychiatric or neurological disorders. Partici-pants completed the Adult Self Report [22] (no participants met clinical criteria) and the Wechs-ler Adult Scale of Intelligence (WASI) Vocabulary and Matrix Reasoning subtests [23]. Control group participants were included in the study if their IQ scores were within one standard devia-tion of the mean for the LSAT group. After the initial screening session, participants visited the lab twice: once within two weeks of the start of their LSAT preparation course, and once within two weeks after completing the course, with a similar delay period for the control group.
We excluded participants for the following reasons: more than 3 standard deviation change in self-reported stress (Perceived Stress Scale [24]) or sleep (mean number of hours per night over previous two weeks; 1 participant from each group excluded from all analyses), head motion (mean displacement between volumes) of more than 3 standard deviations above the average across tasks (Transitive Inference: no subjects excluded; Letter Series: 1 from control group, 2 from LSAT group), or poor performance on the task (Transitive Inference: 2 from control group, 1 from LSAT group; Letter Series: 1 from control group, 1 from LSAT group). Poor task performance was defined as performance at or below chance on responded trials (50% for Transitive Inference, 25% for Letter Series) in either session and in either condition. One participant was included in the behavioral analysis of the Transitive Inference task but not the imaging analysis, because only one run was usable at time 2 (fingers slipped to the wrong buttons in the middle of the second run). Participants with excessive head motion were included in behavioral analyses. Transitive Inference data were available for 24 LSAT partici-pants (23 with usable imaging data), and 22 control participartici-pants. Letter Series data were avail-able for 17 LSAT participants (15 with usavail-able imaging data), and 23 control participants (22 with usable imaging data). Demographic details for the participants included in behavioral and neuroimaging analyses are presented inS1–S3Tables. Group sizes for each behavioral measure are described in the legend ofTable 1.
MRI Data Collection
Scanning was performed on a Siemens 3T Trio at the Brain Imaging Center at the University of California at Berkeley. Participants underwent a series of scans in the same order for every ses-sion. The scanning session included a high-resolution structural scan, the Transitive Inference task, a resting-state scan [10], the Letter Series task, and a diffusion-weighted imaging scan [11]. Both functional tasks were acquired with the same gradient-echo echo-planar imaging (EPI) sequence (TR = 2000ms, TE = 25ms, 33 axial slices, 2.0×1.8×3.0 mm voxels, no interslice gap, flip angle = 90°, field of view = 230mm). The Transitive Inference task was collected in 2 runs of 180 volumes each, and the Letter Series task was collected in one run of 165 volumes.
Transitive Inference
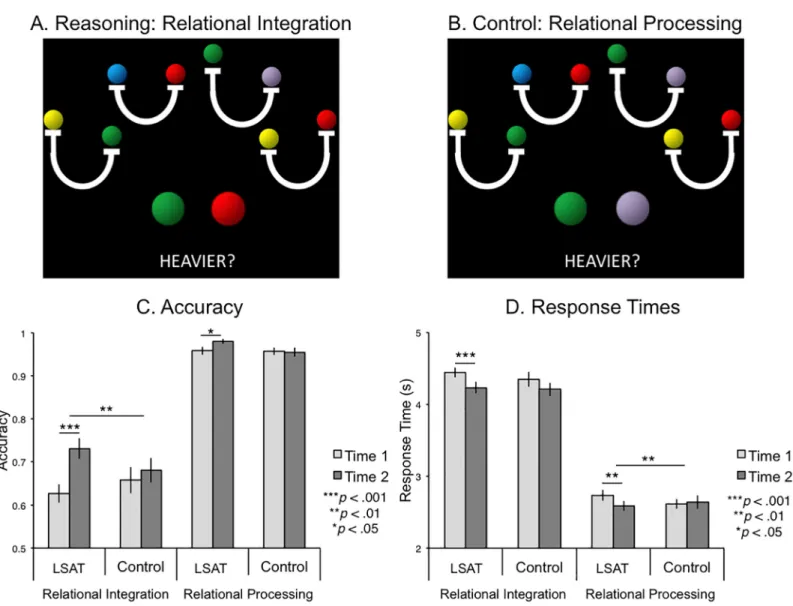
In each trial of this task (modified from [25]), the participant was presented with four“balance scales” that indicated the relationship between two colored balls. The participant was asked to make a judgment regarding which of two target balls was heavier, and to press with his/her right hand index finger if the ball on the left was heavier, and his/her middle finger if the ball on the right was heavier. In the Relational Integration condition, it was necessary to integrate relationships provided by two of the four scales (Fig 1A). In the Relational Processing condi-tion, the visual information was the same, but answering these questions required referencing only one scale (Fig 1B). This task was presented in an event-related design. Participants were given up to 6 seconds to answer. Jittered ITIs ranged from 0 to 8 seconds and accounted for 30% of total scan time.
Letter Series Task
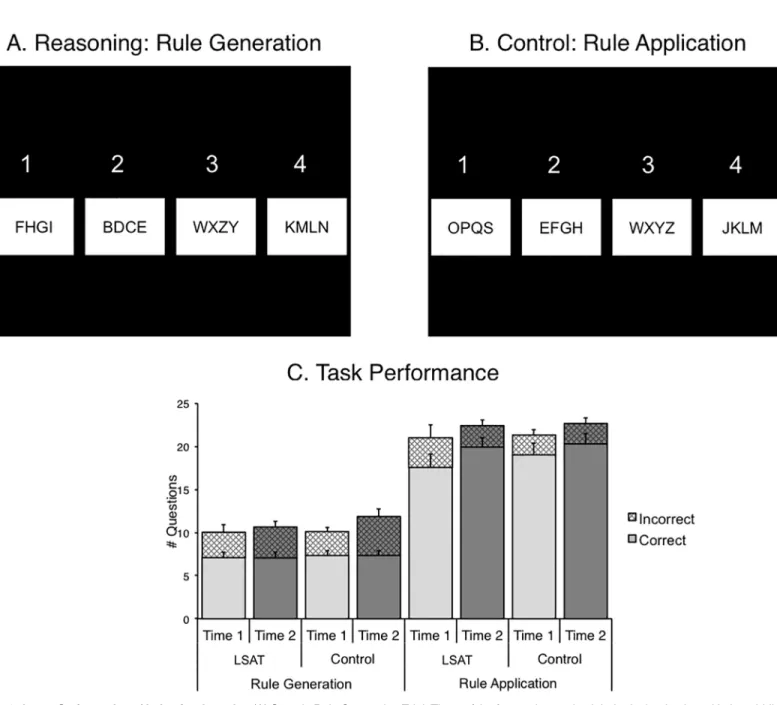
The Letter Series task [26] required reasoning about sequences of letters. The Rule Generation condition required participants to discover a rule common to three of four letter strings, and to identify the string that did not follow this rule (Fig 2A). The rule changed for every trial. Rules were based on alphabetical order (e.g., skip two letters), orthographic features (e.g., straight or curved lines), or consonant/vowel categorizations. The rules became progressively more com-plex over the course of the session. In the Rule Application condition of the task, participants were asked to identify which of four letter strings was not in strict alphabetical order (i.e., miss-ing a letter) (Fig 2B). At time 2, new stimuli were constructed following the same rules as the items at time 1, but using different letters so that participants would not remember the rules. The two conditions were completed in alternating 30s blocks of self-paced trials for a total of five minutes. Participants were instructed to respond only when they were confident that they were correct. Once a response was recorded, the next trial was presented without delay. Between blocks, a 3s cue was presented to instruct them of the condition of the next block.
Behavioral Assessments
Behavioral testing occurred at both time points. We included three tests of working memory: Digit Span (Wechsler Adult Intelligence Scale [27]), Computerized Spatial Span (Lumos Labs), and Reading Span [28], a complex working memory measure that involved holding a series of
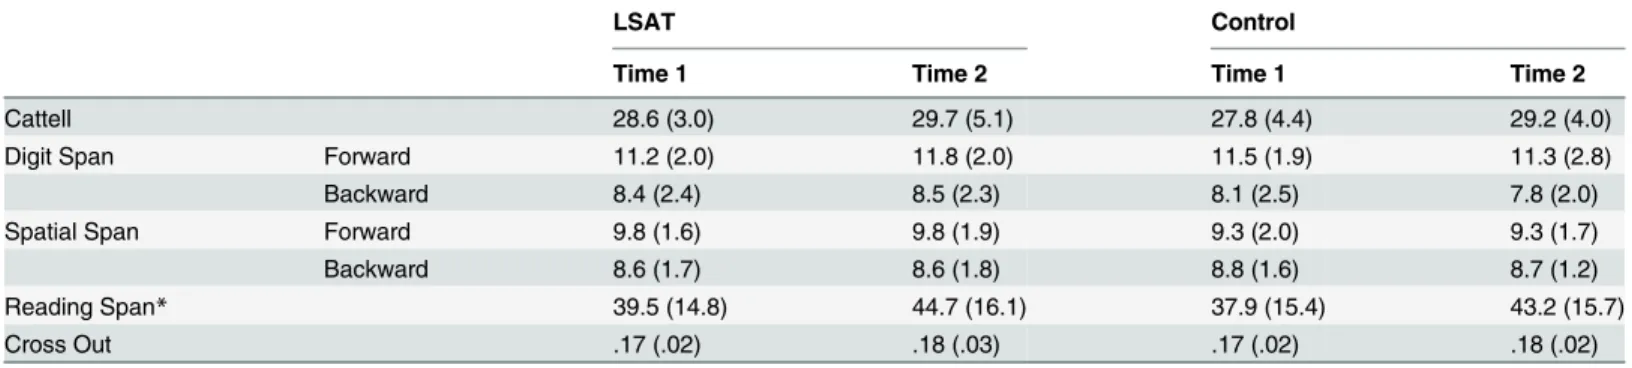
Table 1. Behavioral Measures. Data are presented asM(SD). Reading Span is Absolute Span. Cross Out data are correct items per second. LSAT Group: Cattelln = 25, Digit Span n = 18, Spatial Span n = 25, Reading Span n = 25, Cross Out n = 17. Control Group: Cattell n = 24, Digit Span n = 23, Spatial Span n = 24, Reading Span n = 24, Cross Out n = 17.
LSAT Control
Time 1 Time 2 Time 1 Time 2
Cattell 28.6 (3.0) 29.7 (5.1) 27.8 (4.4) 29.2 (4.0)
Digit Span Forward 11.2 (2.0) 11.8 (2.0) 11.5 (1.9) 11.3 (2.8)
Backward 8.4 (2.4) 8.5 (2.3) 8.1 (2.5) 7.8 (2.0)
Spatial Span Forward 9.8 (1.6) 9.8 (1.9) 9.3 (2.0) 9.3 (1.7)
Backward 8.6 (1.7) 8.6 (1.8) 8.8 (1.6) 8.7 (1.2)
Reading Span* 39.5 (14.8) 44.7 (16.1) 37.9 (15.4) 43.2 (15.7)
Cross Out .17 (.02) .18 (.03) .17 (.02) .18 (.02)
*LSAT group t-test is significant (t(24) = 2.2, p = .04). doi:10.1371/journal.pone.0137627.t001
letters in mind while judging whether sentences made sense (we report Absolute Reading Span). We also administered a test of spatial reasoning, the Cattell Culture Fair Intelligence Test III [29]. This test is a set of four timed tasks in which participants select pictures that com-plete an array, match an inferred rule, or have the same relationship to a prompt item. We chose this test because it contains two versions that could be counterbalanced across sessions by subject, and because it is sufficiently challenging that adult participants would not be expected to perform at ceiling. The two versions, A and B, were counterbalanced across time points, i.e., half of the participants took version A at time 1 and version B at time 2, and the other half took version B at time 1 and version A at time 2. Finally, we collected a measure of processing speed, Cross Out (Woodcock-Johnson III [30]), for a subset of participants.
Fig 1. Transitive Inference task and behavioral results. (A) Sample Relational Integration Trial: The scale on the far left indicates that green is heavier than yellow, and the scale on the far right indicates that yellow is heavier than red. Therefore, the answer to the question is the left button (pressed with the index finger) because green is heavier than red. (B) Sample Relational Processing Trial: The scale that is second from the right indicates that purple is heavier than green, so the answer is the right button, pressed with the middle finger. (C) Accuracy. (D) Response times for correct trials.
FMRI Data Analysis
FMRI data preprocessing was consistent across both tasks, and was carried out using FEAT (FMRI Expert Analysis Tool) Version 6.00, part of FSL (FMRIB's Software Library,www. fmrib.ox.ac.uk/fsl). The following preprocessing steps were applied: motion correction using MCFLIRT [31], slice-timing correction using Fourier-space time-series phase-shifting, non-brain removal using BET (Brain Extraction Tool [32]), spatial smoothing using a Gaussian ker-nel of FWHM 5mm, grand-mean intensity normalization of the entire 4D dataset by a single
Fig 2. Letter Series task and behavioral results. (A) Sample Rule Generation Trial: Three of the four series are in alphabetical order, but with the middle two letters switched in order. Choice 3 does not follow this rule, so it is the correct answer (pressed with the ring finger). (B) Sample Rule Application Trial: Choice 1 is not in sequential alphabetical order (missing "R"), so it is the correct answer (pressed with the index finger). (C) Task Performance: Number of trials answered correctly (solid, bottom of each bar) and number of trials answered incorrectly (hatched, top of each bar). The LSAT group answered significantly more Rule Application questions correctly at time 2 compared to time 1 (p < .05). The control group answered significantly more Rule Generation questions incorrectly at time 2 compared to time 1 (p < .05). No other measures changed significantly.
multiplicative factor, and high-pass temporal filtering (Gaussian-weighted least-squares straight line fitting, with sigma = 50.0s). Functional data were registered to anatomical space using FSL’s implementation of Boundary-Based Registration (BBR) [33]. Anatomical images were normalized to MNI standard space using linear registration, FLIRT [31,34].
For both tasks, the following covariates were included as nuisance regressors in the subject-level general linear models (GLMs): six motion parameters, average white matter signal, aver-age cerebrospinal fluid signal, and averaver-age out-of-brain signal. Time-series statistical analysis was carried out using FILM with local autocorrelation correction [35].
For the event-related Transitive Inference task, the following behavioral regressors were included: correct Relational Processing trials, correct Relational Integration trials, incorrect Relational Integration trials, and omitted Relational Integration trials. The duration of each trial was convolved with a double-gamma hemodynamic response function (HRF). We also included temporal derivatives of these regressors. Incorrect and omitted Relational Processing trials were not modeled because they were so infrequent. The two runs of the task were com-bined in a fixed-effects analysis for each subject. For the blocked Letter Series task, we included regressors for Rule Generation and Rule Application blocks, convolved with a double-gamma HRF. We also included temporal derivatives of these regressors.
For both tasks, we calculated the difference between time 1 and time 2 with a fixed-effects analysis for each subject. These difference images were submitted to mixed-effects analyses (FLAME1+2) to test for: 1) average activation across groups and times; 2) changes between time 1 and time 2 for each group; 3) between-group differences in change between time 1 and time 2 (group × time ANOVA). Z (Gaussianised T/F) statistic images were thresholded using clusters determined byZ > 2.3 and a corrected cluster significance threshold of p = 0.05 [36]. For visualization, results were registered to a standard template in Freesurfer 5.3 (fsaverage) [37,38].
Contrasts of parameter estimates were extracted for each subject at both time points from the clusters identified from the whole-brain analyses. Parameter estimates were averaged within group and within time point. T-tests were conducted between groups at time 1. Parame-ter estimates defined from the whole-brain group × time ANOVAs were subjected to separate t-tests within both the LSAT group and control group to determine whether the results were driven by changes in one or both groups. In addition, parameter estimates defined from the group x time ANOVAs were submitted to group x time analyses of covariance (ANCOVAs) controlling for time 1 values, to investigate whether these interactions were driven by group differences at time 1.
Results
Reasoning Tasks: Behavioral Results
On the Transitive Inference task, the LSAT group improved significantly on Relational Integra-tion trial accuracy between time 1 and time 2 (Fig 1C;t(23) = 5.29, p < .0001), and improved significantly more than the control group (group × time ANOVAF(1,44) = 7.7, p = .008). The LSAT group also improved significantly on Relational Processing trial accuracy (t(23) = 2.59, p = .02), but not significantly more than the control group (F(1,44) = 3.0, p = .09), likely due to ceiling effects. The effect of group on Relational Integration accuracy improvement was signifi-cant even after controlling for Relational Processing accuracy improvement (t(43) = 2.26, p = .03), so the improvement in relational integration cannot be fully explained by improved pro-cessing of individual relations. The LSAT group responded significantly faster for correct responses at time 2 on both Relational Integration (t(23) = 3.72, p = .001) and Relational Pro-cessing trials (t(23) = 3.36, p = .003); however, only the improvement in average response time
(RT) on the Relational Processing trials was significantly greater than in the control group (F (1,44) = 4.53,p = .04) (Fig 1D). There was a trend towards a correlation between decreased RTs and increased accuracy in both conditions (RI:r(22) = -.34, p = .1; RP: r(22) = -.34, p = .1), indi-cating that there was no speed-accuracy tradeoff. Further, the improvement in Relational Inte-gration accuracy was significantly greater in the LSAT group than in the control group, even after controlling for changes in RT (t(43) = 2.6, p = .01).
The Letter Series task was self-paced, so the number of questions attempted varied across individuals. Therefore, the most informative behavioral measures were the numbers of cor-rectly and incorcor-rectly answered questions for each condition. The LSAT group answered more Rule Application questions correctly at time 2 than at time 1 (Fig 2C;t(16) = 2.37, p = 0.03) and the control group did not (p = .26), but this group difference was not significant (p = .48). Neither group changed significantly from time 1 to time 2 on the number ofincorrectly answered Rule Application questions (ps > .2) or on the number of correctly answered Rule Generation questions (reasoning condition) (ps > .2). The control group answered signifi-cantly more Rule Generation questionsincorrectly at time 2 compared to time 1 (t(22) = 2.63, p = 0.02), but the LSAT group did not change significantly on this measure (p = .5). There was no significant difference between groups on change in the number of incorrect Rule Generation questions (p = .33).
Reasoning Tasks: Neuroimaging Results
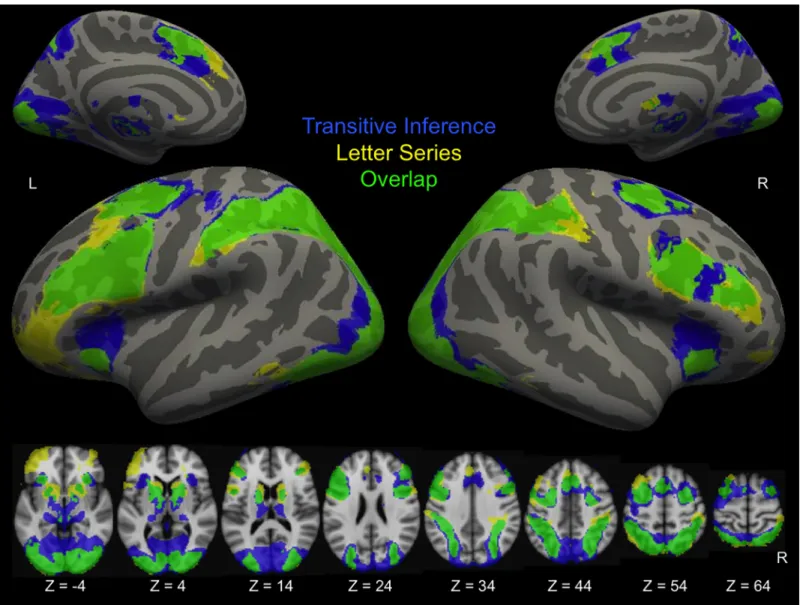
Across both groups and both time points, the conditions of both tasks that placed the strongest demands on reasoning (Relational Integration trials in the Transitive Inference task and Rule Generation trials in the Letter Series task) engaged partially overlapping areas of bilateral pre-frontal, parietal, and occipital cortices, namely RLPFC, DLPFC, VLPFC, dorsal anterior cingu-late, intraparietal sulcus, lateral occipital cortex, and lingual gyrus (Fig 3). Both tasks
additionally engaged areas of the striatum and thalamus.
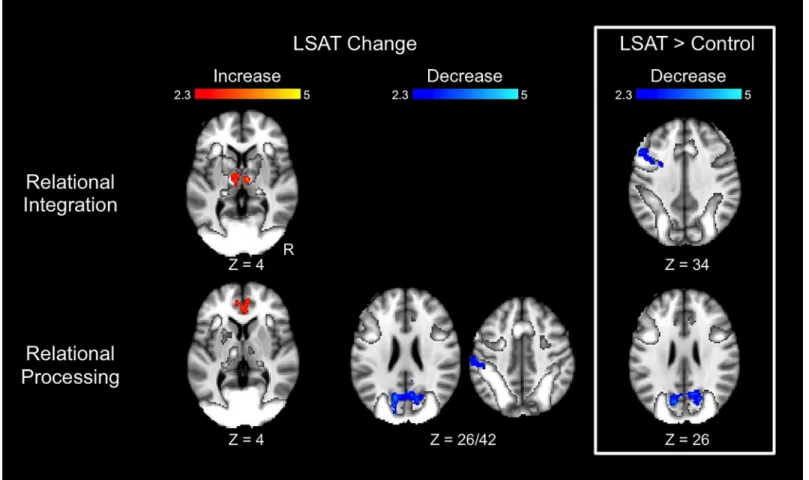
Transitive Inference results are shown inFig 4and Tables2–3. In the Relational Integration condition, the LSAT group exhibited increased activation from time 1 to time 2 in bilateral thalamus. The group × time ANOVA revealed a cluster in left middle frontal gyrus (DLPFC) that exhibited a significantly greater decrease in activation for the LSAT group than for the control group. This group difference was specific to the Relational Integration condition: parameter estimates for the Relational Processing condition extracted from this cluster did not show a change between time points (t(22) = .25, p = .8). In the Relational Processing condition, the LSAT group exhibited increased activation in anterior cingulate cortex, decreased activa-tion in left supramarginal gyrus, and decreased activaactiva-tion in precuneus from near zero to more negative values. The precuneus decrease for the LSAT group was also significant in the whole-brain group × time ANOVA. Parameter estimates for the Relational Integration condition extracted from this cluster show a slight change between time points (R precuneus:t(22) = 2.4, p = .02; L precuneus: t(22) = 2.6, p = .02). Whole-brain analyses for the control group revealed no significant changes for either condition of the Transitive Inference task.
Table 3shows results of follow-up analyses on parameter estimates extracted from clusters identified at the whole-brain level for the Transitive Inference task. First, for the follow-up tests of control group change within regions identified by change in the LSAT group, we observed the following: thalamus, which demonstrated increased activation for Relational Integration in the LSAT group, demonstrated a similar increase in the control group; in contrast, anterior cin-gulate and parietal regions that demonstrated changes in the LSAT group for Relational Pro-cessing did not demonstrate significant change in the control group. Second, for the follow-up tests on regions identified by the group x time ANOVA, we observed that the decreases for the
LSAT group relative to controls were driven both by decreases within the LSAT group and also by smaller increases within the control group. Further, ANCOVAs controlling for time 1 acti-vation revealed that these interactions were not driven by time 1 differences. Although these latter analyses are necessarily biased (i.e., thep-values are inflated), they serve to clarify the specificity of changes in the LSAT group and to exclude changes driven by the control group or by time 1 differences between groups.
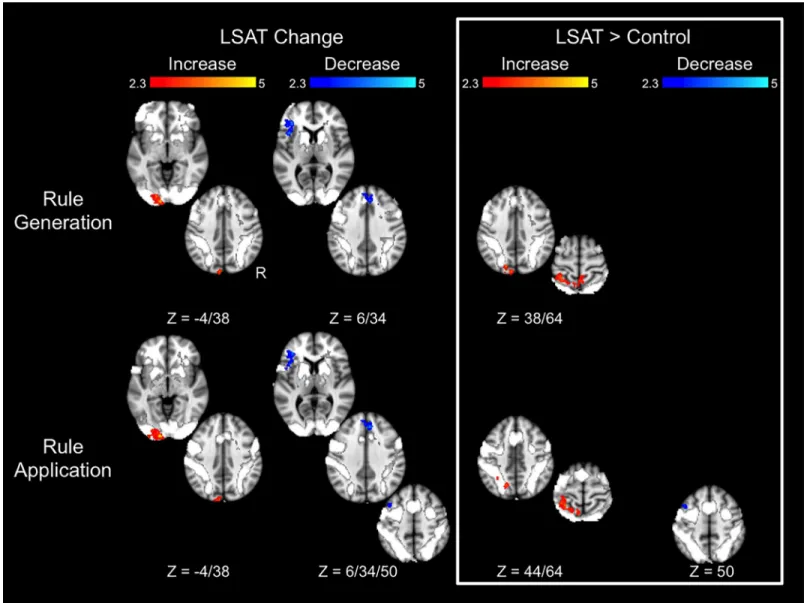
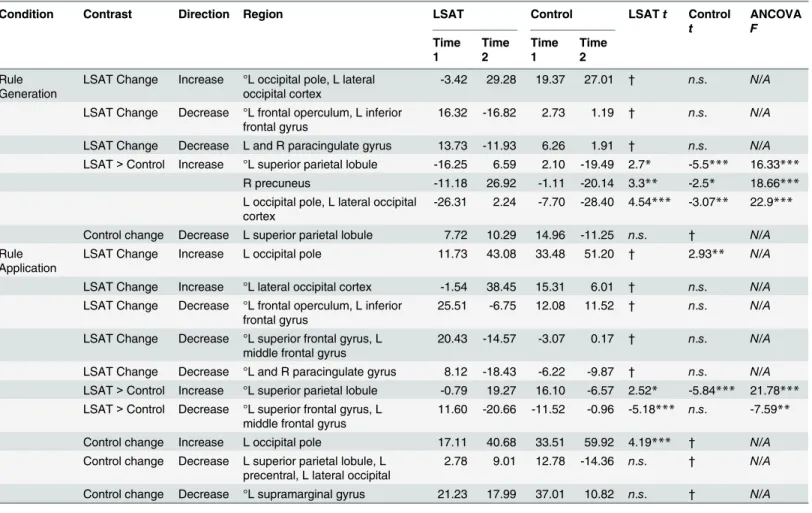
Letter Series results are shown inFig 5and Tables4–5. In the Rule Generation condition, the LSAT group showed increased activation in left occipital cortex. The superior aspect of this cluster was observed in the group × time ANOVA, as were regions in the left superior parietal lobule and right precuneus. The LSAT group also showed decreased activation in task-positive left inferior frontal gyrus (VLPFC) and dorsal medial prefrontal cortex. Changes in activation in the Rule Application condition appeared quite similar to those observed for Rule
Fig 3. Task activation. Activation is averaged across groups and times for the reasoning condition of each task compared to implicit baseline. Voxels that were significant only in the Transitive Inference task are shown in blue. Voxels that were significant only in the Letter Series task are shown in yellow. Overlap is shown in green. Statistical maps are corrected for multiple comparisons atZ > 2.3, p < .05. Results were registered to the fsaverage template in Freesurfer, and displayed on inflated surfaces.
Generation: the LSAT group showed an increase in left occipital activation and decreases in left inferior frontal gyrus and dorsal medial prefrontal cortex activation. Increased superior parietal activation was observed in the group × time ANOVAs of both conditions. A region within left lateral prefrontal cortex (superior frontal gyrus/middle frontal gyrus) showed a decrease both in the LSAT t-test and in the group × time ANOVA for the Rule Application condition. Activa-tion changes for the Rule GeneraActiva-tion condiActiva-tion extracted from the clusters identified from the
Fig 4. Changes in Transitive Inference task activation. Results are overlaid on the task activation observed across time points and across groups. Statistical maps show results of whole-brain analyses and are corrected for multiple comparisons atZ > 2.3, p < .05. Parameter estimates for these clusters are shown inTable 2.
doi:10.1371/journal.pone.0137627.g004
Table 2. Transitive Inference cluster locations.
Condition Contrast Direction Region Voxels Center of Gravity (MNI)
X Y Z
Relational Integration LSAT change Increase L and R thalamus 382 0 -14 5 LSAT> Control Decrease L middle frontal gyrus 290 -46 17 31 Relational Processing LSAT change Increase L and R anterior cingulate 297 1 44 0
LSAT change Decrease L and R precuneus, L and R cuneus 908 2 -65 19 LSAT change Decrease L supramarginal gyrus 253 -55 -25 43
LSAT> Control Decrease R precuneus 269 12 -66 28
L precuneus 246 -12 -70 23
Rule Application condition were significant (L SPL:t(14) = 2.7, p = .02; L MFG/SFG: t(14) = 3.7,p = .002), as were changes for the Rule Application condition in clusters identified from the Rule Generation condition (L SPL:t(14) = 2.2, p = .05; R precuneus: t(14) = 3.1, p = .009; L occipital pole/L LOC:t(14) = 4.77, p = .0003). Whole-brain analyses for the control group revealed a decrease in superior parietal lobule activation for both conditions, as well as a decrease in left supramarginal gyrus and increase in left occipital pole activation for the Rule Application condition.
Table 4shows results of follow-up analyses on parameter estimates extracted from clusters identified at the whole-brain level for the Letter Series task. First, among the regions that dem-onstrated change within the LSAT group, only left occipital pole demdem-onstrated corresponding changes in the control group. Second, in follow-up analyses of ROIs identified in the group x time ANOVA (all biased by ROI selection but nevertheless informative), the following ROIs met the criteria that they demonstrated significant increase within the LSAT group, were not primarily driven by changes in the control group (i.e., LSAT group changes were stronger than control group changes, if any), and the group x time interactions were significant after control-ling for time 1 values: right precuneus and left occipital cortex (Rule Generation) and left mid-dle/superior frontal gyrus (Rule Application). Left superior parietal lobule did not meet these criteria in either condition.
Results of Behavioral Assessments
Training did not transfer to measures of matrix reasoning (Cattell Culture Fair III), working memory (Reading Span, Digit Span, Spatial Span), or processing speed (Cross Out) (Table 1). The only test to show evidence of a practice effect was Reading Span. Both groups improved
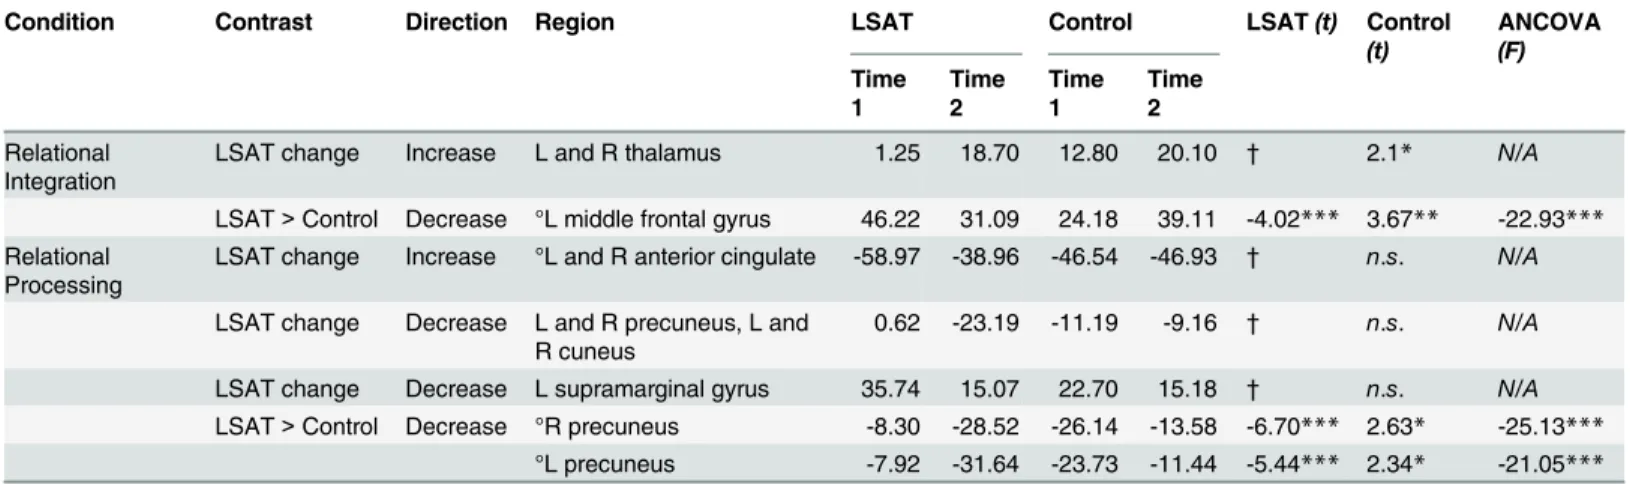
Table 3. Transitive Inference cluster statistics. ° clusters significantly differed between groups at time 1 (p < .05). LSAT t and Control t statistics resulted from paired t-tests comparing Time 1 to Time 2 for each group. ANCOVAF statistics show the impact of group on activation change controlling for activation at time 1.
Condition Contrast Direction Region LSAT Control LSAT(t) Control (t) ANCOVA (F) Time 1 Time 2 Time 1 Time 2 Relational Integration
LSAT change Increase L and R thalamus 1.25 18.70 12.80 20.10 † 2.1* N/A LSAT> Control Decrease °L middle frontal gyrus 46.22 31.09 24.18 39.11 -4.02*** 3.67** -22.93*** Relational
Processing
LSAT change Increase °L and R anterior cingulate -58.97 -38.96 -46.54 -46.93 † n.s. N/A LSAT change Decrease L and R precuneus, L and
R cuneus
0.62 -23.19 -11.19 -9.16 † n.s. N/A LSAT change Decrease L supramarginal gyrus 35.74 15.07 22.70 15.18 † n.s. N/A LSAT> Control Decrease °R precuneus -8.30 -28.52 -26.14 -13.58 -6.70*** 2.63* -25.13***
°L precuneus -7.92 -31.64 -23.73 -11.44 -5.44*** 2.34* -21.05*** * p < .05,
** p < .01, ***p < .001. n.s. = not significant,
†= result determined by ROI-defining contrast,
N/A = not applicable due to bias by ROI-defining contrast.
Note that all follow-up tests of the LSAT> Control ROIs are biased by the ROI-defining contrast, but nevertheless provide critical insight into the observed interactions.
from Time 1 to Time 2 (LSAT:t(24) = 2.2, p = .04; Control: t(23) = 1.6, p = .12), and the group × time ANOVA was not significant (p = .97). For the Cattell test, we found a significant order effect, i.e., the change between time points differed by version (t(48) = 2.71, p = .009). Participants who received version A at time 1 improved when they took version B at time 2 (mean gain 3.1 points,SD = 4.9), but participants who received version B at time 1 scored about the same when they took version A at time 2 (M = -.46, SD = 4.3).
Discussion
Reasoning instruction led to improvement on an unpracticed test of transitive inference. After three months of intensive practice with reasoning problems, participants demonstrated faster processing of individual relations and more accurate relational integration. Preparation for the LSAT consisted of reading multiple rules, and grouping or sequencing items according to the rules. In contrast, the transitive inference task involved making quick judgments about pictures
Fig 5. Changes in Letter Series task activation. Results are overlaid on the task activation observed across time points and across groups. Statistical maps show results of whole-brain analyses and are corrected for multiple comparisons atZ > 2.3, p < .05. Parameter estimates for these clusters are shown inTable 4.
of colored balls. Therefore, the task improvements we observed demonstrated a considerable degree of transfer. This finding is noteworthy, as transfer to unpracticed tests of reasoning has been notoriously difficult to observe, not only in cognitive neuroscience studies [17,20], but also in the classroom [39].
Reasoning instruction did not transfer to rule generation as measured by the Letter Series task. There are many possible reasons for this null result, including insufficient statistical power because this task was collected for fewer participants than the other task, and/or individ-ual differences in the propensity to persevere on challenging trials. Subjects knew that they could advance to the next trial as soon as they had responded, and differed in their compliance with the instruction to proceed only once they were certain of the correct answer. These indi-vidual differences, along with the small number of attempted trials, may have made this task insensitive to subtle behavioral gains. Alternatively, it may be that the Letter Series task is too far of a transfer task with respect to LSAT preparation. We conceptualize this task as involving relational integration as well as the ability to generate and evaluate possible rules. This latter ability, which involves inductive rather than deductive reasoning, was not practiced as part of the LSAT course. Therefore, although the LSAT course may have improved relational integra-tion, as suggested by the improvement on the Transitive Inference task, this boost may have not been large enough to also improve Letter Series performance, especially if the cognitive bot-tleneck is in the rule generation process.
Our approach to characterizing training-related changes in reasoning task activation was to identify regions that showed a group by time interaction, as well as regions that showed a change within the LSAT group. Group by time interaction analyses tend to identify regions that show a change in the opposite direction in the control group. Indeed, we see this pattern in the data presented here. It is possible that these regions randomly showed initial differences at time 1, and regression to the mean in each group. For this reason, it is important to determine whether changes are significant after controlling for parameter estimates at time 1. Follow-up
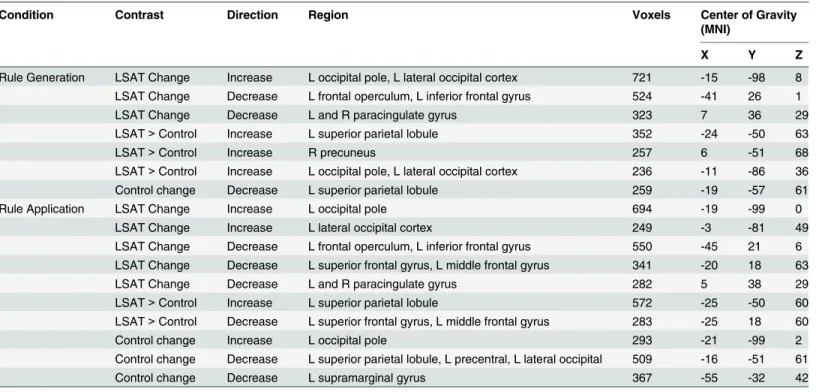
Table 4. Letter Series cluster locations.
Condition Contrast Direction Region Voxels Center of Gravity
(MNI)
X Y Z
Rule Generation LSAT Change Increase L occipital pole, L lateral occipital cortex 721 -15 -98 8 LSAT Change Decrease L frontal operculum, L inferior frontal gyrus 524 -41 26 1 LSAT Change Decrease L and R paracingulate gyrus 323 7 36 29 LSAT> Control Increase L superior parietal lobule 352 -24 -50 63
LSAT> Control Increase R precuneus 257 6 -51 68
LSAT> Control Increase L occipital pole, L lateral occipital cortex 236 -11 -86 36 Control change Decrease L superior parietal lobule 259 -19 -57 61 Rule Application LSAT Change Increase L occipital pole 694 -19 -99 0
LSAT Change Increase L lateral occipital cortex 249 -3 -81 49 LSAT Change Decrease L frontal operculum, L inferior frontal gyrus 550 -45 21 6 LSAT Change Decrease L superior frontal gyrus, L middle frontal gyrus 341 -20 18 63 LSAT Change Decrease L and R paracingulate gyrus 282 5 38 29 LSAT> Control Increase L superior parietal lobule 572 -25 -50 60 LSAT> Control Decrease L superior frontal gyrus, L middle frontal gyrus 283 -25 18 60
Control change Increase L occipital pole 293 -21 -99 2
Control change Decrease L superior parietal lobule, L precentral, L lateral occipital 509 -16 -51 61 Control change Decrease L supramarginal gyrus 367 -55 -32 42 doi:10.1371/journal.pone.0137627.t004
analyses on the parameter estimates extracted from whole-brain results are biased, but are meant to be exclusionary rather than confirmatory: clusters that did not meet the criteria out-lined above are unlikely to reflect true changes associated with reasoning instruction.
For the Transitive Inference task, reasoning instruction was associated with decreased DLPFC activation relative to the change in the control group during the reasoning condition of the task. Training-related decreases in DLPFC activation have been interpreted as evidence of greater neural efficiency, or less cognitive effort [40–43]. This interpretation has been criticized as simply a reinterpretation of the data rather than a mechanism [44], but fMRI methodology does not permit the exploration of cellular mechanisms. Reasoning instruction was also associ-ated with decreased precuneus activation during the control condition of the task. In contrast
Table 5. Letter Series cluster statistics. ° clusters significantly differed between groups at time 1 (p < .05). LSAT t and Control t statistics resulted from paired t-tests comparing Time 1 to Time 2 for each group. ANCOVAF statistics show the impact of group on activation change, controlling for activation at time 1.
Condition Contrast Direction Region LSAT Control LSATt Control t ANCOVA F Time 1 Time 2 Time 1 Time 2 Rule Generation
LSAT Change Increase °L occipital pole, L lateral occipital cortex
-3.42 29.28 19.37 27.01 † n.s. N/A LSAT Change Decrease °L frontal operculum, L inferior
frontal gyrus
16.32 -16.82 2.73 1.19 † n.s. N/A LSAT Change Decrease L and R paracingulate gyrus 13.73 -11.93 6.26 1.91 † n.s. N/A LSAT> Control Increase °L superior parietal lobule -16.25 6.59 2.10 -19.49 2.7* -5.5*** 16.33***
R precuneus -11.18 26.92 -1.11 -20.14 3.3** -2.5* 18.66*** L occipital pole, L lateral occipital
cortex
-26.31 2.24 -7.70 -28.40 4.54*** -3.07** 22.9*** Control change Decrease L superior parietal lobule 7.72 10.29 14.96 -11.25 n.s. † N/A Rule
Application
LSAT Change Increase L occipital pole 11.73 43.08 33.48 51.20 † 2.93** N/A LSAT Change Increase °L lateral occipital cortex -1.54 38.45 15.31 6.01 † n.s. N/A LSAT Change Decrease °L frontal operculum, L inferior
frontal gyrus
25.51 -6.75 12.08 11.52 † n.s. N/A LSAT Change Decrease °L superior frontal gyrus, L
middle frontal gyrus
20.43 -14.57 -3.07 0.17 † n.s. N/A LSAT Change Decrease °L and R paracingulate gyrus 8.12 -18.43 -6.22 -9.87 † n.s. N/A LSAT> Control Increase °L superior parietal lobule -0.79 19.27 16.10 -6.57 2.52* -5.84*** 21.78*** LSAT> Control Decrease °L superior frontal gyrus, L
middle frontal gyrus
11.60 -20.66 -11.52 -0.96 -5.18*** n.s. -7.59** Control change Increase L occipital pole 17.11 40.68 33.51 59.92 4.19*** † N/A Control change Decrease L superior parietal lobule, L
precentral, L lateral occipital
2.78 9.01 12.78 -14.36 n.s. † N/A Control change Decrease °L supramarginal gyrus 21.23 17.99 37.01 10.82 n.s. † N/A * p < .05,
** p < .01, ***p < .001. n.s. = not significant,
†= result determined by ROI-defining contrast,
N/A = not applicable due to bias by ROI-defining contrast.
Note that all follow-up tests of the LSAT> Control ROIs are biased by the ROI-defining contrast, but nevertheless provide critical insight into the observed interactions.
to the group difference in changes in task-positive DLPFC activation, a decrease in task-nega-tive precuneus activation in the trained group can be interpreted as a greater suppression of a node of the default mode network (DMN). DMN suppression during task performance has been associated with attention to the task [45], and better cognitive functioning more broadly [46]. Intriguingly, DMN activation has been shown to increase—or, rather, become less sup-pressed—as tasks become highly practiced and less effortful [47]. Observing the reverse pat-tern, as we did here, suggests that the reasoning task has not become rote (which stands to reason, because it was not explicitly practiced during LSAT preparation), but rather that instruction was associated with an improved ability to harness cognitive resources.
Reasoning instruction was associated with increased recruitment of occipital cortex for both conditions of the Letter Series task, possibly reflecting increased top-down control of visual attention [48,49]. Decreases in medial and lateral prefrontal regions were also observed, which, as described above, could reflect a reduction in the effort involved for attentional control to achieve the same level of behavioral performance. Indeed, given prior analyses of resting-state functional connectivity for this dataset, in which we found increases in temporal coupling among distant brain regions as a result of reasoning instruction [10], it is plausible that the increased occipital activation stems from increased functional connectivity with control-related regions. Alternatively, it is possible that reasoning instruction drove a shift in the balance between visuospatial and phonological processing strategies. In other words, participants may have used visual imagery rather than rehearsing the alphabet to detect patterns within letters sequences. Thispost hoc interpretation is based on the combination of observed increases in occipital regions and concomitant decrease in left inferior frontal gyrus (VLPFC) activation observed for the LSAT group. Although we did not observe significant behavioral benefits asso-ciated with these neural changes, it is possible that the behavioral data were not as sensitive as the neural data, or that a strategy shift did not translate to performance gains.
Across these two tasks, we observed preliminary evidence of three types of brain changes: 1) greater neural efficiency (decreased activation in task-positive regions in both tasks), 2) greater suppression of task-irrelevant networks (decreased activation in task-negative regions in the Transitive Inference task), and 3) a change in the cortical regions involved, perhaps due to a change in strategy in the Letter Series task. Future research with larger sample sizes and a larger range of tasks will be necessary to confirm these patterns and investigate the relationships between brain changes and behavioral improvements.
We found that reasoning instruction did not transfer to measures of either simple or com-plex working memory. Because the working memory demands of comcom-plex reasoning problems were intentionally minimized by the course instructors, it is not surprising that we did not observe working memory gains here (but note that we have previously found that practicing visuospatial reasoning games transfers to improved spatial working memory in children [1]). We also did not find transfer to our measures of processing speed or matrix reasoning. How-ever, the matrix reasoning results were inconclusive, given that the two versions of the Cattell Culture Fair task differed in difficulty. More generally, it is difficult to draw strong conclusions about transfer with only one test per cognitive ability [20,50]. Indeed, it is possible that transfer was broader than we could observe with our limited test battery. In this way, functional and structural brain imaging could provide clues as to which kinds of cognitive changes are neuro-biologically plausible, informing the selection of cognitive assessments for follow-up studies of cognitive transfer.
There are two important caveats regarding the results we have presented here. First, the intensity and unique characteristics of the reasoning training paradigm limited the choice of control groups, and therefore, for this first study, we opted for a passive control group with well-matched demographics. Including a passive control group was critical to rule out
explanations such as practice effects on the task, increased familiarity with the research envi-ronment (especially the MRI scanner), and developmental changes. To confirm that the observed effects were due specifically to reasoning instruction and not generally to participat-ing in an intensive course, it will be necessary to conduct additional research with an active control group. The use of an active control group would also alleviate the concern that the con-trols may have participated in other, undocumented, activities that drove changes in brain and behavior. To confirm that observed changes were not due to pre-existing differences between the groups, future work will need to involve random assignment to either the trained or the control group. The second caveat is that we present several behavioral and neuroimaging mea-sures, which presents a multiple comparisons problem. As such, the results should be treated as a complete, but preliminary, account of the data collected in this study. The purpose of this work is to inspire more specific predictions about the scope of neural and behavioral changes associated with real-world learning.
In conclusion, we showed that practice with reasoning problems led to improved perfor-mance on an unpracticed task of relational integration, and shifts in neural recruitment during reasoning tasks. We took the worthwhile and underutilized approach of including two func-tional tasks to examine the reach of learning. This study provides more evidence that the neural circuitry that supports reasoning is malleable in adulthood.
Supporting Information
S1 Table. Demographics for participants with behavioral data.Data are presented asM(SD). (PDF)
S2 Table. Demographics for participants with Transitive Inference neuroimaging data. Data are presented asM(SD).
(PDF)
S3 Table. Demographics for participants with Letter Series neuroimaging data.Data are presented asM(SD).
(PDF)
Acknowledgments
We thank Blueprint Test Preparation for assistance with recruitment. We also thank Chloe Green, Talia Seider, Brendan Berry, Joshua Hoerger, and Sarah Inkelis for help with behavioral assessments.
Author Contributions
Conceived and designed the experiments: APM SAB. Performed the experiments: APM ATMS. Analyzed the data: APM ATMS CW. Wrote the paper: APM ATMS CW SAB.
References
1. Mackey AP, Hill SS, Stone SI, Bunge SA. Differential effects of reasoning and speed training in chil-dren. Dev Sci. Blackwell Publishing Ltd; 2011; 14: 582–590. doi:10.1111/j.1467-7687.2010.01005.x
2. Bergman Nutley S, Söderqvist S, Bryde S, Thorell LB, Humphreys K, Klingberg T. Gains in fluid intelli-gence after training non-verbal reasoning in 4-year-old children: a controlled, randomized study. Dev Sci. Wiley-Blackwell Publishing Ltd.; 2011; 14: 591–601. doi:10.1111/j.1467-7687.2010.01022.x
3. Klauer KJ, Phye GD. Inductive Reasoning: A Training Approach. Rev Educ Res. 2008; 78: 85–123. doi:
10.3102/0034654307313402
5. De Koning E, Hamers J, Sijtsma K, Vermeer A. Teaching Inductive Reasoning in Primary Education. Dev Rev. 2002; 22: 211–241. doi:10.1006/drev.2002.0548
6. Kuhn D, Crowell A. Dialogic argumentation as a vehicle for developing young adolescents’ thinking. Psychol Sci. 2011; 22: 545–52. doi:10.1177/0956797611402512PMID:21422465
7. Halpern DF. Assessing the Effectiveness of Critical-Thinking Instruction. J Gen Educ. 1992; 42: 239– 54. Available:http://eric.ed.gov/?id=EJ476384
8. Rebok GW, Ball K, Guey LT, Jones RN, Kim H-Y, King JW, et al. Ten-Year Effects of the Advanced Cognitive Training for Independent and Vital Elderly Cognitive Training Trial on Cognition and Everyday Functioning in Older Adults. J Am Geriatr Soc. 2014; doi:10.1111/jgs.12607
9. Ferreira N, Owen A, Mohan A, Corbett A, Ballard C. Associations between cognitively stimulating lei-sure activities, cognitive function and age-related cognitive decline. Int J Geriatr Psychiatry. 2014; doi:
10.1002/gps.4155
10. Mackey AP, Miller Singley AT, Bunge SA. Intensive reasoning training alters patterns of brain connec-tivity at rest. J Neurosci. 2013; 33: 4796–803. doi:10.1523/JNEUROSCI.4141-12.2013PMID:
23486950
11. Mackey AP, Whitaker KJ, Bunge SA. Experience-dependent plasticity in white matter microstructure: reasoning training alters structural connectivity. Frontiers in Neuroanatomy. 2012. doi:10.3389/fnana. 2012.00032
12. Halford GS, Wilson WH, Phillips S. Processing capacity defined by relational complexity: implications for comparative, developmental, and cognitive psychology. Behav Brain Sci. 1998; 21: 803–864. Avail-able:http://www.ncbi.nlm.nih.gov/entrez/query.fcgi?cmd=Retrieve&db=PubMed&dopt=Citation&list_ uids=10191879PMID:10191879
13. Krawczyk DC. The cognition and neuroscience of relational reasoning. Brain Res. 2010/12/07 ed. 2010; doi:S0006-8993(10)02593-X [pii] doi:10.1016/j.brainres.2010.11.080
14. Prado J, Chadha A, Booth JR. The brain network for deductive reasoning: a quantitative meta-analysis of 28 neuroimaging studies. J Cogn Neurosci. 2011/05/17 ed. 2011; 23: 3483–3497. doi:10.1162/ jocn_a_00063PMID:21568632
15. Vendetti MS, Bunge SA. Evolutionary and developmental changes in the lateral frontoparietal network: a little goes a long way for higher-level cognition. Neuron. 2014; 84: 906–17. doi:10.1016/j.neuron. 2014.09.035PMID:25475185
16. Buschkuehl M, Jaeggi SM, Jonides J. Neuronal effects following working memory training. Dev Cogn Neurosci. Elsevier Ltd; 2012; 2 Suppl 1: S167–79. doi:10.1016/j.dcn.2011.10.001
17. Melby-Lervåg M, Hulme C. Is working memory training effective? A meta-analytic review. Dev Psychol. 2013; 49: 270–91. doi:10.1037/a0028228PMID:22612437
18. Hsu NS, Novick JM, Jaeggi SM. The development and malleability of executive control abilities. Front Behav Neurosci. Frontiers; 2014; 8: 221. doi:10.3389/fnbeh.2014.00221
19. Oei AC, Patterson MD. Are videogame training gains specific or general? Front Syst Neurosci. 2014; 8: 54. doi:10.3389/fnsys.2014.00054PMID:24782722
20. Shipstead Z, Redick TS, Engle RW. Is working memory training effective? Psychol Bull. 2012; 138: 628–54. doi:10.1037/a0027473PMID:22409508
21. Morrison AB, Chein JM. Does working memory training work? The promise and challenges of enhanc-ing cognition by trainenhanc-ing workenhanc-ing memory. Psychon Bull Rev. 2011; 18: 46–60. doi: 10.3758/s13423-010-0034-0PMID:21327348
22. Achenbach TM. Manual for the young adult self-report and young adult behavior checklist. Burlington, VT: University of Vermont, Department of Psychiatry; 1997.
23. Wechsler D. Wechsler Abbreviated Scale of Intelligence. San Antonio, TX: The Psychological Corpo-ration; 1999.
24. Cohen S, Kamarck T, Mermelstein R. A global measure of perceived stress. J Health Soc Behav. JSTOR; 1983; 24: 385–396. Available:http://www.ncbi.nlm.nih.gov/pubmed/6668417
25. Wendelken C, Bunge SA. Transitive inference: distinct contributions of rostrolateral prefrontal cortex and the hippocampus. J Cogn Neurosci. 2009/03/27 ed. 2010; 22: 837–847. doi:10.1162/jocn.2009. 21226PMID:19320546
26. Bishop SJ, Fossella J, Croucher CJ, Duncan J. COMT val158met genotype affects recruitment of neu-ral mechanisms supporting fluid intelligence. Cereb Cortex. 2008/02/07 ed. 2008; 18: 2132–2140. doi: bhm240 [pii] doi:10.1093/cercor/bhm240PMID:18252743
28. Unsworth N, Heitz RP, Schrock JC, Engle RW. An automated version of the operation span task. Behav Res Methods. 2006/01/13 ed. 2005; 37: 498–505. Available:http://www.ncbi.nlm.nih.gov/ entrez/query.fcgi?cmd=Retrieve&db=PubMed&dopt=Citation&list_uids=16405146PMID:16405146
29. Cattell RB, Cattell AKS. Culture Fair Intelligence Test Scale 3. Champaign, Illinois: Institute for Per-sonality & Ability Testing; 1959.
30. Woodcock RW, McGrew KS, Mather N. Woodcock-Johnson III Tests of Cognitive Abilities. In: Naglieri JA, Goldstein S, editors. Update. Riverside Publishing; 2001. pp. 371–401. Available:http://www. iapsych.com/articles/schrank2010ip.pdf
31. Jenkinson M, Bannister P, Brady M, Smith S. Improved optimization for the robust and accurate linear registration and motion correction of brain images. Neuroimage. 2002/10/16 ed. 2002; 17: 825–841. doi:S1053811902911328 [pii] PMID:12377157
32. Smith SM. Fast robust automated brain extraction. Hum Brain Mapp. 2002; 17: 143–55. doi:10.1002/ hbm.10062PMID:12391568
33. Greve DN, Fischl B. Accurate and robust brain image alignment using boundary-based registration. Neuroimage. 2009; 48: 63–72. doi:10.1016/j.neuroimage.2009.06.060PMID:19573611
34. Jenkinson M, Smith S. A global optimisation method for robust affine registration of brain images. Med Image Anal. 2001; 5: 143–156. PMID:11516708
35. Woolrich MW, Ripley BD, Brady M, Smith SM. Temporal autocorrelation in univariate linear modeling of FMRI data. Neuroimage. 2001; 14: 1370–86. Available:http://www.ncbi.nlm.nih.gov/htbin-post/Entrez/ query?db = m&form=6&dopt = r&uid=11707093PMID:11707093
36. Worsley KJ. Statistical analysis of activation images. In: Jezzard P, Matthews PM, Smith SM, editors. Functional MRI: an introduction to methods. New York: Oxford University; 2001. pp. 251–270. 37. Dale AM, Fischl B, Sereno MI. Cortical surface-based analysis. I. Segmentation and surface
recon-struction. Neuroimage. 1999; 9: 179–94. PMID:9931268
38. Fischl B, Sereno MI, Dale AM. Cortical based analysis. II: Inflation, flattening, and a surface-based coordinate system. Neuroimage. 1999; 9: 195–207. doi:10.1006/nimg.1998.0396PMID:
9931269
39. Novick LR. Analogical transfer, problem similarity, and expertise. J Exp Psychol Learn Mem Cogn. 1988; 14: 510–520. PMID:2969945
40. Kelly C, Foxe JJ, Garavan H. Patterns of normal human brain plasticity after practice and their implica-tions for neurorehabilitation. Arch Phys Med Rehabil. 2006; 87: S20–S29. PMID:17140876
41. Petersen SE, van Mier H, Fiez JA, Raichle ME. The effects of practice on the functional anatomy of task performance. Proc Natl Acad Sci U S A. 1998; 95: 853–860. PMID:9448251
42. Jansma JM, Ramsey NF, Slagter HA, Kahn RS. Functional anatomical correlates of controlled and automatic processing. J Cogn Neurosci. 2001; 13: 730–743. doi:10.1162/08989290152541403PMID:
11564318
43. Chein JM, Schneider W. Neuroimaging studies of practice-related change: fMRI and meta-analytic evi-dence of a domain-general control network for learning. Brain research. Cognitive brain research. 2005. doi:10.1016/j.cogbrainres.2005.08.013
44. Poldrack RA. Is“efficiency” a useful concept in cognitive neuroscience? Dev Cogn Neurosci. 2014; 11: 12–17. doi:10.1016/j.dcn.2014.06.001PMID:24981045
45. Weissman DH, Roberts KC, Visscher KM, Woldorff MG. The neural bases of momentary lapses in attention. Nat Neurosci. Nature Publishing Group; 2006; 9: 971–8.
46. Whitfield-Gabrieli S, Thermenos HW, Milanovic S, Tsuang MT, Faraone S V, McCarley RW, et al. Hyperactivity and hyperconnectivity of the default network in schizophrenia and in first-degree relatives of persons with schizophrenia. Proc Natl Acad Sci U S A. 2009; 106: 1279–84. doi:10.1073/pnas. 0809141106PMID:19164577
47. Mason MF, Norton MI, Van Horn JD, Wegner DM, Grafton ST, Macrae CN. Wandering minds: the default network and stimulus-independent thought. Science. 2007; 315: 393–5. doi:10.1126/science. 1131295PMID:17234951
48. Bi T, Fang F. Neural plasticity in high-level visual cortex underlying object perceptual learning. Front Biol (Beijing). 2013; 8: 434–443. doi:10.1007/s11515-013-1262-2
49. Byers A, Serences JT. Exploring the relationship between perceptual learning and top-down attentional control. Vision Res. 2012; 74: 30–39. doi:10.1016/j.visres.2012.07.008PMID:22850344
50. Schmiedek F, Lövdén M, Lindenberger U. Hundred Days of Cognitive Training Enhance Broad Cogni-tive Abilities in Adulthood: Findings from the COGITO Study. Front Aging Neurosci. 2010; 2. doi:10. 3389/fnagi.2010.00027