HAL Id: hal-01812613
https://hal.archives-ouvertes.fr/hal-01812613
Submitted on 11 Jun 2018
HAL is a multi-disciplinary open access
archive for the deposit and dissemination of
sci-entific research documents, whether they are
pub-lished or not. The documents may come from
teaching and research institutions in France or
abroad, or from public or private research centers.
L’archive ouverte pluridisciplinaire HAL, est
destinée au dépôt et à la diffusion de documents
scientifiques de niveau recherche, publiés ou non,
émanant des établissements d’enseignement et de
recherche français ou étrangers, des laboratoires
publics ou privés.
Mapping wave attenuation induced by salt marsh
vegetation using WorldView-3 satellite imagery
Antoine Collin, Natasha Lambert, Dorothée James, Samuel Etienne
To cite this version:
Antoine Collin, Natasha Lambert, Dorothée James, Samuel Etienne. Mapping wave attenuation
in-duced by salt marsh vegetation using WorldView-3 satellite imagery. Revista de Investigacion Marina,
Unidad de Investigación Marina de AZTI, 2018, 25 (2), pp.67-69. �hal-01812613�
UHINAK 2018 Extended abstract English
Mapping wave attenuation induced by salt marsh vegetation using
WorldView-3 satellite imagery
Collin, Antoine
1; Lambert, Natasha
1; James, Dorothée
1and Etienne, Samuel
11 EPHE-PSL Research University, CNRS LETG 6554, 15 boulevard de la mer, 35800 Dinard E-mail contact: [email protected]
Keywords: salt marsh, wave attenuation, vegetation mapping, hydrodynamics, WorldView-3
1. Introduction
Coastal marshes lie on the worldwide interface between land and sea realms, and are known to affect the local hydrodynamic regime (Koch et al., 2006). The specific vegetation communities increase wave resistance (drag coefficient) and reduce water levels during storm surges (e.g., Costanza et al., 2008; Das and Vincent, 2009; Krauss et al., 2009; Wamsley et al., 2010). Coastal vegetation has also been shown to efficiently dissipate wave energy in low-energy environments. Field studies that documented this dissipation were carried out in intertidal flats in England (Möller, 2006), mangroves in Asia (Horstman et al., 2014), salt marshes in the United States (Jadhav et al., 2013). Salt marshes therefore play an important role in reducing coastal risks, exacerbated by sea-level rise and human densification. Most studies punctually (0D) monitor wave height and compute the attenuation in significant wave height (Hs) along 1D cross-shore transect (e.g., Jeanson et al., 2016). Spatially-explicit models (2D) are strongly expected by
both scientists and stakeholders tasked with coastal adaptation. However the numerical modelling is restricted to a few specialists in computer programming. We propose here the first 2D modelling of the wave attenuation induced by salt marsh vegetation using in situ pressure measurements combined with very high resolution (VHR) multispectral satellite image (WorldView-3, WV-3). The methodology will describe the wave signal monitoring and processing, satellite imagery processing, and multiple regression modelling, developed to map the attenuation over an entire salt marsh.
2. Materials and methods
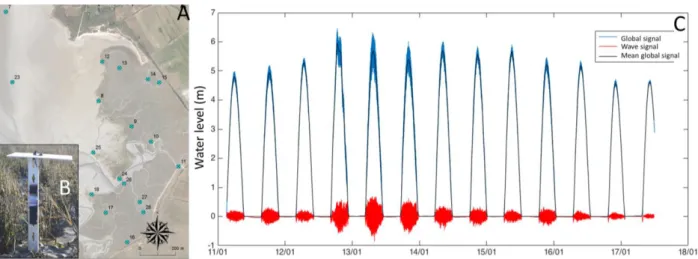
Lancieux Bay is located on the NW coast of France in the Gulf of Saint Malo (48°59’N, 2°18’W). The region is characterised by a temperate climate submitted to oceanic influences. Mean winds in the area come from the SW in winter and from the NW in summer. The N-S oriented bay (Fig. 1A) is subject to a megatidal range of up to 13 m. The hydrodynamic attenuation estimates of the salt marsh are derived from two wave measurement periods (February 9-17, April 26-May 2, 2017), allowing various meteorological configurations and incident wave conditions to be examined. Wave data are extracted from the water levels measured by 16 different NKE pressure gauges (Fig. 1B), deployed over four transects, throughout the salt marsh, parallel to the direction of wave propagation in the bay. The significant wave height (Hs=Hm0), used to calculate the wave attenuation, is obtained from a spectral analysis of the raw
sea level data measured by the pressure gauges, after removal of tide- and atmosphere-induced water level variations (Fig. 1C). The wave attenuation is then calculated as a ratio of Hs between two consecutive gauges along a transect, and
standardized to a constant distance (% of attenuation per 100 m).
Figure 1. (A) Location map of the 18 (B) pressure gauges, enabling the computation of (C) significant wave height (red line), retrieved from the mean (black line) raw signal (blue line) corrected for tide- and atmosphere-driven water level variations.
UHINAK 2018 Extended abstract English
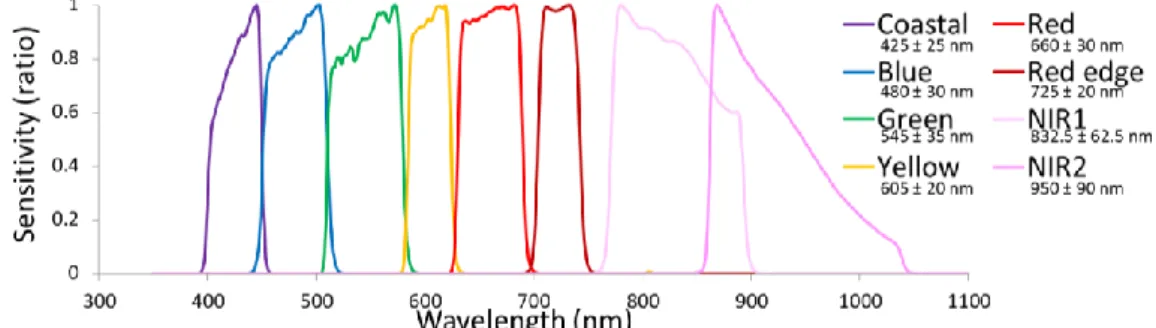
The WV-3 satellite imagery consists of the state-of-the-art multispectral sensor, given its five visible (coastal, blue, green, yellow, red) and three near-infrared bands (red-edge, near-infrared1 and near-infrared2) provided with 1.24 m spatial resolution (Fig. 2). The WV-3 panchromatic band at 0.31 m spatial resolution enables previous eight bands to be pansharpened (sensor sensitvity procedure with a cubic convolution resampling) at this latter VHR resolution.
Figure 2. Spectral sensitivity of the satellite WorldView-3 sensor showing its first eight multispectral bands provided with 1.24 m spatial resolution.
Spatially-explicit modelling of wave attenuation by salt marsh is derived from the multiple linear regression between the attenuation response (in %/100 m) and the best fitting WV-3 spectral predictors (average pixel values among eight spectral bands). The model is defined as follows:
y
i=
1
x
i1+
2
x
i2+
3
x
i3+
4
x
i4+…+
K
where yi is the i
th
wave attenuation value, xij the i
th
pixel averge value on the jth independent spectral predictor, and K the intercept. Models accuracy are quantified by Pearson’s correlation coefficient (r), coefficient of determination (R2), root means square error (RMSE) and p-value.
3. Results and discussion
The 2D model derived from the first measurement period distincts two areas of wave attenuation magnitude: lower and medium where the attenuation is low to mid, upper marsh characterised by a very strong attenuation. This model uses the WV-3 spectral bands green (518-586 nm), red (632-692 nm), red-edge (706-746 nm) and near-infrared2 (866-954 nm), showing goodness-of-fit indicators of: r = 0.84, R2 = 0.71, RMSE = 10.76% and p-value = 0.04 (Fig. 3A).
UHINAK 2018 Extended abstract English
The second measurement periods's 2D model is built on WV-3 red-edge (706-746 nm), near-infrared1 (772-890 nm) and near-infrared2 (866-954 nm): r = 0.87, R2 = 0.75, RMSE = 5.97% and p-value = 0.008 (Fig. 3B). Spatial patterns of the attenuation greatly echo those of the previous model.
The WV-3 spectral bands, selected for their explanatory power of attenuation, are green, red, red-edge, near-infrared1 and near-infrared2, what conspicuouly coincide with the electromagnetic radiation associated with vegetation provided with chlorophyll. The spectral signature of such vegetation is featured with a high reflectance (low absorbance) in green, red-edge and near-infrareds, as well as a low reflectance (high absorbance) in red (Gross, 1991). Vegetation signatures, remotely-sensed by WV-3, enable a satisfactory prediction of the wave attenuation in salt marsh. Low attenuation (5 to 10%/100 m), located in the lower marsh, could be attributed to inherent vegetation communities, namely Spartina anglica (cordgrass) and Salicornia europaea (glasswort). Medium attenuation (10 to 20%/100 m), visible between medium and upper marsh, is susceptible to correlate with Halimione portulacoides (sea purslane) and
Triglochin maritima (arrowgrass). High attenuation (> 20%/100m), elucidated in the upper marsh, is likely to match
with a synergistic assemblage of H. portulacoides, T. maritima, Puccinellia maritima (saltgrass) and Festuca rubra (red fescue). The biophysical structure of plant communities may clearly explain their various influence on wave attenuation. S. anglica and S. europaea, as pioneer species, provide a low hydrodynamic resistance given their flexible and small-sized structure, respectively (Neumeier and Ciavola, 2004). Contrarywise, above-ground biomass associated with H. portulacoides and T. maritima is stiff and dense enough to exert a significant drag on wave. Augmented by tall-sized P. maritima and F.rubra, the previous plant binome can accentuate their damping effect on wave.
4. Conclusions
The attenuation of significant wave height has been modelled in a spatially-explicit way at VHR (0.3 m) across an entire salt marsh (0.64 km2). The developed methodology relies on the processed significant wave height measurement response; WV-3 green, red, red-edge, near-infrareds predictors; and a multiple linear regression. Two measurement periods have confirmed the consistency of red-edge and near-infrared2 as robust predictors, despite various wave and wind conditions. Spatial patterns of both models reveal an increasing wave attenuation with salt marsh physiography, from lower to upper marsh. Based on salt marsh plant zonation, the structural complexity of the above-ground biomass is proposed to explain the spatial trend in wave attenuation: low attenuation (5-10%/100 m) by flexible cordgrass and small-sized glasswort; medium attenuation (10-20%/100 m) by dense sea purslane and tall-sized arrowgrass; and strong attenuation (> 20%/100 m) by an assemblage of sea purslane, arrowgrass, saltgrass and red fescue.
5. References
Costanza, R., Perez-Maqueo, O., Martinez, M.L., Sutton, P., Anderson, S.J. and Mulder, K. 2008. The value of coastal wetlands for hurricane protection. Ambio 37: 241-248.
Das, S. and Vincent, J.R. 2009. Mangroves protected villages and reduced death toll during Indian super cyclone. Proceedings of the National Academy of Sciences of the United States of America 106: 7357-7360.
Gross, J. 1991. Pigments in vegetables: Chlorophylls and carotenoids. New York, USA, Van Nostrand Reinhold. 351 p. Horstman, E.M., Dohmen-Janssen, C.M., van de Berg, N.J.F., Siemerink, M. and Hulscher, S.J.M.H. 2014. Wave
attenuation in mangroves: A quantitative approach to field observations. Coastal Engineering 94: 47-62.
Jadhav, R.S., Chen, Q. and Smith, J.M. 2013. Spectral distribution of wave energy dissipation by salt marsh vegetation. Coastal Engineering 77: 99-107.
Jeanson, M., Etienne, S. and Collin, A. 2016. Wave attenuation and Coastal Protection by Shelly Ridges: Mont-Saint-Michel Bay, France. Journal of Coastal Research 75(sp1): 398-402.
Koch, E.W., Sanford, L.P., Chen, S.N., Shafer, D.J. and Smith, J.M. 2006. Waves in Seagrass Systems: Review and Technical Recommendations. ERDC TR-06-15 U.S. Army, Engineer Research and Development Center, Vicksburg MS.
Krauss, K.W., Doyle, T.W., Doyle, T.J., Swarzenski, C.M., From, A.S., Day, R.H. and Conner, W.H. 2009. Water level observations in mangrove swamps during two hurricanes in Florida. Wetlands 29: 142-149.
Möller, I. 2006. Quantifying saltmarsh vegetation and it's effects on wave height dissipation: Results from a UK East coast saltmarsh. Estuarine, Coastal and Shelf Science 63: 489-496.
Neumeier, U. and Ciavola, P. 2004. Flow resistance and associated sedimentary processes in a Spartina maritima salt-marsh. Journal of Coastal Research 20(2): 435-447.
Wamsley, T.V., Cialone, M.A., Smith, J.M., Atkinson, J.H. and Rosati, J.D. 2010. The potential of wetlands in reducing storm surge. Ocean Engineering 37: 59-68.
Acknowledgements - This work is granted by the Conservatoire du Littoral et des Rivages Lacustres. All authors would
like to acknowledge the support DigitalGlobe Foundation for providing the WorldView-3 imagery.