DIVERSIFICATION STRATEGIES FOR CONSTRUCTION COMPANIES IN THE U.S.
by Chih-Che Tsai
Bachelor of Civil Engineering National Taiwan University, 1992
Submitted to the Department of
Civil and Environmental Engineering in partial fulfillment of the requirements for the Degree of
Master of Science
in Civil and Environmental Engineering at the
Massachusetts Institute of Technology May 1994
© 1994 Chih-Che Tsai All rights reserved
The author hereby grants to MIT permission to resproduce and to distribute publicly paper and electronic copies of this thesis
document in whole or in part.
Signature of Author
Department of Civil and Environmental Engineering May 7, 1994
Certified by
-Professor Fred Moavenzadeh Thesis Supervisor Director, Henry L. Pierce Laboratory George Macomber Professor of Construction Management
n
Accepted byProfessor Joseph M. Sussman on Graduate Studies I - % I
DIVERSIFICATION STRATEGIES FOR CONSTRUCTION COMPANIES IN TAIWAN AREA
by Chih-Che Tsai
Submitted to the Department of Civil and Environmental Engineering on May 7, 1994 in Partial Fulfillment of the Requirements for the Degree of Master of Science in Civil and Environmental Engineering
ABSTRACT
After a period of economic recession, in 1994 the U.S. construction industry will recover in a faster step than in 1993. However, how to select and invest from these various related construction industries is an important issue for managers.
A classification system is built according to Rumelt's (1986) original model. Because of the construction industry's distinct characteristics, new rules are devised. By using the fractions of their annual revenues from industries of different four-digit SIC codes, the sample of U.S. construction firms are classified into the groups of different diversification strategies.
The relationships between construction firms' financial performance/risk and their diversification strategies are explored in this research. The multiple regression model is adopted to build two equations. From the equations the factors that significantly affect a construction firm's performance are found, and some suggestions for the directions of investment are proposed.
Thesis Supervisor: Professor Fred Moavenzadeh
Director, Henry L. Pierce Laboratory
Acknowledgment
I would like to thank:
* Professor Fred Moavenzadeh and Mr. Charles H. Helliwell, Jr. for their advice and guidance, so that I could finish this thesis as planned.
* Professor Ming-Teh Wang for his recommendation.
* Professor Yun-Hung Peng and Mr. Wan-Kai Lee for their kind teaching and help in the whole process of research.
· My sister Tiryns for her encouragement and inspiration.
* Yu-Ting Kuo for his generous assistance in both academic or other fields.
* Jen-Chi Hsiao, Hwa-Ping Chang, and other friends in MIT, for their aids in living. * I-Ming Ryan Lee for his friendly E-mail messages that brought me so much
knowledge.
Finally, and the most important of all, I want to thank my parents for their everlasting love, support and care. They made all this come true.
TABLE OF CONTENTS
CHAPTER CHAPTER CHAPTER 1. 1.1 1.2 1.2.1 1.2.2 1.3 2 2.1 2.1.1 2.1.2 2.1.3 2.1.4 2.1.5 2.1.6 2.2 2.2.1 2.2.2 2.2.3 2.2.4 2.2.5 3 3.1 3.1.1 3.1.2 3.2 3.2.1 3.2.2 3.3 INTRODUCTION Overview... Research Goals and ScopeResearch Goals... Research Scope and Limitation...
Organization of Thesis...
BACKGROUND
The Environment of the U.S. Construction Industry...
Private Residential Construction... Prefabricated Buildings... Private Nonresidential Construction... Publicly Owned Construction...
International Engineering and Construction...
Construction Materials...
Corporate Diversification Strategies...
Direction of Diversification... ... Mode of Diversification... Diversity Status... The Connection of Diversification and Performance... Measure of Performance and Implementation of
Diversification Strategies...
DIVERSITY STATUS OF THE U.S. CONSTRUCTION FIRMS
Sample Selection
The Scope of SIC Codes... Procedure of Sampling...
Methodology - Classification System
Traditional Classification Approaches... Rumelt's Classification System... The Classification of Sample Firms...
8 13 14 14 20 21 22 22 26 28 28 31 33 34 35 36 37 39 40 43 44 47
3.4 Results of Classification... CHAPTER CHAPTER APPENDIX 4 4.1 4.1.1 4.1.2 4.1.3 4.1.4 4.2 4.2.1 4.2.2 4.2.2.1 4.2.2.2 4.2.2.3 4.2.3 4.2.3.1 4.2.3.2 4.3 4.3.1 4.3.2 4.3.3. 5 5.1 5.1.1 5.1.2 5.1.3 5.1.4 RESEARCH DESIGN M ethodology... Analysis of Variance... Pairwise Comparison... M ultiple Regression M odel...
Stepwise Procedure...
Multiple Regression
Analysis of Variance...
Hypotheses
The Risk Impacts on Diversification... Diversification Strategies and Firms' Return ... The Curvilinear Relationship between Risk and Return...
Design of Regression Model
Variable Selection and Data Collection... Model Specification...
Results of M ultiple Regression Analysis...
The Risk Equation... The ROA Equation... Residual Plots...
DISCUSSIONS AND CONCLUSIONS
Discussions and Conclusions...
Risk Equation... ROA Equation... Influence from the Nature of Construction Industry... Conclusions...
I Definitions of Rumelt's Categories... II Variable Definitions and Measurements...
BIBLIO G RA PH Y ... 55 55 56 57 59 61 64 66 68 69 69 76 77 78 81 82 83 84 87 89 91 93 100 51
LIST OF FIGURES
1.1 The Flow Chart of Research ... 16
1.2 The Conceptual Structure of Research ... 17
2.1 Value of New Construction Put in Place, 1990-98 ... 21
2.2 Annual Revenue of Construction Materials, 1991-94 ... 27
2.3 Research on Diversification Themes and Linkages ... 32
3.1 Assigning Diversification Categories ... 46
3.2 Product Flowof Centex Corp., 1993 ... 51
4.1 The Flow Chart of Stepwise Procedure ... 60
4.2 Residual Plot (Dependent Variable: Risk) ... ... 81
4.3 Residual Plot (Dependent Variable: ROA) ... 81
LIST OF TABLES
3.1 SIC Codes of Construction Industries and Number of Firms, 1994 ... 423.2 The Categories of Diversification Strategies of Rumelt's System ... 47
3.3 Distribution of Revenues, Centex Corp, 1993 ... 50
3.4 Diversification Status of U.S. Construction Industry, 1993 ... 52
3.5 The Ratios and Diversification Strategies of the Sample of Construction Firms ... 53
4.1 Analysis of Variance: ROA (Return on Assets) ... 62
4.2 Analysis of Variance: Risk ... 62
4.3 Results of Tukey's HSD test: ROA (Return on Assets) ... 63
4.4 Results of Tukey's HSD test: Risk ... 63
4.5 Variables for the Stepwise Procedure of Regression Analysis ... 70
4.6 The Variables of Multiple Regression Models ... 73
4.7 The Characteristics of the Coefficients of the Risk Equation ... 74
4.8 The Characteristics of the Coefficients of the ROA Equation ... 75
To My Parents
CHAPTER 1
INTRODUCTION
1.1 OVERVIEW
In 1993, the value of new construction put in place was equal to about 7.9 percent of
gross domestic product (GDP). This is well below the post-World War II peak of 11.9
percent of GDP attained in 1966, and very close to the cyclical low of 7.7 percent in 1982.
Construction's share of GDP is expected to remain constant in 1994.
In 1994, the constant-dollar value of new construction put in place will increase about
2 percent, while repair and remodeling work will grow at a faster pace. The homebuilding
sector will continue its modest recovery, but commercial construction will decline again. Public works construction will be about the same level as in 1993. In the international construction and engineering arena, near-term opportunities for U.S. companies could be
limited in the industrial economies due to slow growth there, but virtually unlimited
infrastructure needs exist in developing countries.
According to National Trade Data Bank, the inflation-adjusted value of new
construction put in place increased about 3 percent in 1993. The 1993 value of about $460
billion was an all-time high in current dollars. The number of housing starts increased by about 4 percent to 1.25 million units in 1993. An additional 265,000 manufactured
(mobile) homes were shipped, a 26 percent increase. Public works construction increased
slightly, led by strong spending for highways. The decline in private nonresidential
construction was largely attributable to high vacancy rates in commercial buildings. Some categories of private nonresidential construction, such as hospitals and electric utilities, were growing markets in 1994.
The following broad economic factors will affect construction demand in 1994: economic growth is expected to be relatively modest;
(1) interest rates are likely to remain near current levels;
(2) real estate finance will continue to be characterized by weak asset prices and lender
wariness of commercial property;
(3) plant and equipment expenditures are expected to increase slightly, but investment in buildings will be weaker than investment in equipment;
(4) vacancy rates for apartments and commercial buildings will remain high, depressing prices and the demand for new construction;
(6) demographic factors are favorable for the construction of schools and hospitals but
unpromising for apartments and offices.
During the 1994-98 period, new construction is expected to increase modestly from
current levels, but with a slower growth rate than GDP. In addition to market factors, the
U.S. construction industry will face a number of supply-side challenges during the next 5
years, including foreign competition, the availability of workers, and the cost of insurance.
Remodeling and repair work increased faster than new construction in 1993 and that
year probably was a record year for maintenance and repair work. On the other hand,
nonresidential building improvements (commercial remodeling and renovation) declined slightly from the record levels set in 1992.
The construction business has become increasingly international during the past 20 years. Although only a small number of U.S. construction contractors are active
internationally, they are among the most successful in the world. In 1992, U.S. contractors
won about 49 percent of all international construction contracts, according to the
Engineering News-Record. At the same time, many of the world's largest foreign
construction contractors entered the U.S. construction market, but they have not made
significant inroads here, except in a few specialized sub-markets. Foreign-owned
companies accounted for only about 4 percent of all construction contracts awarded in the
United States during 1992.
Exports of prefabricated buildings have increased impressively over the past 5 years,
with 1993 exports of $285 million. This success is partly due to the cheaper dollar and more commercially oriented foreign aid programs. In addition, U.S. industry has become
aware that there are viable but specialized foreign markets for prefabricated buildings, and
firms are stepping up their foreign marketing efforts.
The total value of new construction will increase about 2 percent in constant dollars,
while repair and remodeling work will grow at a slightly faster pace. The most promising markets appear to be home improvement, hospitals, telecommunications, highways, and water supply. The weaker construction markets are expected to be office buildings, hotels,
public service buildings, military facilities, and Federal industrial plants.
Housing starts will be about 1.3 million units in 1994, about 4 percent more than in 1993. Private nonresidential construction will decline slightly, as weakness in commercial building markets will more than offset strength in hospital and utility construction. Public
works construction will be about the same as in 1993, as a modest rise in Federal spending is offset by construction cost increases and by declining state and local construction
expenditures.
During the 1994-98 period, new construction is expected to increase modestly from
current levels, but with a slower growth rate than GDP. Remodeling and repair
construction will increase substantially if interest rates remain moderate, with about the
same growth rate as the overall economy.
The modest increase in new construction activities is partly due to the oversupply of
commercial buildings, which will be gradually absorbed by attrition and a growing
economy. The demand for new housing construction will be limited by demographic
spending for public works, despite the well-publicized need for additional infrastructure
investment.
The recovery of the U.S. manufacturing sector is expected to result in strong demand
for industrial construction during the rest of this decade. Electric utility construction also
will be a large and growing market. Hospital construction will continue to gain but will be influenced by the Federal health care initiative. Remodeling and repair work, both
residential and nonresidential, is expected to remain a growth area, as the U.S. stock of structures becomes older and more extensive.
The commercial real estate slump is likely to persist through the middle of the decade. As measured by the value of new construction put in place, the sector will decline in 1994,
but the bottom may be reached by 1995. Even so, the recovery is likely to be slow, and
commercial construction will not even reach current levels by 1998. The downturn is
augmented by the failure of record numbers of financial institutions. High vacancy rates
and weak building prices have made new construction unprofitable in most cases, and reluctance to make real estate loans has further limited opportunities.
After a period of economic recession, in the near future there seems filled with
opportunities in some of the construction industries, no matter in the domestic or
international market, while the rest will be still weak. Therefore, to adjust itself in the
industries and face the challenges, a U.S. construction firm has to carefully evaluate and analyze possible risks, choose a better way to invest and change its direction of corporate strategies: to diversify present businesses into more profitable industries, or stay at where
1.2 RESEARCH GOALS AND SCOPE
1.2.1 Research Goals
The goals of this research are:
(1) By using Rumelt's (1982) methodology to set up a rule of classifying construction
firms into different categories of diversification strategies and examine it with a sample of U.S. construction firms.
(2) Explore the relationships between diversification strategies and financial
performance/risk of the sample U.S. construction companies.
(3) Analyze the diversification strategies with which the U.S. construction companies
operate their businesses.
(4) Find the evaluation factors with which the U.S. construction companies make
investments and suggest a more profitable investment portfolio .
After the case examinations of the basic assumptions, the final results of this research
will include:
(1) A classification method with which the U.S. construction firms are to be classified into different categories of diversification strategies.
(2) The results of classification of the sample U.S. construction firms.
(3) The present information of corporate diversification strategies in the U.S.
construction industry.
(4) Two multiple regression models with the dependent variables ROA and Risk, respectively; the models are used to examine the factors which would influence the
financial performance of the U.S. construction firms adopting different
diversification strategies.
(5) Conclusion and discussion of the multiple regression models, and suggestion of the
future direction of research.
1.2.2 Research Scope and Limitation
This research focuses on the U.S. construction industry, and all the data collected are
within the period 1989-1992. The sample of U.S. construction firms for classification were
randomly chosen, including public companies, private companies, and subsidiaries. However, at the second part of research, the multiple regression analysis, because all
variables are from balance sheets, income statements, and other financial reports, there would be possible selection bias if the data are from different sources. Therefore, the
author uses Moody's Manual, a reference which stores all the American public firms' financial data, as the uniform source of data to avoid the bias.
1.3 ORGANIZATION OF RESEARCH
The organization of the research can be divided into three parts: (1) The process of producing the thesis:
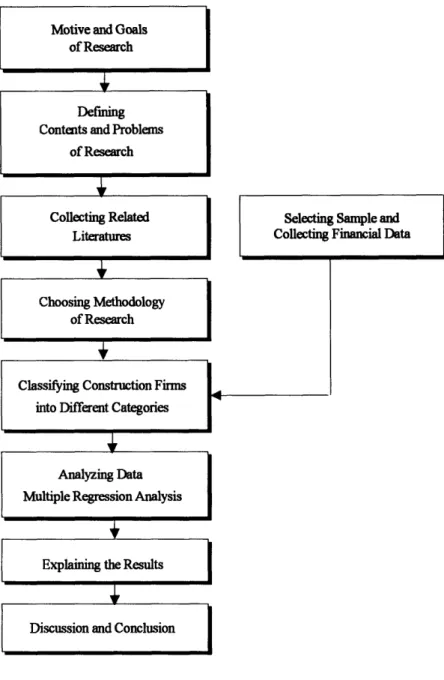
Fig 1.1 describes the flow chart of each phases of this research.
The conceptual structure basically follows that of Alfred D. Chandler, Jr. (1966).
He proposed the concept of "environment - strategy
changes-organization changes", that is, the chain reaction in which once the external
environment changes, the strategy must react to these changes, and the
organization also has to be modified to react the change of the strategy. In this
research, the author would like to introduce financial performance and risk into
this structure in order to explore their effects on the business.
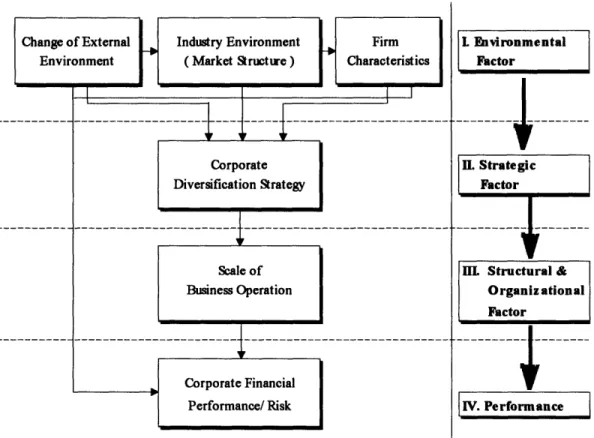
From Fig. 1.2, we can infer that the environment and the characteristics
(environmental factors) would affect the direction and the mode (strategic factors)
which the firms adopt while in growth. In addition, they can influence the
consideration of the scale of economies (structural and organizational factor) when
Motive and Goals of Research
Defining Contents and Problems
of Research
Collecting Related Literatures
Choosing Methodology of Research
Classifying Construction Firms into Different Categories
.4
Explaining the Results
Discussion and Conclusion
I
Selecting Sample and Collecting Financial Data
Fig 1.1 The Flow Chart of Research
Besides, these three factors (environmental, strategic, and structural and
organizational) would affect the financial performance through the
management, the capital structure, and other factors. The strategy that the author
Analyzing Data Multiple Regression Analysis
I m l l W l
Change of External Environment Industry Environment ( Market Structue ) Scale of I I Firm Characteristics I TI I Corporate Financial Performance/ Risk
Fig. 1.2 The Conceptual Structure of Research
LEnvironmental
Factor
. Strategic Factor
IIL Structural &
Organiz ational Factor
IV. Performance
I I.oerfrmnce I
used in the research is defined as the corporate diversification as defined by Rumelt (1974).
(3) The structure of the thesis:
CHAPTER 1- INTRODUCTION
This chapter describes the research goals and scope, and organization of the
research. Corporate Diversification Strategy I | I -. | | I ~ ~ ~ ~ ~ -- -- - -;
--
----CHAPTER 2 - BACKGROUND
This chapter includes two parts:
1. Examine the environment of the construction industry in the U.S.,
and define the existing problems.
2. Review the historical strategic management articles which discuss
diversification strategies and describe the results of those studies of
corporate diversification.
CHAPTER 3 - DIVERSITY STATUS OF THE U.S. CONSTRUCTION
FIRMS
This chapter introduces Rumelt's (1982) methodology of the diversification
strategy and how it is employed in the research. This chapter also describes a model developed a model to measure the four ratios: SR, VR, RR, and CR, for the classifications of businesses; and describes the procedure of sampling and
classifying the construction firms into different categories of diversification
strategies.
CHAPTER 4 - RESEARCH DESIGN
This chapter describes the analytical tools including ANOVA (analysis of
variance), pairwise comparison, and multiple regression analysis. ANOVA and hypotheses are first introduced. Later in this chapter the results of classification
period 1989-1992. Based on these, two multiple regression models are built. In
these models the significant factors which have effects on the ROA and Risk of
those firms with different diversification strategies are found.
CHAPTER 5 - DISCUSSIONS AND CONCLUSIONS
This chapter discusses the results from the analysis conducted in this research
and draws conclusions. The limitations of the research are also described.
Some suggestions for the U.S. construction firms and the future direction of
CHAPTER 2
BACKGROUND
2.1 THE ENVIRONMENT OF CONSTRUCTION INDUSTRY
IN THE U.S.In chapter 2.1, the environment of the U.S. construction industry is explored from
different related fields: (1) private residential construction (including single-unit, multiunit, and manufactured housing), (2) prefabricated buildings, (3) private nonresidential
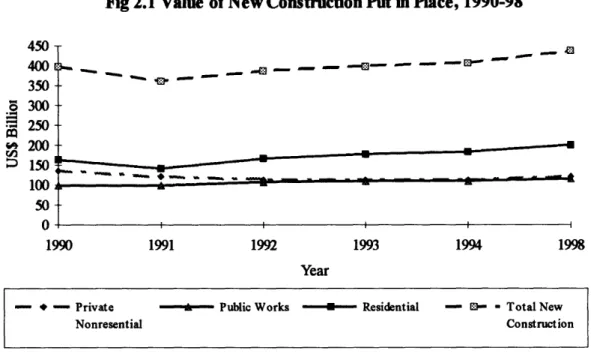
construction, (4) publicly owned construction, (5) international construction and engineering, and (6) construction materials. The trend of new construction of whole
Fig 2.1 Value of New Construction Put in Place, 1990-98 450
400_
,--
--
d
350 o 300 .250 200 150 100 50 0 I I I 1990 1991 1992 1993 1994 1998 Year|-- +-Private - Public Works - Residential - S- Total New
Nonresential Construction
industry is shown in Figure 2.1; the source of data is U.S. Department of Commerce:
Bureau of Census; International Trade Administration (ITA)..
2.1.1 Private Residential Construction
Housing recorded the strongest growth among the construction sectors in 1993. The
current-dollar value of new residential construction amounted to $205 billion. After
adjusting for inflation, this was a 6.5 percent rise over 1992, and the second year of
recovery from the 1991 recession.
New housing starts in 1994 would be the second consecutive annual gain of 4 percent.
prospects, new residential construction will grow slowly, probably less than the overall
economy.
2.1.2 Prefabricated Buildings
Prefabricated buildings are structures that are built using various forms of
factory-produced items, which range from simple components (such as roof trusses, wall panels,
and pre-hung doors and windows) to three-dimensional, 95 percent-complete modular
units. Buildings are manufactured from wood (SIC 2452) or metal (SIC 3448) and can be
designed for residential or commercial applications.
The continuing weak domestic market for U.S. building construction during 1992
increased U.S. companies' emphasis on strong export markets to offset declining domestic
sales. Total industry shipments (domestic and export) declined in both current and
constant dollars in 1992.
2.1.3 Private Nonresidential Construction
In 1993, the value of new private nonresidential construction was about 1 percent less
in constant dollars than in 1992. The declines of 1993 were most severe for office buildings and hotels, while the construction of hospitals and electric utility plants
registered solid increases.
The weakness in nonresidential construction reflects the aftermath of the phenomenal
combined with the slowdown in economic growth, have resulted in record vacancy rates
for office buildings, stores, hotels, and warehouses.
New private nonresidential construction will decline by about 1 percent, despite the
expected modest growth in GDP and total business investment. All of the net increase in
business plant and equipment expenditures will be in capital equipment, rather than in buildings and other structures.
The most construction growth in 1994 is expected to be in hospitals and other health
institutions, electric power utilities, and telecommunications. They will continue to do well through the mid-1990's. The largest declines in 1994 will be in commercial construction,
especially office buildings and hotels, where capacity surpluses are greatest.
The nonresidential repair and renovation markets probably will continue to grow in
1994. Electric utilities in particular are likely to increase their maintenance and repair expenditures substantially. The rapid growth rates of this type of construction probably
will continue over for the next several years.
Growth in total private nonresidential construction is likely to lag increases in the overall economy over the next 5 years, given high vacancy rates for commercial buildings, continued liquidation of failing thrift institutions, and relatively modest growth in GDP.
However, the decline will be entirely in commercial construction. Industrial, utility, and hospital construction probably will increase from 1993 to 1998.
Manufacturing Facilities
The real value of industrial construction put in place decreased in 1993, but the decline is expected to end in 1994 as the economy recovers. The long-term rate of increase may
be lower than in previous recoveries because of modest corporate profits and slower
economic growth. Although the long-term outlook for industrial construction is subject to
many uncertainties, it is likely to be one of the stronger construction markets during the
next 5 years. The general economic climate should be moderately favorable for industrial construction. However, negative factors include continued uncertainty about the economy,
regulatory burdens, and heavy debts of many companies.
Office Buildings
Office construction in 1993 was 35 percent below its 1985 record. Office vacancy rates have remained high, and building prices have fallen. Further declines are expected in
1994 and for several years thereafter because of high vacancy rates, slower growth in
white-collar employment, and poor financial conditions in the real estate industry.
Nevertheless, a sizable amount of office construction will continue because of strength in a
small number of cities and market niches. Hotels and Other Commercial Buildings
The "other commercial buildings" category consists of all commercial buildings, except office buildings and hotels, and includes warehouses, grain elevators, shopping centers, parking garages, banks, fast-food restaurants, and gasoline stations. According to
economic and demographic forecasts for the next 5 years, there will be further increases in
Construction of hotels and motels declined sharply in 1993, reflecting the end of an international hotel building boom. A further decline is likely in 1994 to bring capacity more in line with market demand. Fortunately, the underlying demand for hotel lodging is
expected to grow steadily in the long term and eventually will stop the decline in hotel
construction.
Private Electric Utilities
Electric utility construction increased slightly in 1993, continuing a recovery that should last through the first half of the 1990's. This construction includes new power
plants, transmission lines, pollution control facilities, conversion of existing power plants
from oil and gas to coal, and modernization of existing power plants and other buildings.
Hospital and Institutional
This category includes hospitals, outpatient clinics, nursing homes, convalescent
homes, orphanages, and similar institutions for prolonged care. Construction of health care
facilities increased by 5 percent in 1993, and a similar gain is expected in 1994. During 1994-98, this construction probably will be one of the fastest-growing markets.
Construction of nursing homes, which service the most rapidly growing segment of the
population, is likely to increase even faster than overall health care construction. Between 1980 and 1990, the nation's nursing home population grew by 24 percent, and
2.1.4 Publicly Owned Construction
The value of publicly owned construction put in place increased about 3 percent in
constant dollars in 1993, primarily because of gains in highways, water works, conservation and development, and Federal industrial facilities.
Public works construction has increased substantially over the last decade, although it
is still below (in constant dollars) the record level reached in 1968. The vast U.S. highway network helps U.S. industrial productivity by allowing faster and cheaper transportation of
products. Other types of infrastructure, such as airports, schools, waterworks, prisons,
and mass transit also contribute to productivity.
Public works construction will increase modestly during the 1994-98 period, assuming moderate economic growth and fairly stable interest rates. As in the private sector,
maintenance and repair spending probably will increase faster than new public construction spending because the public works infrastructure is steadily becoming older and larger.
Transportation Infrastructure
New road and bridge construction increased 5 percent in 1993, and probably will be up again in 1994. Expenditures for highway maintenance and repair also have risen, partly at the expense of new construction. This trend is likely to continue through the
mid-1990's.
In the longer term, highway construction expenditures probably will increase further to
Water and Sewer Systems
Water and sewer construction increased in 1993, and should increase again in 1994. Demand for water and sewer construction is being sustained by the recovery in
homebuilding, which requires expansion of feeder/connector systems and treatment plants.
Sewerage construction is likely to continue to gain after 1994, although at a slower rate
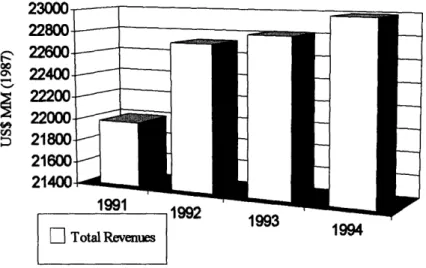
Fig 2.2 Annual Revenues of Construction Materials, 1991-94
00oo
vi
' °°".0 1994
F- Total Revenues
than the overall economy. The relatively modest but sustained recovery in homebuilding
also will support sewerage construction.
In the longer term, waterworks probably will be one of the more rapidly growing
categories of public construction because of ancient aqueduct systems in most older cities.
Educational Buildings
New construction expenditures for schools, libraries, and museums decreased slightly
2.1.5 International Engineering and Construction
In 1992, U.S. engineers and constructors positioned themselves for and profited from
significant new opportunities in world markets. According to the Engineering
News-Record (ENR), U.S. companies have dramatically increased their business and maintained their preeminent position in the global international engineering and construction market. Forty percent of the 200 top international design firms were from the United States. U.S.
companies obtained 51 percent of total international billings of $12 billion in 1992. Designers increased their foreign billings by about 43 percent over 1991, to $6.6 billion.
U.S. firms will have to reassess carefully their marketing strategies in 1994. The global environment will continue to present unusual opportunities for U. S companies. During at
least two decades of domestic environment cleanup activity, U.S. firms have acquired a
unique expertise in lessening or preventing air, water, and soil pollution. In the foreseeable future, U.S. engineers, contractors, and equipment suppliers will find lucrative
environmental management markets overseas.
The cleanup of the world's environment will be one of the more significant global
issues of the 1990's. Environmental projects will provide significant overseas opportunities
for U.S. firms. Some environmental problems can be solved on a global basis and in partnership with governments and companies in both developed and developing countries.
2.1.6 Construction Materials
Shipments for eight of the nine industries related to construction materials should
construction materials rose modestly in 1993, reflecting the 3 percent rise in
constant-dollar construction put-in-place. This was the second consecutive small increase in
construction work since the 1990-91 recession. The trends and forecast of construction
materials is shown in Fig 2.2; the source of data is U.S. Department of Commerce: Bureau
of Census; International Trade Administration (ITA).
The long-term increase in the size and features of new single-family houses have
tended to increase demand for construction materials. Construction work on existing
structures continues to be an excellent market for construction materials.
Demand for construction materials should increase modestly for the third straight year.
In 1994, the United States should continue to show a modest trade surplus in construction
materials, although the surplus is likely to be less than the $45 million expected in 1993. Both exports and imports should increase, but imports may rise at a faster pace.
Longer-term demand for construction materials will continue to reflect the pace of the economic
recovery.
Fabricated Structural Metal
The output of the fabricated structural metal industry continues to decline, with
shipments in 1992-93 below the 1989 level. As a result of favorable foreign exchange
rates, U.S. exports of fabricated structural metal have been at a high level in the last
several years. Reflecting these substantial declines in almost all of the major markets, shipments of fabricated structural metal will drop by about 2 percent. However, by 1996 and 1997, all of these markets may improve. If so, shipments of fabricated structural metal
will increase again. Exports of fabricated structural metal will continue at historically high levels.
Cement
Demand for hydraulic cement (SIC 3241) rose modestly in 1993, following a stronger increase in 1992. Cement consumption in 1994 will increase about 2 percent.
Based on construction forecasts, the recovery in cement demand will likely be slow.
Domestic consumption should rise at a 3 percent rate annually through 1999. Flat Glass
The flat glass industry is made up of companies that make "float glass" (unfabricated
flat glass), and various products made from it, including window glass, cathedral glass, picture glass, laminated glass, motor vehicle windshields and windows, skylight glass, and tempered glass. Overall, the industry (including fabricators of float glass) has not displayed dynamic growth, but float glass production continues to increase.
Ceramic Tile
Following declines during the 1990-91 recession, the ceramic wall and floor tile industry (SIC 3253) experienced an upsurge in shipments in 1992 and 1993. In 1994, ceramic tile consumption should rise 3 to 4 percent, to 1.2 billion square feet.
Plumbing Products
Industry shipments of plumbing fixtures and fittings rose almost 4 percent in 1993, to nearly $5.5 billion. Plumbing fixtures are classified into three industries according to the
materials from which they are made: vitreous (SIC 3261), metal (SIC 3431), and plastic (SIC 3088). Metal fittings used with fixtures, such as faucets, shower heads, and drains,
constitute SIC 3432. Total exports continued to grow in 1993. Higher domestic demand
will also increase imports again in 1994.
2.2 CORPORATE DIVERSIFICATION STRATEGIES
Studies of diversification have long been a branch of strategic management (SM)
research. Along with those concepts as synergy, distinctive competence, and generic
strategies, the notions of diversification and diversity occupy a central place in the
language and literature of the SM field.
Since Rumelt's (1974) study, a number of articles have been made to replicate, refine, and explain his diversification framework and findings. However, the study by Bettis and Hall (1982) is the first one that explored successfully the linkage between risk and return performance and diversification strategy.
As a topic of research, diversification has a rich tradition. In 1957, Ansoff first discussed diversification strategies in his research article 'Strategies for Diversification.' Then, five years later, in 1962, Chandler and Gort suggested seminal works in this research area. The topic has been examined by business historians, economists, and researchers in the areas of finance, law, and marketing.
In his Diversification and Integration in American Industry,' Gort (1962) defined diversification with the concept of "heterogeneity of output" based on the number of
markets served by that output. To Berry (1975) diversification represents an increase in the number of industries in which firms are active. Pitts and Hopkins (1982) use the word
"business" rather than "industry," defining diversification as the extent to which firms
operate in different business simultaneously. Ansoffs (1957, 1965) notion of
-Finrm Characteristics
3
Management
Choices of Choices of Management Mtnagement of Synergy ions I D w orectn MO&Diversity ofDiversity ofDiversity -R&D
of of Status -Structure -Systems -Mktg.
sify Diversification Diversification -Fn.
41
1IS
ll'
,
1
T
J51
9
10
Figure 2.3 Research on Diversification: Themes and Linkages
diversification emphasizes the entry of firms into new markets with new products.
According to Ramanujan and Varadarajan (1989), diversification is defined as the entry of
a firm or business unit new lines of activity, either by processes of internal business
development or acquisition. From this perspective, simple product line extensions that are
not accompanied by changes in administrative linkage mechanisms do not fall under the
idea of diversification.
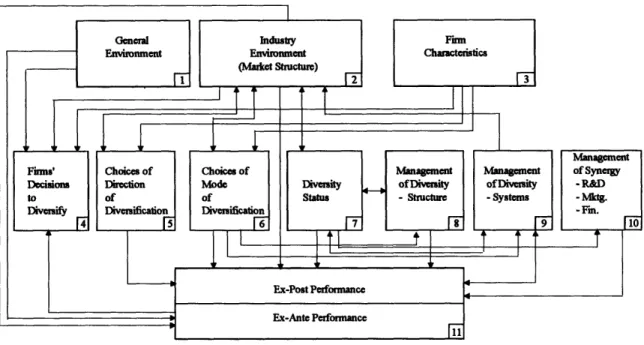
Ramanujan and Varadarajan (1989) proposed a schematic framework of classifying the
literatures on diversification in Figure 2.3. Figure 2.3 consists of 11 boxes that represent
central themes or concepts in the literature of diversification. Box 1 through Box 3 and
Gencml nduesty Emiromnment Emnvrocrent (Malket Stuctue) r -Ex-Post Performance Ex-Ante Perfonnrmance F I'
iii
-1 I I~~~~~---'
-Firms to D~ierI .Box 11 represent "generic" strategic management concepts. The concepts include the
general environment, the industry environment, firm characteristics, and corporate
performance. In contrast, boxes 4 through 10 in the middle level of the framework include
themes specific to the topic of diversification.
2.2.1 Direction of Diversification
After firms have found the needs to diversify their business, they then have to make
decisions. From his exploration of tobacco industry, Mile (1982) proposed the concept of
how firms' diversification decisions were formed by the structure of the industry, the
general environment, firm's characteristics, and firm's performance.
Once the decisions were taken, the next issue that firms would face is the direction in which to diversify. According to Abell (1980), a business can be defined with the
customer functions it seeks to satisfy, the customer groups it targets, and the technologies
it uses in satisfying the customer functions sought by the targeted customer groups. The
new lines of activities into which a firm chooses to diversify may therefore involve
modifications along one or more of these key dimensions of business definition. Typically, firms concentrate on the dimension that represents their greatest strength or offers the
greatest opportunity. Harris and Carleton (1984) find that, firms usually tend to diversify
into industries that are similar to their primary industry with advertising intensity, R&D
intensity, and/or buyer/seller relationship.
Generally, there are two directions adopted by firms: related diversification and unrelated diversification. Diversification focused on realizing technological and marketing
synergy's can be classified as related diversification, while that undertaken to achieve vertical economies (i.e., reducing costs by integrating backward or forward) or economies
in the securing and allocation of financial resources (i.e. the exploration of capital market
imperfection) is described as unrelated diversification. According to their works on
industrial organization economies, Melicher and Rush (1973) proposed that, conglomerate
diversification is usually understood as unrelated diversification.
2.2.2 Mode of Diversification
Besides the directions to diversify, the firms also have to choose the diversification
mode. From Ramanujan and Varadarajan's (1989) work, the diversification mode can be
describe as "the extent to which the firm relies on internal business development or
acquisitions as a mean of entering new lines of activity." The polar extremes are "internal
growth," versus "acquisition-based growth."
The rising cost of internal development together with the shortening of product life
cycles has rendered acquisition-based diversification increasingly attractive to firms. A number of studies, therefore, focus on acquisitions and mergers as a strategy of growth.
In addition, evaluations of the impact of merger activity as well as the performance of
specific mergers appear with increasing frequency in the business press. Executives who
built large conglomerates using strategies of acquisition-based growth have also recently
contributed their insights on the rationale and effectiveness of unrelated diversification
through acquisitions. Other modes of entry into new lines of activity such as licensing,
independent entities, fall somewhere between the pure polar extremes and have been
discussed in a number of studies.
2.2.3 Diversity Status
After a firm has engaged in diversification over time and has pursued several diversification projects, by whichever mode it chooses to grow, it attains a certain
diversity status or profile. The most prominent of all these studies is the work of Rumelt
(1974), which established differences in financial performances across diversification categories and has been extended and replicated in numerous ways. In his scheme it becomes vertically integrated, related-diversified, or unrelated-diversified, each of these
has its own finer categories.
Most early industrial organization economics studies have been concerned with the
effects of diversification on market structure rather than performance. The diversified firm
was, and still is, widely believed to be able to exercise market power through such mechanisms as cross-subsidization, predatory pricing, reciprocity in buying and selling,
and creating or raising barriers to entry.
However, the converse idea that market structure determines diversity suggests that
different diversity profiles arise due to different forms of market failure. In an influential dissertation, Montgomery (1979) proposed that performance differences attributed by
Rumelt (1974) to diversification categories may be due to systematic market structure
differences across the diversification categories. The studies of Bettis and Mahajan (1985), Lecraw (1984) and Montgomery (1985) also support this concept. For these reasons,
market structure must be considered a central variable in the literature on diversification
and performance. Although market structure has been most often examined as a mediator
of the relationship between diversity and performance, it rarely has also been posited to influence other aspects of diversification, e.g., choice of diversification mode.
2.2.4 The Connection of Diversification and Performance
Beattie (1980) provides an overview of various theories of conglomerate
diversification:
(1) there are different various of profit-maximizing behavior: the pursuit of monopoly
power, the exploitation of cost opportunities due to synergy, and the reduction of
risk;
(2) some theories of diversification posit managerial growth-maximizing behavior as the wellspring of diversification decisions; and
(3) financial models assume "financial gamesmanship" on the part of corporate managers as a result of capital market imperfections.
These models concentrate on the accounting effects of diversification activities to
verify the efficiency of financial markets rather than to assess the effectiveness of
diversification pursued as a growth strategy. In fact, their central proposition is that, under
perfect capital markets, diversification should provide no benefits to investors since they
2.2.5 Measure of Performance and Implementation of Diversification Strategies
In recent years, there are two main research themes are evident. The first explores the
association between risk and return, and also examines the relationship to manager's risk
attitude. The second studies the linkage between strategy and risk/return performance.
Building on the work of Chandler (1962) and Wrigley (1970), Rumelt developed four
major and nine minor categories to characterize the diversification strategy of large firms.
The major categories were:
(1) Single Business. (2) Dominant Business.
(3) Related Business
(4) Unrelated Business.
The categories provided a spectrum of diversification strategies from firms that remain
essentially undiversified to firms that diversified significantly into unrelated area. Rumelt demonstrated a statistical linkage between diversification strategy and financial
performance. He found that in his sample of 246 firms:
(1) The related diversification strategies (related-constrained and related-linked) outperformed the other diversification strategies on average.
(2) The related-constrained diversification strategy achieved the highest performance
on the average (in related-constrained firms all component business are related to
each other, whereas in related-linked firms only one-to-one relationships are
required.)
In addition, Rumelt found that related diversified firms have an inherent advantage because they are able to extend their "core skills" (e.g., scientific research) into related
area.
After Rumelt's study, a number of research efforts have been made to replicate, refine and explain his diversification framework and findings. The study by Bettis and Hall (1982) is the first study that succeeded in the research on the linkage between risk/return
performance and diversification strategy. They used return on assets and its standard
deviation as a measure of risk/return performance, and found the evidence of a positive risk/return relationship in unrelated firms, a negative relationship in related-linked firms and no relationship in constrained firms. Their results suggested that for
related-linked firms, it is possible to simultaneously reduce risks and increase returns.
The other prominent study of Bowman (1980) found the risk/return paradox for
strategic management at industry level. Using 85 industries and return on equity and its
variance, he found the evidence of a negative risk/return relationship in more than 60
percent of industries. He argued that a well-devised strategy could simultaneously reduce
CHAPTER 3
DIVERSITY STATUS OF
CONSTRUCTION FIRMS IN THE U.S.
3.1 SAMPLE SELECTION
3.1.1 The Scope of SIC Codes
In this research the SIC code system is used for the sample selection. The 1972 Standard Industrial Classification (SIC) Manual has been developed by experts on classification in government and private industry, and is in general use among government agencies and among organizations outside the government. The SIC manual defined
construction in three broad types of activity: (1) building construction by general
contractors, (2) other construction by general contractors, and (3) construction by special
(1) Building construction by general contractors - General building contractors are primarily engaged in the construction of dwellings, office buildings, stores, farm buildings, and other projects of a similar character.
(2) Other construction by general contractors - Other referred to as heavy
construction contractors, these contractors are primarily engaged in the
construction of highways, streets bridges, and tunnels; docks and piers; dams and water projects; sewage collection, treatment, and disposal facilities; storm sewer
systems; air fields; and other heavy construction which involve either earth moving or the erection of structure and appurtenances, other than buildings.
(3) Construction by special trade contractors - Special trade contractors are primarily
engaged in specialized construction activities such as plumbing, painting, electrical work, carpentry, etc.
Table 3.1 shows the industries of two-digit SIC codes 15, 16, and 17, and number of U.S. construction firms of different SIC codes in 1993.
3.1.2 Procedure of Sampling
The sample with which the research uses was selected from the U.S. construction
firms. To qualify as a member in the sample, a construction firm must (1) be based in the United States; (2) provide public reports on their financial status; (3) operate its businesses
mainly in the fields related to construction industry. In this research, only those firms with main two-digit SIC (standard industrial classification) codes of 15, 16, or 17 (defined by 1982 Census of Construction Industries) are regarded as construction companies.
The sources which the author referred for sampling include:
(1) Million Dollar Director: American's Leading Public and Private Companies. Series 1993.
(2) America's Corporate Families, 1994.
(3) Ward's Business Directory of U.S. Private and Public Companies, 1994. (4) Standard & Poor's Register of Corporations Directors and Executives, 1994.
(5) Moody's Manual (Industrial, Municipal and Government, OTC Unlisted, Public Utility, Bank and Finance, and OTC), 1994.
The procedure of selecting sample is as follows:
Step 1: Choose public construction firms or those had annual sales of 1993 exceeding 100 million current dollars. There are 391 firms in total.
Step 2: Put numbers on each company, then select 100 from 391 by referring the first three numbers of random values in the random digits table.
To avoid the problems of unavailable financial data, the research chose mainly public
Table 3.1 SIC Codes of Construction Industries and Number of Firms, 1993
SIC No. of Total
Code Industry Finns Firms
15 BUILDING CONSTRUCTION - GENERAL CONTRACTOR AND OPERATIVE BUILDERS 152 General :Buildng Constractors - Residential Buildings
1521 Single-Family Housing Construction 398
1522 General Contractors - Residential Buildings, Other Than Single-Family 135 153 Operative Builders
1531 Operative Builders 54
154 General Building Contractors - Nonresidential Buildings
1541 General Contractors - Industrial Buildings and Warehouses 619 1542 General Contractors -Nonresential Buildings, Other Than Industrial Buildings and Warehouses 800
CONSTRUCTION OTHER THAN BUILDING CONSTRUCTION - GENERAL CONTRACTORS Highway and Street Construction, Except Elevated Highways
Highway and Street Construction, Except Elevated Highways Heavy Construction, Except Highway and Street Construction
Bridge, Tunnel, and Elevated Highway Construction
Water, Sewer, Pipe Line, Communication and Power Line Construction Heavy Construction, Not Elsewhere Classified
CONSTRUCTION - SPECIAL TRADE CONTRACTORS Plumbing, Heating (Except Eletric), and Air Conditioning
Plumbing, Heating (Except Eletric) and Air Conditioning Painting, Papre Hanging, and Decorating
Painting, Papre Hanging, and Decorating Electrical Works
Electrical Works
Masonry, Stonework Tile Setting, and Plastering Masonry, Stonework Setting, and Other Stonework
Plastering, Drywall, Acoustical and Insulation Work Terrazzo, Tile, Marble, and Mosaic Work
Carpentering and Flooring Carpentering
Floor Laying and Other Floorwork, Not Elsewhere Classified Roofing and Sheet Metal Work
Roofing and Sheet Metal Work Concrete Work
Concrete Work Water Well Drilling
Water Well Drilling
Miscellaneous Special Trade Contractors Structure Steel Erection
Glass and Glazing Work Excavating and Foundation Work Wrecking and Demolition Work
Installation or Erection of Building Equipment, Not Elsewhere Classified Special Trade Contractors, Not Elsewhere Classified
2006 499 91 170 247 1007 628 56 426 35 79 13 24 17 118 58 19 57 22 90 24 38 193 1897 TOTAL= 4910 Source: Ward's Business Directory of U.S. Private & Public Companies, 1994.
16 161 1611 162 1622 1623 1629 17 171 1711 172 1721 173 1731 174 1741 1742 1743 175 1751 1752 176 1761 177 1771 178 1781 179 1791 1793 1794 1795 1796 1799
3.2 METHODOLOGY - CLASSIFICATION SYSTEMS
3.2.1 Traditional Classification Approaches
The traditional approach to measuring an enterprise's product-market diversity relies
heavily on the SIC definitions of "product class" (typically using 4-digit "industry" codes).
Given the number N of such classes in which a firm is active and the fraction pj of the
firm's activity attributable to classj, a wide variety of diversification indices may be
created. Gort's (1962) composite index, for example, was defined as D3= N / max(pj)
and Berry's (1975) Herfindahl measure was H = 1- jp .
Such measure have the advantage of replicability, but all who have used them have
noted their shortcomings. Most serious are the varying degrees of breadth in the SIC
classes and the implicit assumption of equal 'dissimilarity' between distinct SIC classes. Instead of a single index of diversity, Wrigley (1970) introduced a new system of classification. Taking the term specialization ratio ( SR ) to characterize the proportion of
a firm's annual revenues attributable to its largest discrete product-market activity,
Wrigley's original categories may be described as follows: (1) Single Product: firms with SR between 0.95 and 1.0. (2) Dominant Product: firms with SR between 0.7 and 0.95. (3) Related Product: firms with SR less than 0.7.
(4) Unrelated Product: firms that diversified (usually by acquisition) into areas that are
not related to the original skills and strengths, other than financial, of the firm.
(1) The terms "single product" and "dominant product" tended to be interpreted too
narrowly.
(2) For the classifications to be replicable by other researchers more precise definitions
were needed.
(3) Adding some subcategories would be useful to describe certain observable and persistent differences in kind among the firms that fall in several of the categories.
(4) Vertically integrated firms posed special problems.
3.2.2 Rumelt's Classification System
To improve the original functions, Rumelt (1974) built a modified system which is
now still popular with researchers. In his study, Rumelt defined the concept of
'diversification strategy', a combination of a strategy and the relationship between
competence and opportunity, as (1) the firm's commitment to diversity per se; together with (2) the strengths, skills or purposes that span this diversity, demonstrated by the way
new activities are related to old activities.
In 1986, he renewed the version of the older system as follows:
(1) Specialization Ratio (SR): the proportion of a firm's annual revenues attributable
to its largest single business in a given year.
(2) Related Ratio (RR): the proportion of a firm's annual revenues attributable to its
largest group of related business. This is defined as a group of businesses such that
each is related to at least one other in the group but which need not exhibit any single common skill or resource.
(3) Related-Core ratio (CR): the proportion of a firm's annual revenues attributable to
its largest group of business which share or draw on the same common core skill,
strength, or resource.
(4) Vertical Ratio (VR): the proportion of a firm's annual revenues attributable to its
largest group of products, joint-products, by-products and end products associated
with the processing of a raw material through a set of stages.
According to the definitions, SR represents the indicator of diversity status used in
economics, RR and CR characterize the horizontal status of diversification strategies, and
VR is for the vertical status.
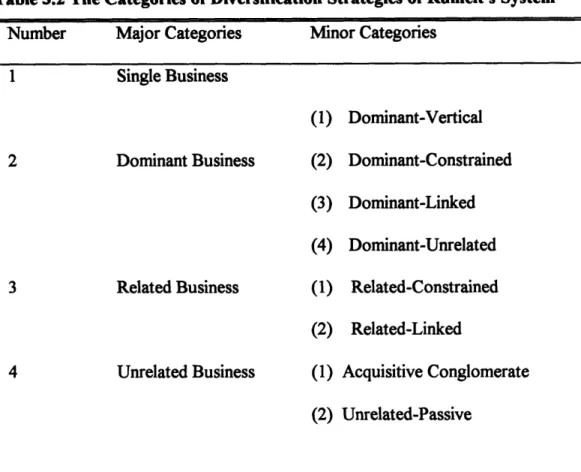
By using the four ratios, Rumelt set up a system which included four major categories
and all but the Single Business category was divided into subcategories, giving a total of
nine different classifications. Fig 3.1 presents a flow diagram that describes the process of
categorizing a firm, and Table 3.2 provides the major and minor categories of
diversification strategies. Their definitions are arranged in Appendix I.
The dividing line between Related and Unrelated firms was taken to be a related ratio
of 0.7. Setting the critical RR equal to the critical SR insures that a firm cannot qualify for
the Dominant category on the basis of its SR and for the Unrelated category on the basis
Single Business Dominant-Vertical Dominant Linked-Unrelated YES Related Constrained Unrelated Business Figure 3.1 Assigning Diversification Categories
SR: Speciali: RR: Related VR: Vertical CR: Related-Dominant-C _ _ _ __ _
Table 3.2 The Categories of Diversification Strategies of Rumelt's System
Number Major Categories Minor Categories
1 Single Business Dominant Business (1) (2) (3) (4) (1) (2) (1) (2) Related Business Unrelated Business Dominant-Vertical Dominant-Constrained Dominant-Linked Dominant-Unrelated Related-Constrained Related-Linked Acquisitive Conglomerate Unrelated-Passive
3.3 THE CLASSIFICATION OF SAMPLE FIRMS
Before calculating the four ratios needed in the classification of diversification
strategy, it is necessary to explain the rules used in this research to define the ranges and
relationships between these ratios and construction industries. Because of the distinct
characteristics of construction industries, new methods for the production of the four
ratios are introduced.
(1) Specialization Ratio (SR): according to Rumelt's (1986), it's the proportion of a
firm's annual revenues attributable to its largest single business in a given year. 2
3
Here the single business is defined as the business of a four-digit SIC code
industry.
(2) Related Ratio (RR): the fraction of a firm's revenues attributable to its largest
group of related business. In this research, the related businesses are defined as the
industries, besides those whose two-digit SIC codes of 15, 16, and 17, related to
any phase in a construction project. These related businesses include from
subdividers and developers, construction sand and gravel, concrete products, construction machinery, engineering and architectural management services, and construction materials.
(3) Related-Core ratio (CR): the fraction of a firm's annual revenues attributable to its
largest group of business which share or draw on the same common core skill,
strength, or resource. In this research, this ratio is set equal to RR, because in construction firms the resources and skills are almost shared by its related businesses.
(4) Vertical Ratio (VR): the fraction of a firm's annual revenues attributable to its
largest group of products, joint-products, by-products and end products associated
with the processing of a raw material through a set of stages. In this research, VR
is computed according to the nature of the construction firms, such as general
building contractors, special trade constructors, or heavy construction firms. For
example, a building contractor need to have (a) subdividers and developers that can manage the land; (b) its own subcontractors; (c) engineering and architectural
consultants; sometimes the suppliers of construction materials and architects are
also included.
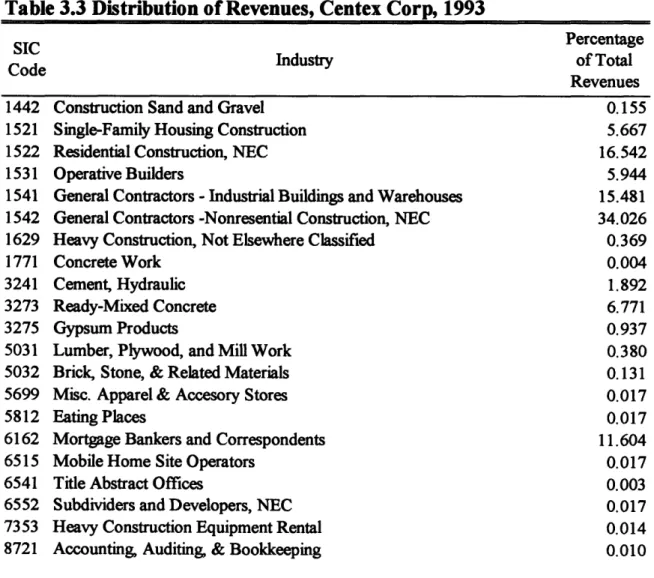
The data of Centex Corp., 1993, shown in Table 3.3, are used as an example to
describe how the four ratios are obtained. According to Table 3.3, the largest fraction of
Centex Corp.'s revenues in 1993 is 34.026 percent from the industry "General
Contractors-Nonresidential Construction, Not Elsewhere Classified", with the SIC code
1542. Therefore, Centex Corp.'s SR is 0.34026. About RR, CR, and VR, the product flow in Fig 3.2 can give a basic idea of how to get these ratios. Those industries at the left side
of the vertical dot line are related industry. Therefore, RR and CR are both equal 0.9966.
On the other hand, there are two main vertical processes of production, from materials to
engineering services. This means Centex Corp. operated its businesses in two vertical streams, the building contractors and heavy construction. The fractions of each industry
are 0.40312 and 0.58339, respectively. Since the larger fraction of these two stream is
Table 3.3 Distribution of Revenues, Centex Corp, 1993
SIC Percentage
Code Industry of Total
Revenues
1442 Construction Sand and Gravel 0.155
1521 Single-Family Housing Construction 5.667
1522 Residential Construction, NEC 16.542
1531 Operative Builders 5.944
1541 General Contractors - Industrial Buildings and Warehouses 15.481 1 542 General Contractors -Nonresential Construction, NEC 34.026
1629 Heavy Construction, Not Elsewhere Classified 0.369
1771 Concrete Work 0.004
3241 Cement, Hydraulic 1.892
3273 Ready-Mixed Concrete 6.771
3275 Gypsum Products 0.937
5031 Lumber, Plywood, and Mill Work 0.380
5032 Brick, Stone, & Related Materials 0.131
5699 Misc. Apparel & Accesory Stores 0.017
5812 Eating Places 0.017
6162 Mortgage Bankers and Correspondents 11.604
6515 Mobile Home Site Operators 0.017
6541 Title Abstract Offices 0.003
6552 Subdividers and Developers, NEC 0.017
7353 Heavy Construction Equipment Rental 0.014
8721 Accounting, Auditing, & Bookkeeping 0.010
Subdividers and Developers
Operative Builders/ Mobile Home Site Operators
Lumber, Brick, and o0 Materials
Mortgage Bankers
Related Industries
Fig. 3.2 Product Flow of Centex Corp.,1993
Source: America's Corporate Families, 1994
Apprael and Accesory Store
Eating Places
Unrelated Industries
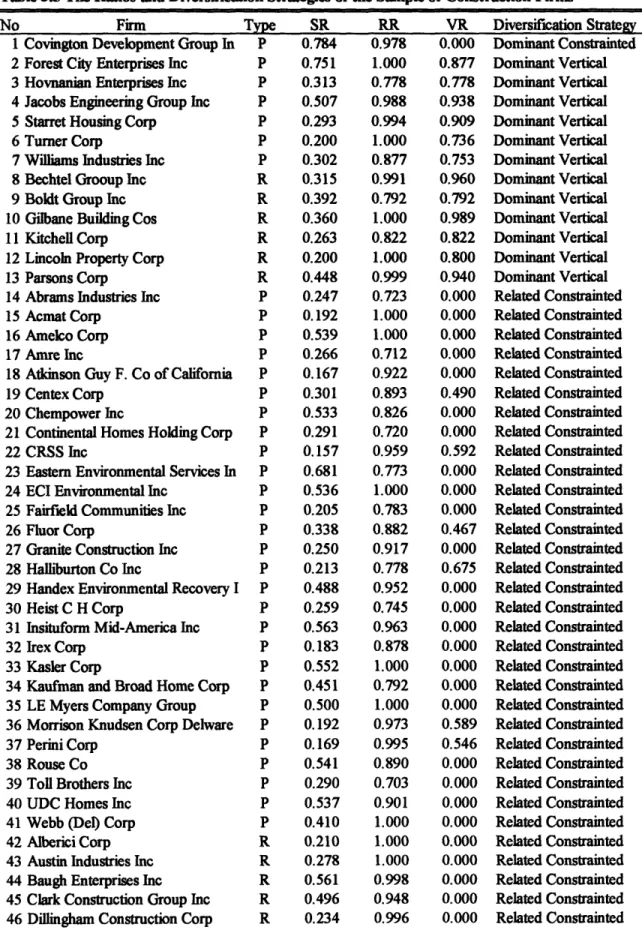
3.4 RESULTS OF CLASSIFICATION
In section 3.1 there were one hundred U.S. construction firms selected as the sample
for measuring the diversity status. However, eight companies of them are private ones or
subsidiaries so that their financial data are not available. Therefore, in this research only ninety-two firms' ratios were computed and then classified. The ratios and their
diversification strategies are shown in Table 3.5.
Housing Construction/ Residential Construction Engineering and Architectural Services I, I · all I I
Table 3.4 Diversification Status of U.S. Construction Industry, 1993
Diversification Strategy Number of Firms Percentage
Dominant-Constrained 1 1.09
Dominant-Vertical 12 13.04
Related-Constrained 43 46.74
Single-Business 11 11.96
Unrelated-Business 25 27.17
From Table 3.5, the distribution of diversification strategies in U.S. construction
industry can be expressed as in Table 3.6. Almost forty-seven percent of firms in the sample belong to the RC (related-constrained) diversification strategy group. This results
show that, till 1993, almost half of U.S. construction firms have diversified their
businesses into related industry, and one fourth diversified into unrelated fields. SB
(single-business) and dominant strategies seemed unpopular by managers, since the percentage of each of DC, DV, and SB is very low.
Table 3.5 The Ratios and Diversification Strategies of the Sample of Construction Firms No Firm
1 Covington Development Group In 2 Forest City Enterprises Inc 3 Hovnanian Enterprises Inc 4 Jacobs Engineering Group Inc 5 Starret Housing Corp
6 Turner Corp
7 Williams Industries Inc 8 Bechtel Grooup Inc 9 Boldt Group Inc 10 Gilbane Building Cos 11 Kitchell Corp
12 Lincoln Property Corp 13 Parsons Corp
14 Abrams Industries Inc 15 Acmat Corp
16 Amelco Corp 17 Amre Inc
18 Atkinson Guy F. Co of California 19 Centex Corp
20 Chempower Inc
21 Continental Homes Holding Corp 22 CRSS Inc
23 Eastern Environmental Services In
24 ECI Environmental Inc 25 Fairfield Communities Inc 26 Fluor Corp
27 Granite Construction Inc 28 Halliburton Co :nc
29 Handex Environmental Recovery I 30 Heist C H Corp
31 Insituform Mid-America Inc 32 Irex Corp
33 Kasler Corp
34 Kaufman and Broad Home Corp 35 LE Myers Company Group 36 Morrison Knudsen Corp Delware 37 Perini Corp
38 Rouse Co 39 Toll Brothers Inc 40 UDC Homes Inc 41 Webb (Del) Corp 42 Alberici Corp 43 Austin Industries Inc 44 Baugh Enterprises Inc 45 Clark Construction Group Inc 46 Dillingham Construction Corp
Type P P P P P P P R R R R R R P P P P P P P P P P P P P P P P P P P P P P P P P P P P R R R R R SR 0.784 0.751 0.313 0.507 0.293 0.200 0.302 0.315 0.392 0.360 0.263 0.200 0.448 0.247 0.192 0.539 0.266 0.167 0.301 0.533 0.291 0.157 0.681 0.536 0.205 0.338 0.250 0.213 0.488 0.259 0.563 0.183 0.552 0.451 0.500 0.192 0.169 0.541 0.290 0.537 0.410 0.210 0.278 0.561 0.496 0.234 RR 0.978 1.000 0.778 0.988 0.994 1.000 0.877 0.991 0.792 1.000 0.822 1.000 0.999 0.723 1.000 1.000 0.712 0.922 0.893 0.826 0.720 0.959 0.773 1.000 0.783 0.882 0.917 0.778 0.952 0.745 0.963 0.878 1.000 0.792 1.000 0.973 0.995 0.890 0.703 0.901 1.000 1.000 1.000 0.998 0.948 0.996 VR Diversification Strategy 0.000 0.877 0.778 0.938 0.909 0.736 0.753 0.960 0.792 0.989 0.822 0.800 0.940 0.000 0.000 0.000 0.000 0.000 0.490 0.000 0.000 0.592 0.000 0.000 0.000 0.467 0.000 0.675 0.000 0.000 0.000 0.000 0.000 0.000 0.000 0.589 0.546 0.000 0.000 0.000 0.000 0.000 0.000 0.000 0.000 0.000 Dominant Constrainted Dominant Vertical Dominant Vertical Dominant Vertical Dominant Vertical Dominant Vertical Dominant Vertical Dominant Vertical Dominant Vertical Dominant Vertical Dominant Vertical Dominant Vertical Dominant Vertical Related Constrainted Related Constrainted Related Constrainted Related Constrainted Related Constrainted Related Constrainted Related Constrainted Related Constrainted Related Constrainted Related Constrainted Related Constrainted Related Constrainted Related Constrainted Related Constrainted Related Constrainted Related Constrainted Related Constrainted Related Constrainted Related Constrainted Related Constrainted Related Constrainted Related Constrainted Related Constrainted Related Constrainted Related Constrainted Related Constrainted Related Constrainted Related Constrainted Related Constrainted Related Constrainted Related Constrainted Related Constrainted Related Constrainted