Publisher’s version / Version de l'éditeur:
Vous avez des questions? Nous pouvons vous aider. Pour communiquer directement avec un auteur, consultez la première page de la revue dans laquelle son article a été publié afin de trouver ses coordonnées. Si vous n’arrivez pas à les repérer, communiquez avec nous à [email protected].
Questions? Contact the NRC Publications Archive team at
[email protected]. If you wish to email the authors directly, please see the first page of the publication for their contact information.
https://publications-cnrc.canada.ca/fra/droits
L’accès à ce site Web et l’utilisation de son contenu sont assujettis aux conditions présentées dans le site LISEZ CES CONDITIONS ATTENTIVEMENT AVANT D’UTILISER CE SITE WEB.
Designing Structures for Fire Conference [Proceedings], pp. 203-214, 2003-10-01
READ THESE TERMS AND CONDITIONS CAREFULLY BEFORE USING THIS WEBSITE.
https://nrc-publications.canada.ca/eng/copyright
NRC Publications Archive Record / Notice des Archives des publications du CNRC :
https://nrc-publications.canada.ca/eng/view/object/?id=602b97ea-2fe2-4c61-b1db-449534eb2c5c https://publications-cnrc.canada.ca/fra/voir/objet/?id=602b97ea-2fe2-4c61-b1db-449534eb2c5c
Archives des publications du CNRC
This publication could be one of several versions: author’s original, accepted manuscript or the publisher’s version. / La version de cette publication peut être l’une des suivantes : la version prépublication de l’auteur, la version acceptée du manuscrit ou la version de l’éditeur.
Access and use of this website and the material on it are subject to the Terms and Conditions set forth at
Fire resistance performance of lightweight floor assemblies
Fire resistance performance of lightweight floor
assemblies
Sultan, M.A.; Bénichou, N.
NRCC-46105
A version of this document is published in / Une version de ce document se trouve dans :
Designing Structures for Fire Conference, Baltimore, MD.,
Sept. 30-Oct. 1, 2003, pp. 203-214
Fire Resistance Performance of Lightweight Floor Assemblies
Mohamed A. Sultan and Noureddine BenichouFire Risk Management Program Institute for Research in Construction National Research Council of Canada
[email protected] [email protected]
ABSTRACT
This paper presents and discusses the results of 23 full-scale fire resistance test assemblies conducted in accordance with ULC-S-101 standard on wood joist, wood-I joist and steel C-joist floor systems as part of the collaborative research program on the fire and acoustical performance of floor assemblies. Parameters investigated in this study include the effects of attachment of the gypsum board to a framing or to resilient channels, insulation type, number of gypsum board layers, joist spacing, resilient channel spacing, sub-floor type and structural load on the fire resistance performance of assemblies. Temperatures throughout the systems and floor deflection were measured. Using these results, the effects of the above-mentioned parameters on the fire resistance performance of floor assemblies are discussed.
INTRODUCTION
Fire-rated floor assemblies formed with new materials and construction methodologies have been increasingly used in residential buildings. Designers, architects and builders can choose rated-floor assemblies from different sources such as the listed assemblies or from the Part 9 Appendix A table of the National Building Code of Canada (NBCC). There are only 15 floor assemblies in Table A-9.10.3.1.B of the latest edition of the NBCC (1995)1 and the construction industry showed interest in increasing the number of floor assemblies listed in the NBCC table, so that designers, architects, builders, building officials and code users can have a variety of assemblies to choose from. Also, there have been numerous efforts to improve the quality of residential building environments in North America, including efforts to meet public demands for better acoustic isolation. During the same period, new construction materials have been developed and many construction practices and product specifications have changed over the past several years. Concerns have been expressed that such changes may have altered the fire resistance of floor systems. In response to the changes noted above, the Institute for Research in Construction (IRC), National Research Council of Canada (NRC), in collaboration with industry and government partners, carried out a major research program to measure the fire resistance and acoustic performance of full-scale floor assemblies. Parameters investigated in this study include the effects of attachment of the gypsum board to a framing or to resilient channels, insulation type, number of gypsum board layers, joist spacing, resilient channel spacing, sub-floor type and structural load. The results of this study and a study on the acoustical performance were used as the basis for the published update Part 9 Appendix A table of the NBCC that included more than 700 floor assemblies with 200 of them with fire resistance ratings. The list of these assemblies is on the Website (http://www.ccbfc.org/ccbfc/changes/soundfire_E.shtml).
DESCRIPTION OF TEST ASSEMBLIES
Twenty-three floor assemblies, 4.8 m long by 3.9 m wide, were constructed in accordance with CAN/CSA-A82.31-M912. Construction details for the assemblies are available in Reference 4. Three type of framing were used: wood joist, wood-I joist and C-steel joist. Details on the joist and resilient channel spacing for each assembly are given in Table 1. Three types of insulation were used: glass, rock fibre and cellulose fibre insulation.
INSTRUMENTATION AND TEST CONDITIONS
Thermocouples were used to measure temperatures inside the wall cavity and on each gypsum board surface. Details on the locations of the thermocouples can be found in Reference 4. The temperature on the unexposed surface for all assemblies was measured at 9 locations in accordance with
CAN/ULC-S101-M893. The loads used in this study are given in Table 1. Tests were conducted in accordance with CAN/ULC-S101-M89 that is similar to ASTM E1194.
RESULTS AND DISCUSSION
The results of the 23 full-scale fire resistance floor tests are summarised in Table 1. The effects of different parameters on the fire resistance of floor assemblies are discussed below.
Effect of Attachment of the Gypsum Board
Floor Assemblies No. 1 and 2 with wood joists were tested to investigate the effect of the gypsum board screw spacing (10 mm and 38 mm) from board edges with a single layer of gypsum board ceiling finish attached to resilient channels. Assembly No. 1, with screws at 10 mm, provided 30 min of fire resistance while Assembly No. 2, with screws at 38 mm, provided 45 min. These results showed that by moving the screws away from the board edges (from 10 mm to 38 mm), the fire resistance increased by 50%. This can be explained below.
The results shown in Figure 1 (a and b) indicate that the temperature began to increase on the gypsum board facing the floor cavity approximately 2 min after the test was started in both assemblies. There was a gradual increase in temperature to 125°C at 18 min in the assembly with screws at 10 mm and at 15 min in the assembly with screws at 38 mm and at that time, the water in the board was driven off and the gypsum board core became dry; consequently, the board edges started to shrink, especially at the vicinity of the screw heads due to rapid heat transfer by the steel screws to the gypsum core around them. The board edges peeled away from the screw heads much faster in the assembly with screws at 10 mm, as they were located much closer to the edges, than in the assembly with screws at 38 mm. Thus, the sub-floor and joist sides were fully exposed to the furnace heat much earlier in the former assembly. This accelerated the burning of the joists and sub-floor and caused the assembly with screws at 10 mm from the board edges to fail earlier.
Effect of Insulation Installation and Types
Assemblies No. 2 to 5 (wood joist with 1 layer of gypsum board), No. 6 to 9 (wood joist with 2 layers of gypsum board), No.10 to 12 (wood-I-joist with 1 layer gypsum board), No. 13 to 15 (wood-I-joist with 2 layers of gypsum board) and No. 18 and 19 (C-steel joist with 2 layers of gypsum board) were tested to investigate the effect of insulation type (glass, rock and cellulose fibre) on the fire resistance.
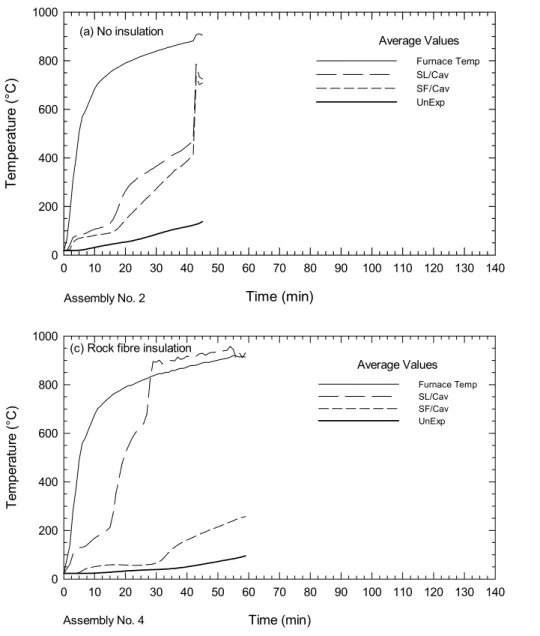
Floor Assemblies with Wood Joists – The results shown in Figure 2 (a to d) and test observations, for insulated and non-insulated assemblies with wood joist and 1 layer of gypsum board (Assemblies No. 2 to 5), indicate that the temperature began to increase on the gypsum board facing the floor cavity approximately 2 min after the test was started and this rate of temperature increase was faster in the insulated assemblies compared to a non-insulated assembly. This was followed by a gradual increase in temperature to 125°C at 8 to 15 min and at that time, the water in the board was driven off and the gypsum board core became dry; consequently, the temperature increase was substantially higher (900°C) at the gypsum board on the cavity side for insulated assemblies than a non-insulated assembly (450°C). As a result of the substantial increase in board temperature (at 27 min for assemblies with either glass or rock fibre insulation and at 35 min for assembly with cellulose fibre insulation), the board cracked and fell off, unlike the non-insulated assembly. However, in the assembly with glass fibre insulation, the fibre melted when it was exposed to furnace heat in about 2 to 3 min after the gypsum board had fallen off; consequently, the sub-floor and joist sides were exposed to the furnace heat and the glass fibre was unable to compensate for the earlier failure of the gypsum board and provided a negative effect in the fire resistance. The rock and cellulose fibre remained in place after the gypsum board fell off and was able to compensate for the early failure of the gypsum board as well as protect the joist and sub-floor from furnace heat and thus, both rock and cellulose fibre insulation provided a positive effect on fire resistance. The fire resistance results of Assemblies No. 2 to 5 given in Table 1 showed that, compared to a non-insulated assembly, which provided a 45 min fire resistance, the installation of the glass fibre reduced the
fire resistance by 20% while the rock and cellulose fibre increased the fire resistance by 33% and 31%, respectively.
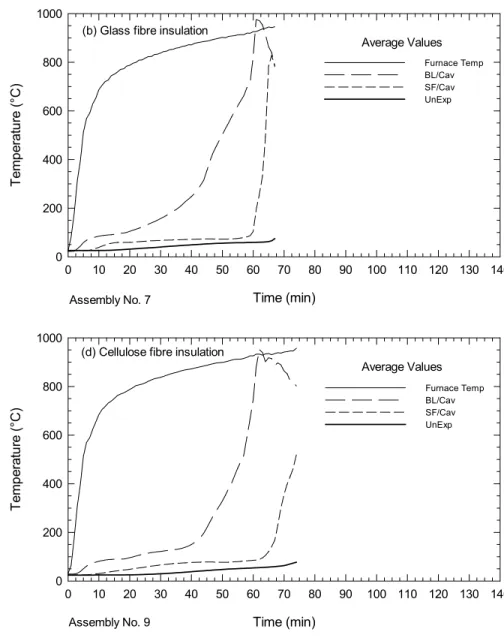
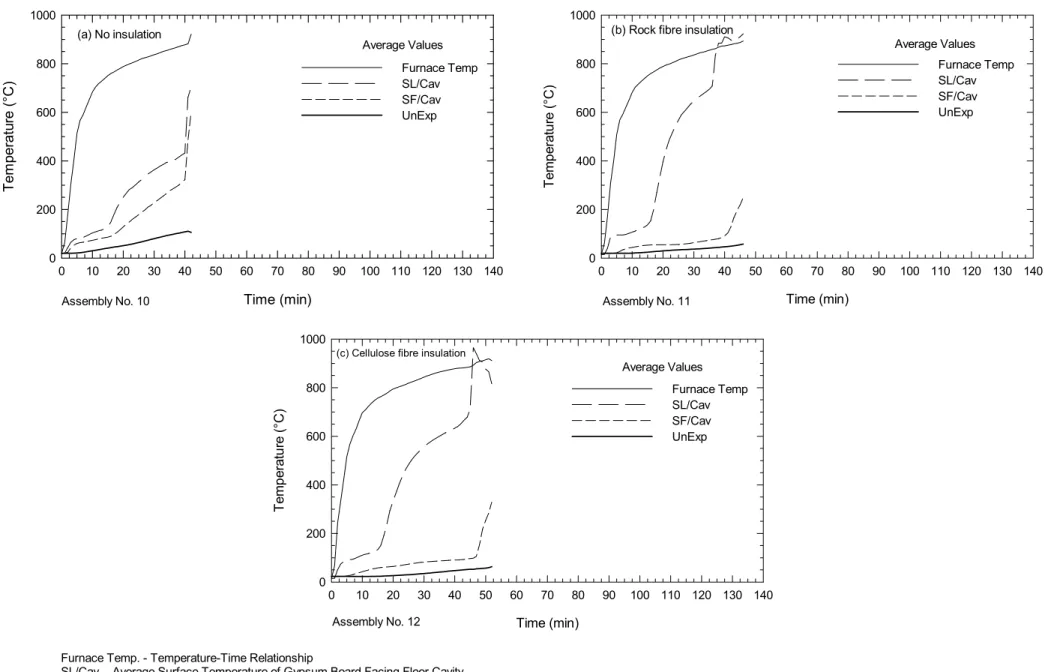
The results shown in Figure 3 (a to d) for Assemblies No. 6 to 9 with 2 layers of gypsum board indicate that the temperature began to increase on the gypsum board facing the floor cavity approximately 3 min after the test was started and this rate of temperature increase was faster in the insulated assemblies compared to a non-insulated assembly. This was followed by a gradual increase in temperature to 125°C at 25 to 40 min. At that time, the water in the board was driven off and the gypsum board core became dry; consequently, the temperature increase was substantially higher (900°C) at the gypsum board on the cavity side for insulated assemblies than a non-insulated assembly (500°C). As a result of the substantial increase in board temperature, the board cracked and fell off at approximately 60 min, unlike the non-insulated assembly at 75 min. In an non-insulated assembly with 2 layers of gypsum board, the exposure time for indirect furnace heat (conduction through the board) was much longer than in an insulated assembly with 1 layer of gypsum board. The deteriorated glass, rock and cellulose fibre insulations were unable to compensate for the earlier failure of the gypsum board and thus, all insulations provided a negative effect on fire resistance. The fire resistance results for Assemblies No. 6 to 9 given in Table 1 showed that, compared to a non-insulated assembly, which provided an 80 min fire resistance, the insulation reduced the fire resistance by 16% with glass fibre, by 10% with rock fibre and by 7.5% with cellulose fibre. Floor Assemblies with Wood-I Joists - The results shown in Figure 4 (a to c) for assemblies with 1 layer of gypsum board indicate that the temperature began to increase on the gypsum board facing the floor cavity approximately 2 min after the test was started and this rate of temperature increase was faster in the insulated assemblies compared to a non-insulated assembly. This was followed by a gradual increase in temperature to 125°C at 15 min and at that time, the water in the board was driven off and the gypsum board core became dry; consequently, the temperature increase was substantially higher (900°C) at the gypsum board on the cavity side for insulated assemblies than a non-insulated assembly (450°C). As a result of the substantial increase in board temperature, the board cracked and fell off. However, the rock and cellulose fibre remained in place after the gypsum board fell off and was able to compensate for the early failure of the gypsum board as well as protect the joist and sub-floor from furnace heat and thus, both rock and cellulose fibre insulation provided a positive effect on fire resistance. The fire resistance results for Assemblies No. 10 to 12 given in Table 1 showed that, the insulation increased the fire resistance by 10% in the assembly with rock fibre and by 24% in the assembly with cellulose fibre compared to an assembly with no insulation in the floor cavity. In assemblies with wood-I-joists, the rock and cellulose fibre, like in the assembly with wood joists, provided a positive effect on fire resistance. The results shown in Figure 5 (a to c), for Assemblies No. 13 to 15 with 2 layers of gypsum board indicate that the temperature began to increase on the gypsum board facing the floor cavity approximately 3 min after the test was started and this rate of temperature increase was faster in the insulated assemblies compared to a non-insulated assembly. This was followed by a gradual increase in temperature to 125°C at 30 to 55 min and at that time, the water in the board was driven off and the gypsum board core became dry; consequently, the temperature increase was substantially higher (900°C) at the gypsum board on the cavity side for insulated assemblies than a non-insulated assembly (400°C). As a result of the substantial increase in board temperature, the board cracked and fell off at approximately 61 min for the assembly with glass fibre, 70 min for the assembly with rock fibre and non-insulated assembly. However, in the assembly with glass fibre insulation, the fibre melted when exposed to furnace heat in about 3 min; consequently, the sub-floor and joist sides were exposed to the furnace heat and glass fibre was unable to compensate for the earlier failure of the gypsum board and provided a negative effect in the fire resistance while the rock fibre remained in place after the gypsum board fell off and was able to compensate for the early failure of the gypsum board as well as protect the joist and sub-floor from furnace heat and thus, the rock fibre insulation provided a positive effect on fire resistance. The fire resistance results for Assemblies No. 13 to 15 given in Table 1, showed that the insulation reduced the fire resistance by 7% in
the assembly with glass fibre and increased the fire resistance by 7% in the assembly with rock fibre compared to an assembly with no insulation.
Floor Assemblies with C-Steel Joists – The results shown in Figure 6 (a and b) for Assemblies No. 18 and 19 indicate that the temperature began to increase on the gypsum board facing the floor cavity approximately 3 min after the test was started and this rate of temperature increase was faster in the insulated assemblies compared to a non-insulated assembly. This was followed by a gradual increase in temperature to 125°C at 40 to 45 min. At that time, the water in the board was driven off and the gypsum board core became dry; consequently, the temperature increase was substantially higher (900°C) at the gypsum board on the cavity side for insulated assemblies than a non-insulated assembly (400°C). As a result of the substantial increase in board temperature, the board cracked and fell off at approximately 62 min for the assembly with glass fibre, 71 min for non-insulated assembly. However, in the assembly with glass fibre insulation, the fibre melted when it was exposed to furnace heat in about 3 min; consequently, the sub-floor and joist sides were exposed to the furnace heat and glass fibre was unable to compensate for the earlier failure of the gypsum board and provided a negative effect in the fire. The fire resistance results for Assemblies No. 18 and 19 given in Table 1, showed that the installation of glass fibre insulation in the floor cavity of the assembly with a double-layer gypsum board reduced the fire resistance by 8% compared to an assembly with no insulation in the floor cavity.
Effect of Number of Gypsum Board Layers
Floor Assemblies with Wood Joists - Floor Assemblies No. 1 and 6 were tested to investigate the effect of the number of gypsum board layers on the fire resistance of non-insulated wood joist assemblies. The fire resistance of these assemblies given in Table 1, showed that the assembly with a double-layer of 12.7 mm gypsum board ceiling finish provided an increase in fire resistance of 78% compared to an assembly with a single layer of 12.7 mm gypsum board.
Floor Assemblies with Wood-I Joists - Floor Assemblies No. 10 and 13 were tested to investigate the effect of the number of gypsum board layers on the fire resistance of non-insulated wood-I-joist assemblies. The results given in Table 1, showed that the assembly with a double-layer gypsum board ceiling finishes provided an increase in the fire resistance of 71% compared to an assembly with a single layer of 12.7 mm gypsum board.
For the assemblies above, the more layers of 12.7 mm gypsum board used, the more protection was provided to the wood joists and thus, the better the fire resistance.
Effect of Joist Spacing
Floor Assemblies with Wood-I Joists - Floor Assemblies No. 14 and 16 were tested to investigate the effect of joist spacing (406 mm o.c. and 610 mm o.c.) on the fire resistance of wood-I-joist floor assemblies with a double layer gypsum board ceiling finish and glass fibre insulation in the floor cavity. Assembly No. 14 (with 406 mm o.c. joist spacing) provided 64 min of fire resistance while Assembly No. 16 (with 610 mm o.c. joist spacing) provided 74 min. The assembly with the wider joist spacing provided better fire resistance due to the increase in convective cooling inside the larger floor cavities created by the joists that slightly reduced the heat build-up in the gypsum board core and insulation compared to the assembly with smaller cavities.
Floor Assemblies with C-Steel Joists - Floor Assemblies No. 19 and 20 were tested to investigate the effect of joist spacing (406 mm o.c. and 610 mm o.c.) on the fire resistance performance of steel joist floor assemblies with a double layer gypsum board ceiling finish and glass fibre insulation in the floor cavity. Assembly No. 20 (with 406 mm o.c. joist spacing) provided 68 min, while Assembly No. 21 (with 610 mm o.c. spacing) provided 69 min. The difference in the fire resistance is within the systematic error of the test procedure. These results showed that, unlike the case with wood-I-joist assemblies, the effect of steel joist spacing on fire resistance is insignificant. For these assemblies, the joist spacing did not play a role in the fire resistance due to the heat transfer from the steel joist edges to the web.
Effect of Resilient Channel Spacing
Floor Assemblies 16 and 17 were tested to investigate the effects of the resilient channel spacing (406 mm o.c. and 610 mm o.c.) on the fire resistance of wood-I-joist floor assemblies with a double layer gypsum board ceiling finish and glass fibre insulation in the floor cavity. Assembly No. 16 (with 406 mm o.c. channel spacing) provided 74 of min fire resistance while Assembly 17 (with 610 mm o.c. channel spacing) provided 65 min. The assembly with the wider resilient channel spacing provided less fire resistance due in part to the lesser number of fasteners for the gypsum board. The more screws the assembly has, the better chance for the gypsum board to remain in place and protect the frame and thus, the better the fire resistance.
Effect of Sub-floor Type
Assemblies 20 and 21 were conducted to investigate the effect of adding concrete topping above the plywood sub-floor. Assembly 20 with no concrete topping provided 68 min of fire resistance and Assembly 21 with concrete topping provided 60 min. Adding concrete topping reduced the heat transfer across the assembly. As a result, the gypsum board temperature was higher in the assembly with concrete topping and consequently fell off earlier than the assembly with no concrete topping.
Effect of Load
Assemblies 6, 7, 22 and 23 were conducted to determine the effect of load on the fire resistance. Assemblies 6 (no insulation) and 7 (with insulation) were tested with 75% design load and Assemblies 22 (no insulation) and 23 (with insulation) were tested with 100% design load. Assembly 6 provided 80 min and Assembly 22 provided 69 min of fire resistance. Also, Assembly 7 provided 67 min and Assembly 23 provided 67 min of fire resistance. These results showed that when the load increased by 25%, the fire resistance decreased by 14% for non-insulated assembly and by 3% in an insulated assembly.
CONCLUSIONS
In this paper, the results of twenty-three full-scale fire resistance tests conducted to investigate various parameters on the fire resistance of lightweight frame floor assemblies were presented. Based on the results of the tests, the following conclusions can be drawn:
1. Assemblies with screws located further away from board edges (38 mm versus 10 mm) provide higher fire resistance.
2. In assemblies with wood joists and a single-layer gypsum board ceiling finish, the glass fibre reduced the fire resistance while the rock and cellulose fibre increased the fire resistance compared to a non-insulated assembly. In assemblies with a double-layer of 12.7 mm gypsum board finish, the glass, rock and cellulose fibre all reduced the fire resistance compared to a non-insulated assembly.
3. For floor assemblies with wood-I-joists and single layer of 12.7 mm gypsum board ceiling finish, the rock and cellulose fibre insulation increased the fire resistance compared to a non-insulated assembly. In assemblies with a double layer of 12.7 mm gypsum board finish, the glass fibre reduced the fire resistance while rock fibre increased the fire resistance compared to a non-insulated assembly.
4. Assemblies with two layers of 12.7 mm gypsum board with staggered joints provided a significant increase in the fire resistance compared to an assembly with one layer of 12.7 mm gypsum board. 5. For wood-I joist floor assemblies with glass fibre insulation and a double layer of 12.7 mm gypsum
board, the effects of joist spacing and resilient channel spacing (406 mm o.c. and 610 mm o.c.) were significant.
6. For floor assemblies with C-steel joists and a double-layer of 12.7 mm gypsum board ceiling finish, glass fibre insulation reduced the fire resistance compared to a non-insulated assembly and the effect of joist spacing (406 mm o.c. and 610 mm o.c.) was insignificant.
7. Adding concrete topping to plywood sub-floor reduced the fire resistance. 8. The increase in structural load decreases fire resistance.
REFERENCES
1. National Building Code of Canada (Part 9), National Research Council of Canada, Ottawa, ON, 1995. 2. CAN/CSA-A82.31-M91, Gypsum Board Application: Rexdale, Ontario, 1991 Canadian Standards
Association.
3. CAN/ULC-S101-M89, Standard Methods of Fire Endurance Tests of Building Construction and Materials. Underwriters' Laboratories of Canada, Scarborough, ON, 1989.
4. Sultan, M.A., Seguin, Y.P.. Leroux P., Results of Fire Resistance Tests on Full-Scale Floor Assemblies, Internal Report No. 764, Institute for Research in Construction, National Research Council of Canada, Ottawa, ON, 1998.
5. ASTM E119-88, Standard Test Method for Fire Tests of Building Construction and Materials, ASTM, West Conshohocken, PA, 1988.
Table 1 Assembly Parameters and Fire Resistance Test Results
Assembly Joist Ceiling Finish Sub-Floor Cavity Insulation Resilient Channels Load Time to Type of Number Type Depth Spacing Type Thick Layers Type Thick Type Thick Location Orient. Spacing (N/m²) Failure Failure
(mm) (mm) (mm) (mm) (mm) (mm) (min)
1 WJ* 235 400 X 12.7 1 Ply 15.5 *** *** *** Per 406 3838 30 Flame
2 WJ 235 400 X 12.7 1 Ply 15.5 *** *** *** Per 406 3838 45 Flame
3 WJ 235 400 X 12.7 1 Ply 15.5 G1 90 B Per 406 3828 36 Flame
4 WJ 235 400 X 12.7 1 Ply 15.5 M1 90 B Per 406 3838 60 Flame
5 WJ 235 400 X 12.7 1 Ply 15.5 C1 93 T Per 406 3838 59 Flame
6 WJ 235 400 X 12.7 2 Ply 15.5 *** *** *** Per 406 3838 80 Flame
7 WJ 235 400 X 12.7 2 Ply 15.5 G1 90 B Per 406 3838 67 Flame
8 WJ 235 400 X 12.7 2 Ply 15.5 M1 90 B Per 406 3838 72 Flame
9 WJ 235 400 X 12.7 2 Ply 15.5 C1 125 T Per 406 3838 74 S/F
10 WIJ 240 400 X 12.7 1 Ply 15.5 *** *** *** Per 406 4605 42 S/F
11 WIJ 240 400 X 12.7 1 Ply 15.5 M1 90 B Per 406 4653 46 S/F
12 WIJ 240 400 X 12.7 1 Ply 15.5 C1 90 T Per 406 4054 52 Flame
13 WIJ 240 400 X 12.7 2 Ply 15.5 *** *** *** Per 406 3934 72 S/F
14 WIJ 240 400 X 12.7 2 Ply 15.5 G1 90 B Per 406 3982 64 S/F
15 WIJ 240 400 X 12.7 2 Ply 15.5 M1 90 B Per 406 3982 77 S/F
16 WIJ 240 600 X 12.7 2 Ply 19 G1 90 B Per 406 2590 74 S/F
17 WIJ 240 600 X 12.7 2 Ply 19 G1 90 B Per 610 3120 65 S/F
18 SJ 203 400 X 12.7 2 Ply 15.5 *** *** *** Per 406 2950 74 S/F 19 SJ 203 400 X 12.7 2 Ply 15.5 G1 90 B Per 406 2950 68 S/F 20 SJ 203 600 X 12.7 2 Ply 19 G1 90 B Per 406 1799 69 S/F 21 SJ 203 406 X 12.7 2 Ply/Con 15.5/38 G1 90 B Per 406 1915 60 S/F 22 WJ 235 406 X 12.7 2 Ply 15.5 *** *** *** Per 406 5075 69 S/F 23 WJ 235 406 X 12.7 2 Ply 19 G1 90 B Per 406 5075 65 S/F
S/F - Structural Failure and Flame Penetration Ply - Plywood
Per - Perpendicular to Joists *** - Null Value
X - Type X T - Top
C1 - Cellulose Fibre Insulation B - Bottom
G1 - Glass Fibre Insulation WJ - Wood Joist
M1 - Rock Fibre Insulation SJ - Steel Joist
WIJ - Wood-I Joist Con - Concrete
Time (min)
0
10
20
30
40
50
60
70
80
90
100 110 120 130 140
T
e
m
p
erature (
°C
)
0
200
400
600
800
1000
Furnace Temp SL/Cav SF/Cav UnExpFigure 1. Temperature Distributions for Floor Assemblies with Screw spacing at 10 mm and 38 mm from Board Edges
Average Values (a) Screw spacing at 10 mm
Furnace Temp. - Temperature-Time Relationship
SL/Cav. - Average Surface Temperature of Gypsum Board Facing Floor Cavity SF/Cav. - Average Surface Temperature of Sub-Floor Facing Floor Cavity UnExp. - Average Temperature on the Unexposed Surface
Time (min)
0
10
20
30
40
50
60
70
80
90
100 110 120 130 140
T
e
m
p
erature (
°C
)
0
200
400
600
800
1000
Furnace Temp SL/Cav SF/Cav UnExp (b) Screw spacing at 38 mm Average Values Assembly No. 1 Assembly No. 2Time (min) 0 10 20 30 40 50 60 70 80 90 100 110 120 130 140 Te m p era tu re (°C ) 0 200 400 600 800 1000 Furnace Temp SL/Cav SF/Cav UnExp
Figure 2. Temperature Distributions in Insulated and Non-Insulated Floor Assemblies with Solid Wood Joists and a Single Layer of Gypsum Board Average Values (a) No insulation Time (min) 0 10 20 30 40 50 60 70 80 90 100 110 120 130 140 T e mp e ratu re (° C ) 0 200 400 600 800 1000 Furnace Temp SL/Cav SF/Cav UnExp
(b) Glass fibre insulation
Time (min) 0 10 20 30 40 50 60 70 80 90 100 110 120 130 140 T e m p e rat u re ( °C ) 0 200 400 600 800 1000 Furnace Temp SL/Cav SF/Cav UnExp
(c) Rock fibre insulation
Time (min) 0 10 20 30 40 50 60 70 80 90 100 110 120 130 140 T e m p e rat u re ( °C ) 0 200 400 600 800 1000 Furnace Temp SL/Cav SF/Cav UnExp
(d) Cellulose fibre insulation Average Values
Average Values
Average Values
Assembly No. 2 Assembly No. 3
Assembly No. 4 Assembly No. 5
Furnace Temp. - Temperature-Time Relationship
SL/Cav. - Average Surface Temperature of Gypsum Board Facing Floor Cavity SF/Cav. - Average Surface Temperature of Sub-Floor Facing Floor Cavity UnExp. - Average Temperature on the Unexposed Surface
Figure 3. Temperature Distributions in Insulated and Non-Insulated Floor Assemblies with Solid Wood Joists and a Double Layer of Gypsum Board Average Values
(a) No insulation (b) Glass fibre insulation
(c) Rock fibre insulation (d) Cellulose fibre insulation
Average Values
Average Values
Average Values
Assembly No. 6 Assembly No. 7
Assembly No. 8 Assembly No. 9
Furnace Temp. - Temperature-Time Relationship
BL/Cav. - Average Surface Temperature of Gypsum Board Facing Floor Cavity SF/Cav. - Average Surface Temperature of Sub-Floor Facing Floor Cavity UnExp. - Average Temperature on the Unexposed Surface
Time (min) 0 10 20 30 40 50 60 70 80 90 100 110 120 130 140 Te m p era tu re (°C ) 0 200 400 600 800 1000 Furnace Temp BL/Cav SF/Cav UnExp Time (min) 0 10 20 30 40 50 60 70 80 90 100 110 120 130 140 T e mp e ratu re (° C ) 0 200 400 600 800 1000 Furnace Temp BL/Cav SF/Cav UnExp Time (min) 0 10 20 30 40 50 60 70 80 90 100 110 120 130 140 T e m p e rat u re ( °C ) 0 200 400 600 800 1000 Furnace Temp BL/Cav SF/Cav UnExp Time (min) 0 10 20 30 40 50 60 70 80 90 100 110 120 130 140 T e m p e rat u re ( °C ) 0 200 400 600 800 1000 Furnace Temp BL/Cav SF/Cav UnExp
Figure 4. Temperature Distributions in Insulated and Non-Insulated Floor Assemblies with Wood-I-Joists and a Single Layer of Gypsum Board Average Values
(a) No insulation (b) Rock fibre insulation
(c) Cellulose fibre insulation
Average Values
Average Values
Assembly No. 10 Assembly No. 11
Assembly No. 12 Furnace Temp. - Temperature-Time Relationship
SL/Cav. - Average Surface Temperature of Gypsum Board Facing Floor Cavity SF/Cav. - Average Surface Temperature of Sub-Floor Facing Floor Cavity UnExp. - Average Temperature on the Unexposed Surface
Time (min) 0 10 20 30 40 50 60 70 80 90 100 110 120 130 140 Te m p era tu re (°C ) 0 200 400 600 800 1000 Furnace Temp SL/Cav SF/Cav UnExp Time (min) 0 10 20 30 40 50 60 70 80 90 100 110 120 130 140 T e mp e ratu re (° C ) 0 200 400 600 800 1000 Furnace Temp SL/Cav SF/Cav UnExp Time (min) 0 10 20 30 40 50 60 70 80 90 100 110 120 130 140 T e m p e rat u re ( °C ) 0 200 400 600 800 1000 Furnace Temp SL/Cav SF/Cav UnExp
Figure 5. Temperature Distributions in Insulated and Non-Insulated Floor Assemblies with Wood-I-Joists and a Double Layer of Gypsum Board Average Values
(a) No insulation (b) Glass fibre insulation
(c) Rock fibre insulation
Average Values
Average Values
Assembly No. 13 Assembly No. 14
Assembly No. 15 Furnace Temp. - Temperature-Time Relationship
BL/Cav. - Average Surface Temperature of Gypsum Board Facing Floor Cavity SF/Cav. - Average Surface Temperature of Sub-Floor Facing Floor Cavity UnExp. - Average Temperature on the Unexposed Surface
Time (min) 0 10 20 30 40 50 60 70 80 90 100 110 120 130 140 Te m p era tu re (°C ) 0 200 400 600 800 1000 Furnace Temp BL/Cav SF/Cav UnExp Time (min) 0 10 20 30 40 50 60 70 80 90 100 110 120 130 140 T e mp e ratu re (° C ) 0 200 400 600 800 1000 Furnace Temp BL/Cav SF/Cav UnExp Time (min) 0 10 20 30 40 50 60 70 80 90 100 110 120 130 140 T e m p e rat u re ( °C ) 0 200 400 600 800 1000 Furnace Temp BL/Cav SF/Cav UnExp
Figure 6. Temperature Distributions in Insulated and Non-Insulated Floor Assemblies with C-Steel Joists and a Double Layer of Gypsum Board Average Values
(a) No insulation (b) Glass fibre insulation
Average Values
Assembly No. 18 Assembly No. 19
Furnace Temp. - Temperature-Time Relationship
BL/Cav. - Average Surface Temperature of Gypsum Board Facing Floor Cavity SF/Cav. - Average Surface Temperature of Sub-Floor Facing Floor Cavity UnExp. - Average Temperature on the Unexposed Surface
Time (min) 0 10 20 30 40 50 60 70 80 90 100 110 120 130 140 T e mp e ratu re (° C ) 0 200 400 600 800 1000 Furnace Temp BL/Cav SF/Cav UnExp Time (min) 0 10 20 30 40 50 60 70 80 90 100 110 120 130 140 T e mp e ratu re (° C ) 0 200 400 600 800 1000 Furnace Temp BL/Cav SF/Cav UnExp