Publisher’s version / Version de l'éditeur:
Vous avez des questions? Nous pouvons vous aider. Pour communiquer directement avec un auteur, consultez la
première page de la revue dans laquelle son article a été publié afin de trouver ses coordonnées. Si vous n’arrivez
Questions? Contact the NRC Publications Archive team at
PublicationsArchive-ArchivesPublications@nrc-cnrc.gc.ca. If you wish to email the authors directly, please see the first page of the publication for their contact information.
https://publications-cnrc.canada.ca/fra/droits
L’accès à ce site Web et l’utilisation de son contenu sont assujettis aux conditions présentées dans le site LISEZ CES CONDITIONS ATTENTIVEMENT AVANT D’UTILISER CE SITE WEB.
NACE Northern Area 2003 Conference [Proceedings], pp. 1-26, 2003-09-01
READ THESE TERMS AND CONDITIONS CAREFULLY BEFORE USING THIS WEBSITE.
https://nrc-publications.canada.ca/eng/copyright
NRC Publications Archive Record / Notice des Archives des publications du CNRC :
https://nrc-publications.canada.ca/eng/view/object/?id=e702d8a8-1eb0-4a77-9051-9307bedc4ea7 https://publications-cnrc.canada.ca/fra/voir/objet/?id=e702d8a8-1eb0-4a77-9051-9307bedc4ea7
NRC Publications Archive
Archives des publications du CNRC
This publication could be one of several versions: author’s original, accepted manuscript or the publisher’s version. / La version de cette publication peut être l’une des suivantes : la version prépublication de l’auteur, la version acceptée du manuscrit ou la version de l’éditeur.
Access and use of this website and the material on it are subject to the Terms and Conditions set forth at
Effects of galvanic coupling between carbon steel and stainless steel reinforcements
Effects of galvanic coupling between carbon steel and stainless steel reinforcements
Qu, D.; Qian, S.Y.; Baldock, B.
NRCC-46634
A version of this document is published in / Une version de ce document se trouve dans : NACE Northern Area 2003 Conference, Ottawa, Ontario, Sept. 14-17, 2003,
pp. 1-26
Effects of Galvanic Coupling Between Carbon Steel and
Stainless Steel Reinforcements
Deyu Qu, Shiyuan Qian* and Bruce Baldock Institute for Research in Construction
National Research Council Canada Ottawa, Canada, K1A 0R6
ABSTRACT
The use of stainless steel to replace carbon steel in areas vulnerable to corrosion is an economical approach as it extends the service life of reinforced concrete structures. However, concerns associated with galvanic coupling prevent its application. This paper investigates the galvanic coupling behaviours of carbon steel and stainless steels, and compares them to corroding and passive carbon steels. The polarization curves and cyclic voltammograms of carbon and stainless steels, as well as the galvanic coupling
behaviours of the steels are presented. The results show oxygen reduction on stainless steel is the rate-determining step for galvanic coupling between corroding carbon steel and stainless steel. It is much lower than for passive carbon steel, even when stainless steel is exposed to high concentrations of chlorides. Therefore, the galvanic coupling current is lower than that coupling between corroding and passive carbon steels. The results also show the galvanic coupling current density is very low (about 1 nA cm-2) and will not initiate the corrosion of carbon steel when passive carbon steel is coupled with stainless steel.
Keywords: galvanic coupling, stainless steel, carbon steel, reinforced concrete, chlorides, oxygen reduction reaction
INTRODUCTION
Corrosion of steel reinforcement is the main cause of deterioration of reinforced concrete structures, especially in those areas where de-icing salt is frequently used. With its superior corrosion resistance, stainless steel has been used to avoid or minimize the rises of reinforcement corrosion in many structures in the last 15 years. However, the use
* Corresponding author: Tel: 613-993-3814; Fax: 613-952-8102; E-mail address: shiyuan.qian@nrc-cnrc.gc.ca
of this reinforcement is still limited, because of its high initial cost. Therefore, a potential economical approach is to use stainless steel in areas of the structure where corrosion is most likely under aggressive conditions (e.g., the top reinforcing steel mat of a deck, the lower section of a pier or splash zone). This will extend significantly the service life of concrete structures with only a slight increase in the initial cost. This approach can also be used in the repair of deteriorated reinforced concrete structures. While, there has been considerable interest in this approach, concerns about galvanic corrosion when dissimilar metals contact electrically in concrete structures prevent its application. As a result, engineers are often wary about using stainless steel and carbon steel in the same concrete structure.
Several investigations have been published in the literature, but the results and conclusions are controversial. Bertolini et al., in their series of papers1-3 concluded from their experiments on concrete specimens that the use of stainless steel in connection with carbon steel did not increase the risk of corrosion of passive carbon steel. They state that when both carbon steel and stainless steel are in a passive condition, the galvanic
coupling current does not produce appreciable effects, since these two types of steel have almost identical corrosion potential. Galvanic coupling with stainless steel can increase the corrosion rate of active carbon steel reinforcement in chloride contaminated concrete, but this is no worse than the coupling with passive carbon steel. Knudsen et al.4,5 and Klinghoffer et al.6 suggested that the use of carbon steel with stainless steel do not involve the risk of corrosion for the carbon steel as long as both metals are in a passive condition. Cochrane7 reached a similar conclusion.
Hope concluded in his study8 that high and potentially damaging corrosion rates would develop in galvanically coupled carbon steel and stainless steels 316 or 2205 if the concrete surrounding the carbon steel becomes chloride contaminated or carbonated. These corrosion rates are likely to be similar to, or somewhat less than, the corrosion rates if carbon steel alone was used.
On the other hand, Webster9 addressed this problem and determined that corrosion could take place if two different metals are electrically connected. He also suggested that it would be necessary to isolate the electron transfer path between the anode and cathode to prevent corrosion damage due to galvanic coupling. Seibert pointed out10 that coupling carbon steel and stainless steel reinforcement is not recommended. This galvanic coupling will initiate corrosion on the carbon steel.
This paper investigates the galvanic coupling behaviour between carbon steel (CS) and stainless steels (SSs) 2205, 304LN and 316LN, both in a saturated calcium hydroxide solution [Ca(OH)2] and in concrete specimens. Sodium chloride (NaCl) was
introduced to the solution during the experiment or premixed in the concrete to simulate aggressive environmental conditions in the field. The galvanic coupling currents between corroding CS and SSs were measured and compared to those between corroding CS and passive CS, which always surrounds the corroding area. The percentage changes of corrosion rate on corroding CS as a result of galvanic coupling were calculated. The galvanic behaviour between passive CS and SSs was also studied to examine whether this coupling could initiate the corrosion of CS. The anodic/cathodic behaviours of individual CS and SSs were studied by means of the potential polarization test, cyclic voltammetry.
EXPERIMENT Tests in Electrochemical Cell
CS and SSs (2205, 304LN and 316LN) were used in this study. The samples of steel were machined from reinforcing steel bar to two sizes: a small sample (15 mm in length and 10 mm in diameter) and a large sample (70 mm in length and 12.5 mm in diameter). The samples were screwed to a CS or SS rod, respectively, as the electric conductor. The steel rod was isolated from the solution by a glass tube. The samples were then embedded in epoxy resin leaving a fixed steel surface exposed to the solution. In this study, the surface areas of the small and large electrodes were 0.7 cm2 and 28.6 cm2 respectively. The samples were polished with #600 silicon carbide papers, degreased with acetone and washed with de-ionized water. They were then immersed in saturated
calcium hydroxide [Ca(OH)2] solution with a pH of 12.6 for a week. The corroding CS
samples were prepared by placing them in a humidity room to let the rust accumulate on their surface.
The electrochemical experiments were carried out in a saturated Ca(OH)2 solution
or a saturated Ca(OH)2 + 3% NaCl solution. De-ionized water (≥18.3 MΩ cm2, Milli-Q)
was used to prepare the solution and high purity argon and oxygen were used in some experiments to purge or dissolve the oxygen in the solution.
The electrochemical experiments included the following techniques: cyclic
voltammetry, linear polarization, potential dynamic and galvanic coupling measurements. All tests (except the galvanic coupling experiment) were conducted in three-compartment electrochemical cells. The working electrode was the CS or SS sample. The counter electrode was made of platinum foil or mesh. The reference electrode was a saturated calomel electrode (SCE). In this paper, all the potentials presented are relative to the SCE. A Luggin capillary was used to reduce the potential drop between the reference and
the working electrodes (iR drop). The cyclic voltammetry, linear polarization and potential dynamic measurements were carried out using a Solartron 1480 multistat or solartron SI 1287 electrochemical interface, which was controlled by a PC computer using Corr-Ware software.
Cyclic voltammograms were measured from -1.2 V to +0.5 V with a scan rate of 20 mV sec-1. Potential dynamic tests were measured from the open circuit potential to – 0.65 V (cathodic) and to –0.45 V (anodic) for corroding CS or from the open circuit potential to –0.65 V (cathodic) and to 0.15 V (anodic) for passive CS and SSs. The scan rate is 0.1 mV sec-1.
The linear polarization technique was used to determine the electrochemical polarization resistance (Rp) and the corrosion rate (Icorr) of reinforcing steel in the
electrochemical cell. The potential of the steel electrode was scanned at a slow rate of 0.01 mV s-1. The measurements were initiated at 10 mV below the corrosion potential (Ecorr) and terminated at 10 mV above it, while recording the polarization current (I). The
RP is defined as the slope of a potential-current density plot at the potential of Ecorr. The Icorr
is calculated from the Stern-Geary equation: 11
P corr
R B
I = (1) where B is the Stern-Geary constant that is related to the Tafel slopes for the anodic and cathodic reactions.
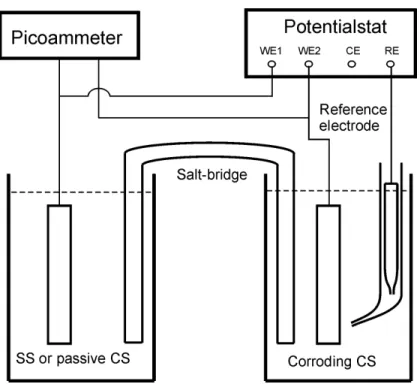
The open circuit potential was recorded before every measurement. Sufficient time was allowed between the measurements to let the steel sample fully depolarize. The galvanic coupling experiments were carried out using a setup of two electrochemical cells connected by a salt bridge as shown in Figure 1. The galvanic coupling current was measured and recorded by coupling the two metals using a Keithley 485 picoammeter started by a PC computer using VEE pro software. The salt bridge was made of a shaped glass tube with an internal diameter of 9.4 mm or 3.1 mm. The two ends of the U-shaped glass tube were sealed with a Celgard 2500 microporous membrane to prevent solution flow and reduce the chloride ion diffusion. The glass tube was filled with saturated Ca(OH)2 solution with or without 3% NaCl depending on the experimental
conditions. For every galvanic coupling experiment, the negative (black) terminal of the picoammeter was connected to the corroding CS when it was coupled with passive CS or SSs, or connected to the passive CS when it was coupled with SSs.
Tests in Concrete Specimens
Galvanic coupling tests were carried out on different pairs of rebars in concrete specimens. The composition of the concrete mixtures and the compressive strength of the cylindrical specimens are listed in Table 1. The specimens were cured for 35 days in 95% ±5% relative humidity (RH) and 22 ± 2oC environment. Two parallel rebars were
embedded in concrete specimens. Different amounts of NaCl (weight of cement as shown in Table 1) were added to the concrete specimens. The different combinations in the specimens are listed in Table 2. Three specimens were made for each combination. In each specimen, two ends of the rebar were coated with epoxy resin and covered by a shrinkable sleeve leaving a length of 15 cm (surface area ≈70.7 cm2) exposed to the
concrete.
The concrete samples were then located in an environmental chamber, in which the RH was kept at 80% and the temperature cycled between 25oC and 45oC, as shown in Figure 2 to accelerate the corrosion process of the rebars. The high temperature was changed from 45oC to 50oC during the stage corresponding to days 220 and 300 to further accelerate the corrosion process. The two rebars in each concrete specimen were
connected by an external wire. The galvanic coupling current between these two rebars was measured by using a Keithley 485 picoammeter. The coupling potential was measured using a Keithley 617 multimeter and a copper/copper sulfate (Cu/CuSO4)
reference electrode (converted relative to SCE). Both measurements were carried out on a weekly basis with an average of three samples being plotted.
RESULTS AND DISCUSSION Galvanic Coupling Current Density
Galvanic corrosion occurs when two (or more) dissimilar metals are electrically connected and exposed to an electrolyte solution. The potential difference between these two metals is the driving force of the galvanic corrosion cell. The two metals, after connection, are forced to shift to a common potential (as shown in Figure 3). The metal with more negative potential (corroding CS) is subjected to an oxidation process (anodic process), since it is polarized toward the positive direction. The more noble metal (SS) with more positive potential is polarized to the negative direction and subjected to a reduction (cathodic) process. The electrons transfer from the active metal (anode) to the noble one (cathode). The potentials and corresponding coupling current are shown in
Figure 3. The current shifts towards a stable value after an initial large current spike, to charge the double layer of the electrode. This stable current is the measured galvanic coupling current density (Igc) which is also the cathodic current density on SS and limited
by its cathodic process. It compensates partially (40%) for the decrease in the cathodic current and contributes partially (60%) to the increase of the corrosion current, ∆Icorr, on
the corroding CS based on the experimental results showing that the Tafel slopes of anodic and cathodic polarization on corroding CS are 40 mV and 60 mV, respectively.
To calculate the percentage increase of the corrosion current brought by galvanic coupling, a comparison between the increase in the corrosion current density, ∆Icorr, and
Icorr must be made. If ∆Icorr is within a few percentage of Icorr, the galvanic corrosion can
be considered insignificant. It is important to note that ∆Icorr from the coupling between
corroding CS and SS should be compared with that from the coupling between corroding CS and passive CS, since the later situation always exists in concrete structures. If the galvanic current between corroding CS and SS is smaller than the later one, then the use of SS, which electrically contacts with CS in a concrete structure is safe and no harmful galvanic corrosion problem will be introduced.
The galvanic coupling current densities, Igc, were measured by connecting
corroding CS with passive CS or SSs (2205, 304LN and 316LN) as shown in Figure 5. The currents gradually approach a stable value after the initial pulse. It is clearly shown that the galvanic coupling current between corroding CS and SS is less than half of that between the corroding CS and the passive CS.
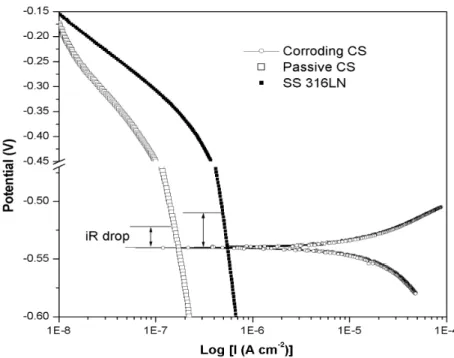
Igc can also be deduced from the polarization curves of the two electrodes. Figure
5 shows that the cathodic polarization curve of SS 316LN intersects with the anodic polarization curve of the corroding CS. If the iR drop effect (the potential drop in the salt bridge) is not considered, the intersection point provides the galvanic coupling potential (≅ Ecorr of corroding CS) and the corresponding Igc. Actually, the galvanic coupling
potential at the cathode is more positive than this intersection point if the iR drop is corrected. Then the coupling potential is approximately equal to Ecorr – iR. The Igc
calculated from the corroding CS (at the corrosion potential, Ecorr , –0.55 V and –0.6 V)
coupled with various SSs or passive CS and their values obtained from the direct galvanic coupling measurement are listed in Table 3. It is shown that Igc increases when Ecorr shifts
to more negative values (from –0.55 V to –0.6 V). For each corrosion potential, the second data column is Igc calculated without an iR drop correction, and the third data
column is Igc after the iR correction. It is shown that the difference in the Igc values
when Igc increases. However, after the iR drop correction, the Igc values become very
close to the measured values.
The corrosion rate of the corroding CS was measured using a linear polarization technique. The average rate was 13.0 ±0.4 µA cm-2. The percentage increases of I
gc
between the corroding CS and passive CS or SSs over the corrosion current density of corroding CS are listed in Table 4. As mentioned earlier ∆Icorr is about 60% of Igc.
Therefore, the corrosion rate increase is about 2.2% due to the galvanic coupling between corroding CS and passive CS and it is only 1.0% due to the galvanic coupling between the corroding CS and SSs. It is clearly shown that the galvanic coupling effect introduced by SS is smaller than with passive CS and may be considered insignificant.
Effect of Oxygen on Cathodic Reduction Current
The cyclic voltammograms of passive CS and SSs 2205, 304LN and 316 LN were measured in the saturated Ca(OH)2 solution as shown in Figure 6. The cathodic and
anodic current densities on all SSs are significantly smaller than on passive CS. The corrosion potential of the corroding CS is around –0.55 V to –0.6 V. Therefore, the potential of galvanic coupling of corroding CS with passive CS or SSs should be in this potential range, and the reactions on passive CS or SSs are cathodic. From the inset of Figure 6, it can be clearly seen that the cathodic reduction current densities of all SSs are much smaller than on the passive CS in this potential range. Usually, the oxygen
dissolved in the solution needs to be adsorbed on the metal surface and then reduced under cathodic overpotential region. Obviously, the surface of SS does not favour the process of oxygen adsorption and reduction.
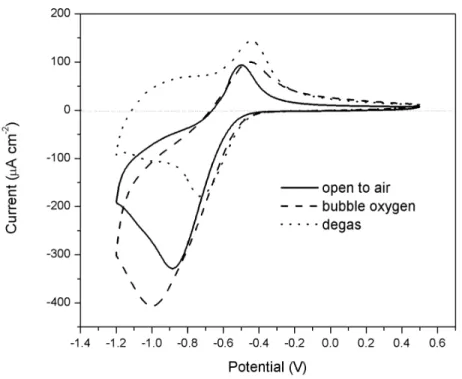
The effect of dissolved oxygen on the cathodic reduction current density was investigated. First, a cyclic voltammogram of passive CS was measured in the cell open to the air. Then oxygen was bubbled into the cell to saturate the electrolyte solution, and another cyclic voltammogram was measured. After that, the solution in the cell was degassed by bubbling argon into the cell to remove the dissolved oxygen. The cyclic voltammogram was measured again. The cyclic voltammograms measured under these three conditions are shown in Figure 7. The cathodic current peak had the smallest peak with the value of -180 µA cm-2 at –0.72 V when oxygen was purged from the solution.
The charges for the cathodic and anodic scans are almost equal indicating that both reactions are mainly for the electrode surface oxidation and reduction. When the
concentration of oxygen in the solution was increased (cell open to the air), the cathodic current peak increased to the value of –330 µA cm-2 at –0.87 V. When the electrolyte
solution was saturated with oxygen, the cathodic current peak increased to the largest value of –400 µA cm-2 at –1.0 V indicating that a significant oxygen reduction reaction
was involved.
In the potential region between –0.4 V and –0.72 V, the effect of oxygen concentration on the cathodic reaction was not observed, because the reduction of the oxidized metal surface dominated the reaction. The slight increase in the reduction currents under the conditions of bubbling oxygen and argon is probably caused by the increase in the diffusion process due to bubbling gas through the solution. In the anodic scan (from –1.2 V to –0.4 V), the current shifts to more negative values when open to air and bubbling oxygen, because of the process of continuing oxygen reduction. The current increase in the more positive region (–0.4 V to +0.5 V) is due to the bubbling effect causing the increase in the diffusion process.
Figure 8 shows the cathodic polarization curves of the passive CS and the SSs. The cathodic currents on SSs are all much smaller than on passive CS in the region of –0.5 V to –0.6 V. As described above, Igc is limited by the cathodic reduction reaction on
the passive CS or SSs when the corroding CS is coupled with them. Therefore Igc induced
by SS is much smaller than that induced by the passive CS when these metals are coupled with corroding CS.
Effect of Resistance
As Table 3 indicates, the current difference between the value measured from the galvanic coupling experiment and the value calculated from the polarization curves is more significant when the galvanic coupling current is relatively larger, such as for passive CS. This is because of the effect of a potential drop in the salt bridge. This is more significant when the resistance of the salt bridge becomes large. The galvanic coupling potential applied to the SS would shift to a more positive value (see Figure 5) leading to a decrease in Igc.
Table 5 shows the change in the values of Igc with the resistance of the salt bridge
measured by galvanic coupling experiments in an electrochemical cell. When the resistance of the salt bridge increases from 0.9 KΩ to 33.0 KΩ, Igc decreases from 0.44
µA cm-2 to 0.18 µA cm-2 for the coupling between passive and corroding CSs and from 0.20 µA cm-2 to 0.05 µA cm-2 for the coupling between SS 316LN and corroding CS, respectively. It is clearly shown that Igc decreases with the increase in resistance of the
salt bridge. It is important to notice that Igc induced by SS 316LN is always much smaller
(also shown in Figure 5). The resistance changes from 0.9 KΩ to 33.0 KΩ cover a wide change in the concrete resistivity and correspond to a wide range in the rebar corrosion rate (from low to high).12 Therefore, Igc changes with an increase in resistance in the salt
bridge have practical significance for simulating the resistivity change in the concrete. Galvanic Coupling Between Passive Carbon Steel and Stainless Steel
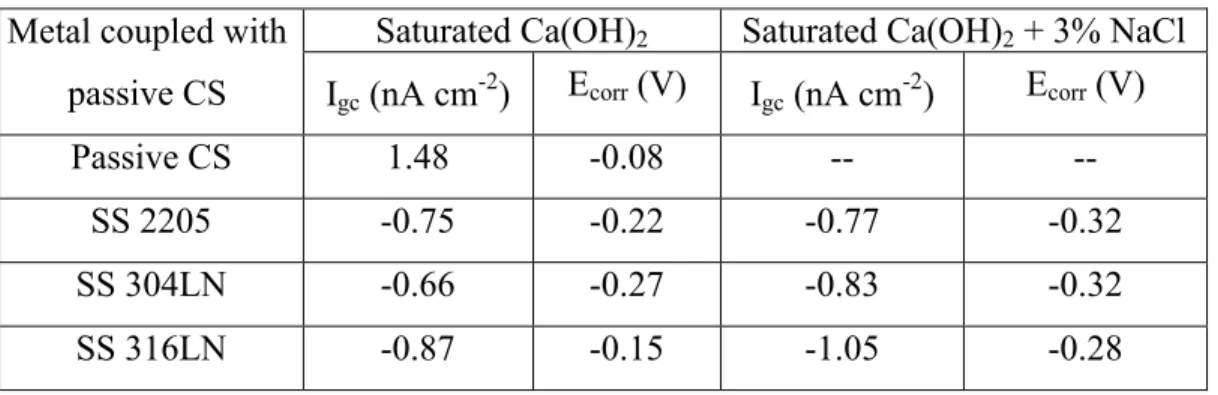
CS and SS are both in the passive condition when they are cast into concrete, due to its high alkalinity. Therefore, the open circuit potentials at these metals are quite similar and can be polarized with relatively large potential without initiating corrosion on CS. The open circuit potential and galvanic coupling experiments were carried out in saturated Ca(OH)2 solution in the absence of NaCl as shown in the first two data columns
in Table 6. The open circuit potentials were very close with –0.08 V for passive CS and – 0.15 V to –0.27 V for SSs. Therefore Igc between two passive CSs is around 1.48 nA cm2
while Igc values between passive CS and SSs are all below 1 nA cm2.
When the CS reinforcement is substituted with SS in critical areas, SS is very likely surrounded by a high concentration of chlorides. This was tested by adding 3% NaCl to the solution in the SS side. (The results are shown in the second two data
columns in Table 6.) It was found that the open circuit potentials shifted slightly to more negative values, and the values of Igc increased slightly, but still remained very low (at
around 1 nA cm-2), even though SSs were exposed to chloride ions. It is important to note that these values are smaller than Igc introduced by coupling two passive CS electrodes.
A value of 10 nA cm-2 is considered as the long-term maintenance-free current density13,14 for the CS (i.e., the current density below this value is safe and will not induce or initiate corrosion on the CS reinforcement). Measurement of current density by holding the potential at +0.35 V (passive region) on a passive CS showed residual current densities of 12 nA cm-2 and 16 nA cm-2 for the de-aerated and the aerated conditions, respectively. This residual current is called the passivation-maintenance current 15 and is only for maintaining the equilibrium of surface passive condition at this potential. Igc
values obtained from coupling passive CS with SSs are all much lower indicating that this coupling will not initiate the corrosion on passive CS and is safe to use SS partially to replace the CS in the critical areas, when the ingress of high chlorides will be easy. Since Igc is very small (about 1 nA cm-2), the measured readings were influenced by
noise. A negative sign was obtained on Igc, after taking the average of the readings,
indicating that the electrons were transferred from SS (anode) to passive CS (cathode) in most cases. This is because the corrosion potential of passive CS is slightly more positive
than that of SS. The values of Igc and Ecorr on passive CS cannot be measured in 3% NaCl
solution, because the passive CS quickly became active when the electrode was immersed in this salt solution under the condition of open-circuit potential.r. Galvanic Coupling Test in Concrete Specimens
The galvanic behaviour of CS coupled with passive CS or SSs in concrete specimens in the presence or absence of chlorides was investigated. The concrete specimens were kept in an environmental chamber with temperatures cycling between 25oC and 45oC (or 50oC) to accelerate the corrosion process. The experimental results are presented and discussed in the following sections.
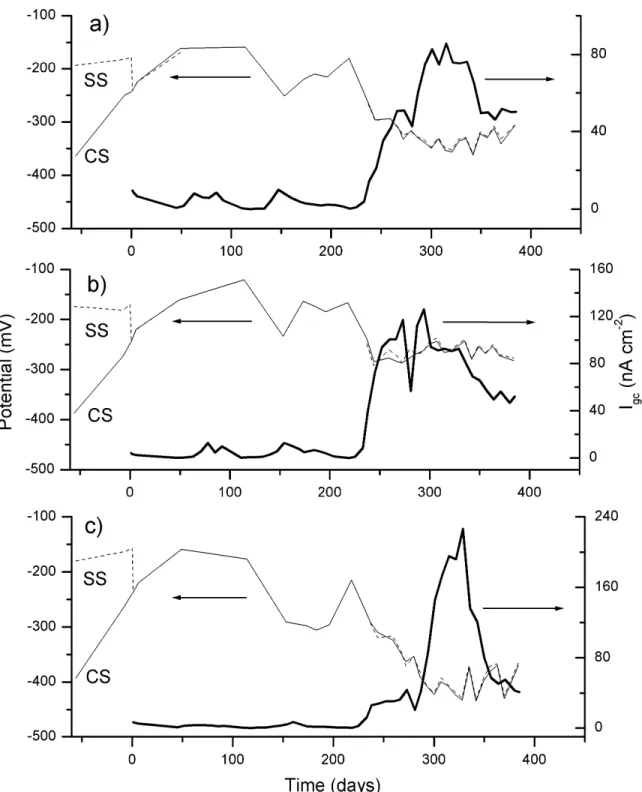
Active CS coupled with passive CS or SSs. Figures 9 and 10 show the corrosion potential and Igc of active CS coupled with SSs in the presence or absence of 3.5%
chloride ions. In both cases, the CS was cast in the concrete containing 1.5% chloride ions. SSs were embedded in chloride-free (Figure 9) concrete or concrete containing 3.5% chloride ions (Figure 10). Before coupling two rebars, the open circuit potential of CS was more negative than that of the SSs. Since CS was in the concrete containing 1.5% chloride ions, it was very likely in a corrosion-active condition due to the attack of
chloride ions. (Corrosion potentials were almost all less than –0.35 V before the coupling.) After the two rebars were connected, the coupling potential varied around – 0.15 V over 220 days (Figure 9). In this time, the galvanic coupling current densities were relatively low (around a few nA cm-1) indicating no considerable galvanic coupling current, even though CS was in the concrete containing chloride ions. After 220 days, the high temperature was changed from 45oC to 50oC. The coupling potential shifted to more negative values to around –0.25 V to –0.35 V, and Igc was dramatically increased to
around 150 nA cm-2 for SS 2205 and 75 nA cm-2 forSSs 304LN and 316LN (with some delay for SS 304LN). The values of Igc decreased gradually to around 30 nA cm-2, 26 nA
cm-2 and 15 nA cm-2 for SS 2205, 304LN and 316LN respectively at around day 380. This was probably due to the formation of cracks in the concrete near the corroding CS rebars.
When SS was surrounded by 3.5% chloride ions (as shown in Figure 10), the change in coupling potential with time was similar to that shown in Figure 9. After being coupled for about 220 days, the coupling potential began to drop to < –0.3 V, and Igc
increased from 5 nA cm-2 to 80 nA cm-2, 120 nA cm-2 and 200 nA cm-2 for SSs 2205, 304LN and 316LN, respectively. Then Igc was gradually decreased to around 40 nA cm-2.
chloride-free condition. This may have been caused by two factors: the effect of chlorides on the cathodic reduction reaction on SS or the reduced resistance due to the presence of 3.5% chloride ions in the specimen sides in which SSs were embedded.
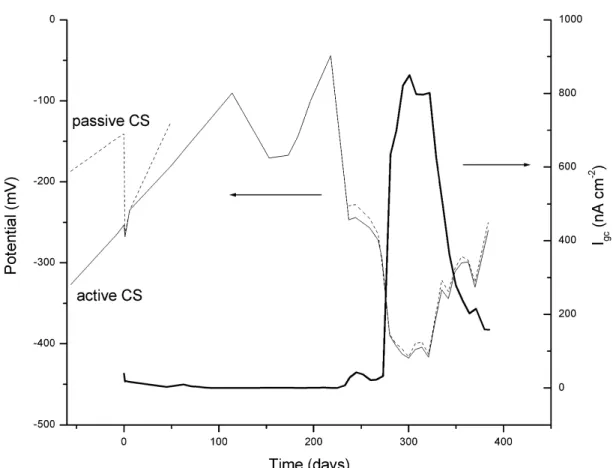
The galvanic coupling potential and Igc measured from the active CS coupled with
the passive CS is shown in Figure 11. Two CSs were embedded in concrete specimens: one in chloride-free concrete and the other in concrete containing 1.5% chloride ions. In the first 220 days, the coupling potential varied at around –0.15 V, and the coupling current remained very low (< 10 nA cm-2). After 275 days, the coupling potential dropped
to –0.4 V and the coupling current increased rapidly to 800 nA cm-2, then decreased to about 150 nA cm-2, due to concrete cracking near the rebars.
It was shown clearly that Igc between active and passive CSs was higher than
between active CS and SS, even when the SS was in concrete containing 3.5% chloride ions. This result is in good agreement with that obtained in the saturated Ca(OH)2
solution in the electrochemical cell. This proves that in SS reinforcing bars coupled with corroding CS bars, Igc is much lower (less than 200 nA cm-2) than in a coupling between
passive and active CS reinforcing bars (about 800 nA cm-2). Therefore, using SS to replace CS reinforcement in critical areas would not introduce the risk of corrosion to the CS reinforcement.
It was also found that, unlike the measurement in the electrochemical cell, the galvanic coupling current in the concrete did not reach its stable value shortly after the coupling. It kept a very small current value over more than 200 days and then increased, because the CS used as an active electrode in the electrochemical cell was already substantially corroded, and its corrosion potential was stable at around –0.55 V to –0.60 V. When this electrode was coupled with passive CS or SS, the observed galvanic coupling behavior was determined by the cathodic reduction reaction on passive CS or SS. The CS used in the concrete specimens was corrosion free before it was cast in the specimens. During the first 200 days, the corrosion gradually developed on the CS when exposed to 1.5% chloride ions in concrete. In this time, the measured coupling current was limited by the slow anodic oxidation process on the CS due to its passive film.
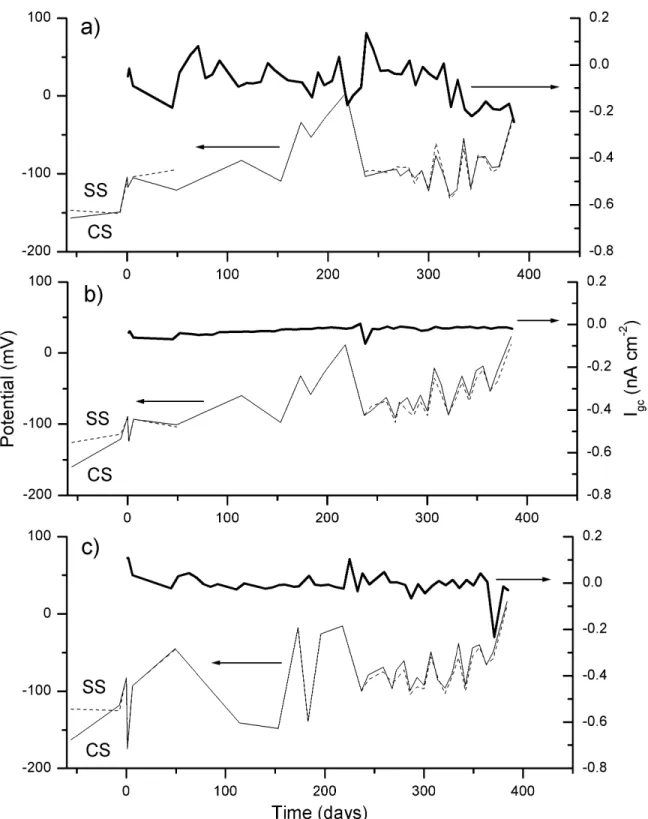
Passive CS coupled with SS. Figures 12 and 13 show the corrosion potentials and Igc on specimens in which the passive CS was coupled with different types of SSs.
CS was in chloride-free concrete while the SSs were in either chloride-free concrete (Figure 12) or concrete containing 3.5% chloride ions (Figure 13). It can be seen that the corrosion potentials of CS and SSs were very close (between –0.12 and –0.16 V) before the galvanic coupling (Figure 12), since the CS and SSs were all in the passive condition.
After the galvanic coupling of two rebars in the specimen, the potential varied in the passive region (around –0.1 V). Igc also remained low and quite stable in the range of
±0.25 nA cm-2 for all three types of SS.
Figure 13 shows similar results even though the SSs were in concrete containing 3.5% chloride ions. The corrosion potential of CS and SSs were between –0.15 V and –0.2 V before the galvanic coupling and varied at around –0.15 V after the galvanic coupling. Igc was smaller than 0.5 nA cm-2 for all three types of SSs. These coupling
currents were slightly higher than those obtained in chloride-free concrete (Figure 12) probably caused by either the increase in the cathodic reduction current on SS or the concrete conductivity due to the presence of 3.5% chloride ions in the SS embedded side of the specimens.
The results obtained from the concrete specimens are in very good agreement with those found in the electrochemical cell. When CS rebar is in a passive condition, coupling these CS rebars with SS rebars in concrete will not initiate the corrosion on passive CS with Igc less than 1 nA cm-2, even when the SS is exposed to 3.5% chloride
ions in concrete. The results for the two CS rebars embedded in chloride-free concrete are shown in Figure 14. When both CS rebars are in a passive condition, there was no sign of corrosion. The corrosion potential remained at around –0.1 V and the Igc less than 0.2 nA
cm-2.
The results show clearly that, when only CS rebars were used in the concrete without chloride ions, the CS rebars stayed in a passive condition, and could last a long time. However, the rebars corrode very easily when chloride ions reach the CS
reinforcing steel. When SS rebars are used to replace CS rebars in concrete containing high chloride ions, the SS reinforcement can provide much longer service life due to its high chloride corrosion resistance. The value of Igc (<0.5 nA cm-2) induced by coupling
SS with passive CS would not initiate the corrosion on the CS reinforcement in chloride-free concrete.
CONCLUSIONS
The control step of the galvanic coupling process is the cathodic reduction reaction on passive CS or SSs when these metals are coupled with a corroding CS in a saturated Ca(OH)2 solution. The cathodic reduction current on SS is less than a half of
that on passive CS, leading to a smaller Igc induced by SS than the passive CS.
The corrosion rate increase on corroding CS is about 2.2% due to the galvanic coupling between corroding CS and passive CS and only 1.0% due to the coupling
between corroding CS and SSs based on the experiments carried out in the saturated Ca(OH)2 solution. Therefore, the galvanic coupling effect induced by SS is less than that
induced by passive CS.
Galvanic coupling tests between passive CS and SSs show that Igc was around 1
nA cm-2 for all three type of SSs. This is well below the long-term maintenance-free current density for CS even when SSs were in the solution containing 3% chloride ions. Therefore, the galvanic coupling of passive CS and SSs will not initiate corrosion on passive CS.
The galvanic coupling tests carried out in the concrete specimens confirmed the laboratory experimental results. When SS reinforcing bars were coupled with corroding CS bars, Igc was smaller than in a coupling between passive and corroding CS
reinforcements. When SS reinforcing bars were coupled with passive CS bars, the value of Igc induced by SS was smaller than that by passive CS (passive CS coupled with
passive CS). It would not initiate the corrosion of the CS reinforcement in chloride-free concrete.
It is safe to use SS and CS reinforcing bars in concrete structures even when these bars make contact electrically. The increase in the corrosion rate for the corroding CS due to galvanic coupling with SS is significantly lower than the increase brought about by coupling with passive CS. Therefore, partially substituting CS with SS in the critical areas of a reinforced concrete structure is a safe and economical approach. Its ability to resist chloride-induced corrosion can extend significantly the service life of concrete structures exposed to chlorides.
ACKNOWLEDGEMENTS
Grateful acknowledgement is made to the partners for their contributions to the project: the Alberta Transportation, City of Ottawa, the Ministry of Transportation of Quebec, Nickel Development Institute, Valbruna Canada Ltd. Thanks are also due to Glendon Pye and Bob Myers for their help with the experimental preparation.
REFERENCES
1. Bertolini, L., Gastaldi, M., Pastore, T., Pedeferri, M.P., Pedeferri, P., “Effects of Galvanic Coupling between Carbon Steel and Stainless Steel Reinforcement in Concrete”, International Conference on Corrosion and Rehabilitation of Reinforced Concrete Structures, Orlando, Florida, 1998.
2. Bertolini, L., Gastaldi, M., Pastore, T., Pedeferri, M.P., “ Effect of Chemical Composition on Corrosion Behaviour of Stainless Steel in Chloride Contamination and Carbonated Concrete”, Proceedings of 3rd European Congress Stainless Steel '99 Vol.3 "Properties and Perforcement", Chia Laguna, AIM, 1999.
3. Bertolini, L., Pedeferri, P., “Laboratory and Field Experience on the Use of Stainless Steel to Improve Durability of Reinforced Concrete”, Corrosion Review, 2002, 20, p. 129.
4. Knudsen, A., Jensen, F.M., Klinghoffer, O., Skovsgaard, T., “Cost-effective Enhancement of Durability of Concrete Structures by Intelligent Use of Stainless Steel Reinforcement”, International Conference on Corrosion and Rehabilitation of Reinforced Concrete Structures, Orlando, Florida, 1998.
5. Knudsen, A., Skovsgaard, T., “Stainless steel reinforcement”, Concrete Engineering, 2001, 5(3), p. 59.
6. Klinghoffer, O., Frolund, T., Kofoed, B., Knudsen, A., Jensen, F.M., Skovsgaard, T., “Practical and Economic Aspects of Application of Austenitic Stainless Steel, AISI 316, as Reinforcement in Concrete”, Corrosion of reinforcement in concrete:
corrosion mechanisms and corrosion protection, Ed. Mietz, J., Polder, R., Elsener, B., London, 2000.
7. Cochrane, D.J., “Efficient Use of Stainless Steel Reinforcement for Bridge
Structure”, Infrastructure Regeneration and Rehabilitation Improving the Quality of Life Through Better Construction: A Vision for the Next Millennium, Ed. Swamy, R.N. Sheffield Academic Press, Sheffield, 1999.
8. Hope, B., “Some corrosion aspects of stainless steel reinforcement in concrete”, Final report of MTO special project Q900076, ISBN 0-7794-0479-3, MI-181, Feb. 2001. 9. Webster, H.A. “A Discussion on Cell Action as It Refers to Steels in Concrete”,
COR-97-7810-N, CORRENG Consulting Service Inc., Downsview, Ontario, 1997. 10. Seibert, P.J., “Galvanic Corrosion Aspects of Stainless and Black Steel
Reinforcement in Concrete”, M.Sc Thesis, Queen's University, 1998.
11. EG & G Princeton Applied Research Application Note – 140 “Linear Polarization” and Note – 148 “Tafel Plot”.
12. Langford, P., Broomfield, J., “Monitoring the corrosion of reinforcing steel”, Construction Repair, 1, No.2, Palladian Pubs., May 1987, pp. 32-36.
13. Clear, K.C., “Effectiveness of Epoxy-Coated Reinforcement Steel”, Concrete International 1992, May, p. 58.
14. Erodgdu, S., Bremner, T.W., “Field and Laboratory Testing of Epoxy-Coated Reinforcement Bars in Concrete”, Transportation Research Circular, 1993, 403, pp. 5-16.
15. Qian S.Y., Dumont H., Conway B.E., “Passivation and depassivation of Monel electrodes in KF.2HF melts in comparison with the behaviour of nickel”, J. Applied Electrochemistry, 27 (1997) pp. 1245-1253.
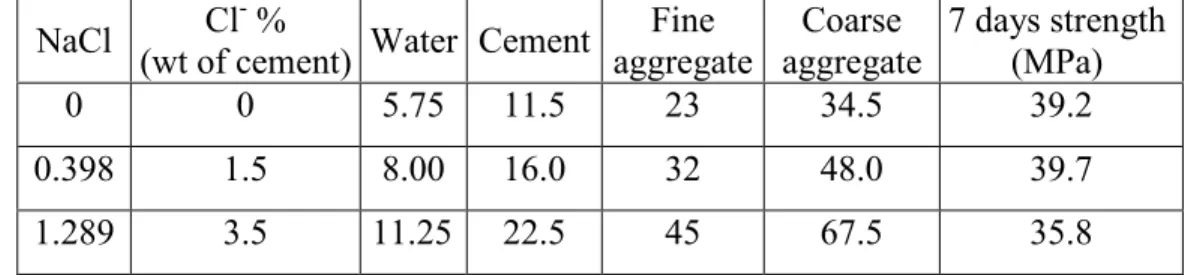
Table 1. Composition of concrete specimens (kg) for the galvanic coupling tests
NaCl Cl
- %
(wt of cement) Water Cement
Fine aggregate Coarse aggregate 7 days strength (MPa) 0 0 5.75 11.5 23 34.5 39.2 0.398 1.5 8.00 16.0 32 48.0 39.7 1.289 3.5 11.25 22.5 45 67.5 35.8
Table 2. Embedded rebars and chloride concentrations in concrete specimens Left side of specimens Right side of specimens
Chloride content (%) Metal Chloride content (%) Metal
0 CS 0 SSs* 0 CS 3.5 SSs* 0 CS 0 CS 1.5 CS 0 SSs* 1.5 CS 3.5 SSs* 1.5 CS 0 CS
Note: * Includes SSs 2205, 304LN and 316LN.
Table 3. Measured and calculated Igc (µA cm-2) values for
various metals coupled with corroding CS
Igc at Ecorr = -0.55 V Igc at Ecorr = -0.6 V
Metal
Measured Cal.(Ecorr) Cal.(Ecorr -iR) Measured Cal.(Ecorr) Cal.(Ecorr -iR)
Passive CS 0.44 0.52 0.48 0.53 0.70 0.59
SS 2205 0.20 0.22 0.21 0.22 0.30 0.26
SS 304LN 0.20 0.20 0.20 0.23 0.26 0.24
Table 4. Relationship between Igc and Icorr of corroding CS
Metals Igc/Icorr (%) ∆Icorr/Icorr (%)
Passive CS 3.7 2.2
SS 2205 1.7 1.0
SS 304LN 1.7 1.0
SS 316LN 1.7 1.0
Note: Igc is the average measured value.
Table 5. Igc (µA cm-2) measured by galvanic coupling experiments in an
electrochemical cell with various resistances of the salt bridge Resistance of salt bridge (KΩ) 0.9 2.3 33.0 Passive CS coupled with corroding CS 0.44 0.32 0.18 SS 316LN coupled with corroding CS 0.20 0.18 0.05
Table 6. Corrosion (open circuit) potentials and Igc between the passive CS and SSs in
saturated Ca(OH)2 solutions with and without 3% NaCl
Saturated Ca(OH)2 Saturated Ca(OH)2 + 3% NaCl
Metal coupled with
passive CS Igc (nA cm-2) Ecorr (V) Igc (nA cm-2) Ecorr (V)
Passive CS 1.48 -0.08 --
--SS 2205 -0.75 -0.22 -0.77 -0.32
SS 304LN -0.66 -0.27 -0.83 -0.32
Figure 1. Galvanic coupling measurement set-up.
Figure 3. Potential and current profile in galvanic coupling process.
Figure 4. Curves of Igc obtained by coupling corroding CS with passive CS or SSs 2205,
Figure 5. Polarization curves of corroding CS, passive CS and SS 316LN measured in a saturated Ca(OH)2 solution.
Figure6. Cyclic voltammograms of passive CS and SS measured in a saturated Ca(OH)2
Figure 7. Cyclic voltammograms of passive CS under various oxygen conditions.
Figure 8. Cathodic polarization curves of passive CS and SS measured in a saturated Ca(OH)2 solution.
Figure 9. Galvanic coupling potentials and current densities measured in concrete specimens coupled by CS in 1.5% Cl- with SSs in a chloride free environment: a) 2205; b) 304LN; c) 316LN.
Figure 10. Galvanic coupling potentials and current densities measured in concrete specimens coupled by CS in 1.5% Cl- with SSs in 3.5% Cl-: a) 2205; b) 304LN; c) 316LN.
Figure 11. Galvanic coupling potentials and current densities measured in concrete specimens coupled by CS in 1.5% Cl- with passive CS in chloride free environment.
Figure 12. Galvanic coupling potentials and current densities measured in concrete specimens coupled by passive CS with SSs in chloride free environment: a) 2205; b) 304LN; c) 316LN.
Figure 13. Galvanic coupling potentials and current densities measured in concrete specimens coupled by passive CS in chloride free environment with SSs in 3.5% Cl-: a) 2205; b) 304LN; c) 316LN.
Figure 14. Galvanic coupling potentials and current densities measured in concrete specimens coupled by passive CS with passive CS in chloride free environment.