HAL Id: hal-03110566
https://hal.sorbonne-universite.fr/hal-03110566
Preprint submitted on 14 Jan 2021HAL is a multi-disciplinary open access
archive for the deposit and dissemination of sci-entific research documents, whether they are pub-lished or not. The documents may come from teaching and research institutions in France or abroad, or from public or private research centers.
L’archive ouverte pluridisciplinaire HAL, est destinée au dépôt et à la diffusion de documents scientifiques de niveau recherche, publiés ou non, émanant des établissements d’enseignement et de recherche français ou étrangers, des laboratoires publics ou privés.
Distributed under a Creative Commons Attribution| 4.0 International License
Jean Mariani, Ryuichi Shigemoto, David Digregorio, Rachel Sherrard,
Laurence Cathala
To cite this version:
Célia Biane, Florian Rückerl, Therese Abrahamsson, Cécile Saint-Cloment, Jean Mariani, et al.. De-velopmental emergence of two-stage nonlinear synaptic integration in cerebellar interneurons. 2021. �hal-03110566�
1 1
Developmental emergence of two-stage nonlinear synaptic integration in
2cerebellar interneurons
3 4 5 6Abbreviated title: Development of neuronal computation in interneurons 7
8 9
Célia Biane 1, Florian Rückerl 3, Therese Abrahamsson 3,Cécile Saint-Cloment 3, Jean 10
Mariani 1, Ryuichi Shigemoto 4,, David A. DiGregorio 3 Rachel M. Sherrard 1 and Laurence 11
Cathala 1,2* 12
1 Sorbonne Université et CNRS UMR 8256, Adaptation Biologique et Vieillissement 9 Quai
13
St Bernard, 75005 Paris, France 14
2 Paris Brain Institute, CNRS UMR 7225 - Inserm U1127 – Sorbonne UniversitéGroupe
15
Hospitalier Pitié Salpêtrière 47 Boulevard de l'Hôpital 75013 Paris France 16
3 Department of Neuroscience, Institut Pasteur, 25 rue du Dr Roux, 75724 Paris Cedex 15, 17
France; CNRS URA 21821 18
4 Institute of Science and Technology Austria, Am Campus 1, 3400 Klosterneuburg, Austria 19
20
*Corresponding author: Laurence Cathala ([email protected]) 21
22
Celia Biane : [email protected] 23
Florian Rückerl : [email protected] 24
Therese Abrahamsson: [email protected] 25
Cécile Saint-Cloment : [email protected] 26
David DiGregorio : [email protected] 27
Ryuichi Shigemoto: [email protected] 28
Rachel Sherrard : [email protected] 29
Jean Mariani : [email protected] 30
31 32
2 Abstract
33 34
Synaptic transmission, connectivity, and dendritic morphology mature in parallel during brain 35
development and are often disrupted in neurodevelopmental disorders. Yet how these changes 36
influence the neuronal computations necessary for normal brain function are not well 37
understood. To identify cellular mechanisms underlying the maturation of synaptic 38
integration in interneurons, we combined patch-clamp recordings of excitatory inputs in 39
cerebellar stellate cells (SCs), 3D-reconstruction of SC morphology with excitatory synapse 40
location, and biophysical modeling. We found that, during development, synaptic strength 41
was homogeneously reduced along the somato-dendritic axis, but that dendritic integration 42
was always sublinear. However, dendritic branching increased without changes in synapse 43
density, leading to a substantial gain in distal inputs. Thus, changes in synapse distribution, 44
rather than dendrite cable properties, are the dominant mechanism underlying the maturation 45
of neuronal computation. These mechanisms favor the emergence of a spatially 46
compartmentalized two-stage integration model promoting location-dependent integration 47
within dendritic subunits. 48
49 50
3 Introduction
51 52
Dendritic integration of spatio-temporal synaptic activity is fundamental to neuronal 53
computation, which shapes the transformation of input activity into output spiking (Silver, 54
2010). In particular, the cable properties of dendritic trees generate isolated electrical 55
compartments that produce non-linear integration of synaptic potentials. These compartments 56
increase the computational power of single neurons (Caze et al., 2013; Poirazi and Mel, 57
2001) and are a prominent feature of human neurons (Beaulieu-Laroche et al., 2018; Gidon et 58
al., 2020). Dendritic morphology and ion channel expression are developmentally regulated, 59
but how they contribute to the maturation of neuronal computations throughout post-natal 60
circuit formation and refinement is less well known. The observation of alterations in 61
dendritic morphology, synaptic connectivity, density, and function in several 62
neurodevelopmental disorders (Marín, 2016; Penzes et al., 2011) indicates that both 63
appropriate neuronal wiring and the maturation of a neuron’s integrative properties are 64
necessary to develop fully functional neuronal networks (Pelkey et al., 2015). 65
66
The type and number of computations that a neuron can perform depend on the diversity of 67
the mathematical operations used to combine synaptic inputs within dendritic trees. These 68
can be sublinear, linear, or supralinear (Branco and Häusser, 2011; Caze et al., 2013; Poirazi 69
and Mel, 2001; Tran-Van-Minh et al., 2015; Vervaeke et al., 2012). Nonlinear dendritic 70
operations depend on (1) dendritic architecture and associated membrane properties 71
(Abrahamsson et al., 2012; Hu et al., 2010; Katz et al., 2009; Larkum et al., 2009; Magee, 72
1999, 2000; Nevian et al., 2007; Rall, 1967), (2) spatial localization, density, and properties 73
of synapses across the dendritic arbor (Grillo et al., 2018; Larkum et al., 2009; Losonczy et 74
al., 2008; Losonczy and Magee, 2006; Menon et al., 2013; Schiller et al., 2000; Williams and 75
Stuart, 2002) and (3) the spatiotemporal synaptic activity pattern (Bloss et al., 2018; Grillo et 76
al., 2018; McBride et al., 2008; Scholl et al., 2017; Xu et al., 2012). All these factors change 77
during neuronal circuit maturation through cell-autonomous or activity-dependent processes 78
(Sigler et al., 2017) (Katz and Shatz, 1996). Indeed the maturation of neuronal excitability 79
and morphology (Cathala et al., 2003; Cline, 2016; McCormick and Prince, 1987; Zhang, 80
2004) is associated with restriction of neuronal connectivity to subcellular compartments 81
(Ango et al., 2004), activity-dependent synaptic rearrangement (Chen and Regehr, 2000; 82
Cline, 2016; Kwon and Sabatini, 2011; Li et al., 2011) and the maturation of excitatory 83
(Cathala et al., 2003; Hestrin, 1992; Koike-Tani et al., 2005; Lawrence and Trussell, 2000; 84
Taschenberger and von Gersdorff, 2000) and inhibitory synaptic inputs (Ben-Ari, 2002; 85
Sanes, 1993; Tia et al., 1996). Despite this knowledge, how developmental changes in 86
cellular parameters dictate dendritic operations and their associated neuronal computations, 87
remains largely unexplored. 88
4 89
Interneurons are fundamental to normal circuit function throughout development. They 90
contribute to the developmental regulation of critical periods (Hensch et al., 1998; Gu et al., 91
2017), are important for establishing direction selectivity in the retina (Wei et al., 2011), and 92
their dysfunction is associated with neurodevelopment disorders (Akerman and Cline, 2007; 93
Le Magueresse, 2013; Marin, 2016). Parvalbumin-positive (PV+) GABAergic interneurons 94
are found in the neocortex, hippocampus, and cerebellum, and all share anatomical and 95
functional features (Hu et al., 2014). These inhibitory interneurons provide precise temporal 96
control of the excitatory drive onto principal neurons (Mittmann et al., 2005; Pouille and 97
Scanziani, 2001). Cerebellar stellate cells (SCs) are PV+ and receive excitatory inputs from 98
granule cells, and in turn modulate the excitability and firing precision of the cerebellar 99
output neurons, Purkinje cells (Arlt and Häusser, 2020; Häusser and Clark, 1997; Mittmann 100
et al., 2005). The thin SC dendrites (~0.4 m diameter) filter synaptic potentials as they 101
propagate to the soma and confer sublinear summation of synaptic input (Abrahamsson et al., 102
2012; Tran-Van-Minh et al., 2015). Nevertheless, the mechanisms underlying the maturation 103
of these dendritic operations and neuronal computation of interneurons has not been 104
explored. 105
106
Here we study in detail the maturation of the synaptic and integrative properties of SCs in the 107
cerebellar cortex. We combined patch-clamp recording with fluorescence-guided electrical 108
stimulation, fluorescence and electron microscopy 3D reconstructions, and numerical 109
simulations, to examine synapse strength and spatial distribution. Unlike unitary inputs in 110
other neuron types, we found that adult SCs had smaller and slower miniature excitatory 111
postsynaptic currents (mEPSCs) than those observed in immature SCs. This could be 112
explained by enhanced electrotonic filtering since immature SCs are thought to be 113
electrotonically compact (Carter and Regehr, 2002; Llano and Gerschenfeld, 1993). We 114
found, however, that their dendrites are as thin as in adult SCs and also capable of robust 115
electrotonic filtering and sublinear summation of synaptic inputs. Using a novel fluorescence 116
synaptic tagging approach we found a significantly larger contribution of distal dendritic 117
synapses in adult SCs, due to a substantial increase in dendritic branching combined with 118
constant synapse density. Multicompartment biophysical modeling confirmed that 119
developmental changes in synapse distribution could reproduce the developmental reduction 120
and slowing of recorded mEPSCs as well as the increased sublinear integration observed in 121
adult SCs. Our findings provide evidence that SCs implement different neuronal 122
computations throughout development: A predominant global summation model in immature 123
SCs shifts to sublinear dendritic integration in adult SCs, favoring the developmental 124
emergence of the two-layer integration model. This work provides a mechanistic description 125
of the maturation of neuronal computation resulting from both functional and anatomical 126
5 changes in synaptic transmission and integration. Our findings and approach also provide a 127
framework for interpreting the functional implications of alterations in dendritic morphology 128
and connectivity on information processing within neural circuits during disease. 129
130 131
6
Results
132 133
AMPAR-mediated mEPSCs become smaller and slower during development 134
The strength and time course of synaptic transmission is fundamental to information 135
processing within neural networks since they influence the efficacy and temporal precision of 136
the transformation of synaptic inputs into neuronal outputs. Excitatory synaptic inputs trigger 137
postsynaptic conductance changes due to the opening of neurotransmitter-gated receptors 138
which are activated upon transmitter release. These conductance changes are locally 139
integrated within dendrites into excitatory postsynaptic potentials (EPSPs), which then 140
propagate to the soma where they contribute to somatic voltage. The strength and time course 141
of synaptic conductances are known to change during development (Cathala et al., 2003; 142
Chen and Regehr, 2000; Koike-Tani et al., 2005) and can affect dendritic integration, which 143
in turn may alter neuronal computation (Tran-Van-Minh et al., 2015). 144
145
To identify factors that shape the post-natal developement of SC integrative properties, we 146
first compared excitatory postsynaptic currents (EPSCs) recorded in acute brain slices, either 147
from immature SCs soon after they reach their final position in the outer layer of the 148
cerebellar cortex (postnatal days 13 to 17), or from adult SCs (post-natal ages 35 to 57). 149
Granule cell afferent (parallel fibers, PFs) synapses release glutamate from only one synaptic 150
vesicle, despite the presence of multiple release sites per synaptic contact (Foster et al., 151
2005). We, therefore, examined these physiologically relevant “quantal synaptic events” 152
using somatic recordings of spontaneously occurring AMPA receptor (AMPAR)-mediated 153
miniature EPSCs (mEPSCs) in the presence of TTX to block spontaneous presynaptic 154
activity. mEPSCs arise from the release of a single neurotransmitter vesicle and occur 155
randomly at all synapses converging onto a single neuron. Therefore, mEPSCs can provide an 156
unbiased assessment of the effective distribution of synaptic strengths throughout the entire 157
somato-dendritic compartment. 158
159
We found that AMPAR-mediated mEPSCs occurred with a similar frequency at both ages 160
(1.37 ± 0.27 vs. 1.14 ± 0.13 Hz, P>0.05), but mEPSCs were significantly smaller and slower 161
in the adult (Figures 1A-1C). In immature SCs the average mEPSC amplitude was 48 ± 7 pA, 162
with 10-90% rise and decay times (
decay, see Methods) of 0.16 ± 0.01 ms and 0.68 ± 0.06 ms 163respectively. In contrast, mEPSCs from adult SCs were smaller 24 ± 2 pA (P<0.05), with 164
slower rising (0.24 ± 0.02 ms; P<0.05) and decaying kinetics (
decay = 1.31 ± 0.14 ms; 165P<0.05). The mEPSC amplitudes are consistent with those from previous studies describing
166
large miniature events (Llano and Gerschenfeld, 1993) capable of influencing immature SC 167
firing (Carter and Regehr, 2002). Nevertheless, we observed that mEPSCs continue to mature 168
past the 3rd post-natal week, becoming smaller and slower. 169
7 170
Previous studies have described developmental alterations in the glutamate content of 171
synaptic vesicles (Yamashita, 2003) and synaptic structure (Cathala et al., 2005), both of 172
which can modulate the neurotransmitter concentration in the synaptic cleft. To test whether 173
the reduced amplitude and slower time-course could be due to alteration in effective 174
amplitude and time-course of glutamate concentration ([Glut]) seen by synaptic AMPARs, we 175
recorded mEPSCs in the presence of a rapidly dissociating, low-affinity competitive AMPAR 176
antagonist, DGG (Diamond and Jahr, 1997; Liu et al., 1999). Application of a submaximal 177
concentration of DGG (1 mM) reduced mEPSC peak amplitude (Figure 1D, paired P<0.05) 178
similarly at both ages (44.42 ± 4.36 %, n = 7 in the immature vs. 42.38 ± 3.69 %, n = 9 in the 179
adult, P>0.05; Figure 1E), with no apparent effect on mEPSC kinetics (Figure 1F, paired 180
P>0.05). This result suggests that the decreased amplitude and slowing of mEPSCs is
181
unlikely due to a change in the synaptic [Glut]. We, therefore, explored whether post-synaptic 182
mechanisms, such as the acquisition of dendritic electrotonic filtering, (which exists in adult 183
SCs (Abrahamsson et al., 2012) and/or lower synaptic conductance (i.e., the number of 184
activated synaptic AMPARs), could explain the changes in mEPSC during maturation. 185
186
Dendritic morphology supports electrotonic filtering in both immature and adult SCs 187
Dendrites of adult SCs exhibit electrotonic cable filtering, which reduces the amplitude of 188
synaptic responses and slows their time course as they propagate to the soma (Abrahamsson 189
et al., 2012), thus modifying mEPSCs recorded at the soma. We considered whether the 190
developmental difference in mEPSC amplitude and kinetics was due to the development of 191
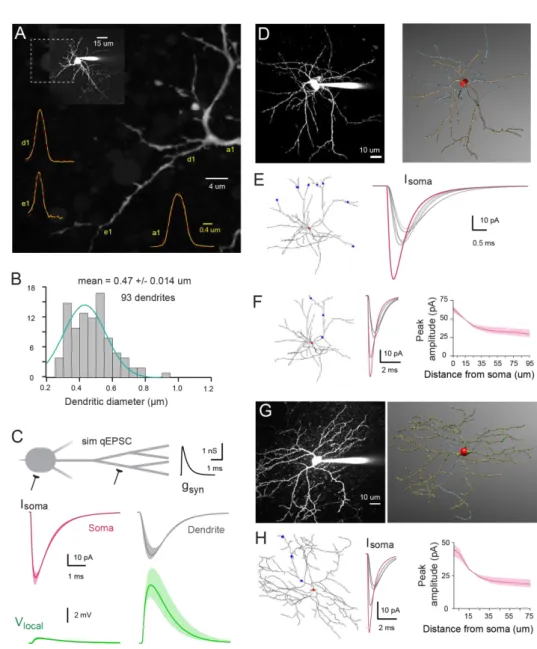
electrotonic filtering. To test this hypothesis, we estimated the dendrite diameter of immature 192
SCs, because the small diameter (<0.5 µm) and rapid synaptic conductances of adult SC 193
dendrites underlie their cable filtering properties (Abrahamsson et al., 2012). The dendritic 194
diameter was estimated from the full-width at half-maximum (FWHM) of the fluorescence 195
profile perpendicular to the dendrite from confocal images of live SCs aged P13 to P17 filled 196
with Alexa 488 (Figure 2A). Diameters ranged from 0.26 µm to 0.93 µm with a mean of 0.47 197
± 0.01 µm (n = 93 dendritic segments of 18 neurons; Figure 2B), which is close to the 198
average adult value of 0.41 ± 0.02 µm (range 0.24 to 0.9 m, n = 78 dendrites; data from 199
Abrahamsson et al., 2012; P<0.05). 200
201
To understand the potential functional influence of such small diameters, we calculated the 202
dendritic space constant (see Methods), i.e. the distance along a cable over which a steady-203
state membrane voltage decreases by 1/e. Using the estimated 0.47 m dendritic diameter, 204
membrane resistance (Rm) of 20,000 Ohm.cm2 (matching that experimentally measured from 205
immature SCs membrane time constant
m of 19 ± 2.2 ms, n = 16) and an internal resistivity 206Ri ranging from 100 to 200 Ohm.cm, we calculated the steady-state dendritic space constant 207
8 () to be between 343 to 485 µm, which is 3-5 fold longer than the actual dendritic length. 208
This confirms that, for steady-state membrane voltages, immature SCs are indeed electrically 209
compact, as previously suggested (Carter and Regehr, 2002). However, the frequency-210
dependent space constant (f; assuming that rapid mEPSCs are well-approximated by a 1 kHz 211
sine wave), was calculated to be between 46 to 60 µm (for Ri of 100 - 200 Ohm·cm). These 212
values are less than dendrite lengths and suggest that, like in adult SCs (Abrahamsson et al., 213
2012), somatic recording of EPSC originating in dendrites may be smaller and slowed due to 214
electrotonic cable filtering. 215
216
We confirmed these frequency-dependent estimations using a multi-compartmental 217
biophysical model to simulate the somatic response to quantal synaptic release throughout the 218
somato-dendritic compartment. We first used an idealized SC dendritic morphology 219
(Abrahamsson et al., 2012) and then fully reconstructed immature SC dendritic trees. For the 220
idealized immature SC morphology (Figure 2C), we used an 8 µm soma diameter (8.07 ± 221
0.23 µm, estimated from confocal images of 31 immature SC somata) and a 0.47µm dendritic 222
diameter (see mean value from Figure 2B), an Rm of 20,000 Ohm.cm2 and an Ri of 100 - 200 223
Ohm·cm. The simulated synaptic conductance gsyn amplitude and time course were adjusted 224
to match quantal EPSCs generated by a single vesicle (qEPSC; see experimental approach 225
below and Figure 3) recorded following activation of somatic synapses. Simulated qEPSCs 226
were large and fast for synapses located at the soma (magenta trace, Figure 2C) and 72% 227
smaller and 200% slower when synapses were located on the dendrites (grey trace; for a 228
synapse at 47 µm on a dendrite with 3 branch points and an intermediate Ri of 150 Ohm·cm). 229
This decrease in amplitude was associated with a large increase in the local synaptic 230
depolarization (green trace, Figure 2C) that would substantially reduce the local driving force 231
during synaptic transmission onto dendrites, causing a sublinear read-out of the underlying 232
conductance, similar to that observed in adult SCs (Abrahamsson et al., 2012). 233
234
We obtained similar results with morphologically accurate passive biophysical models 235
derived from 3D reconstructed SCs. SCs were patch-loaded with the fluorescence indicator 236
Alexa 594, imaged with two-photon laser scanning microscopy (2PLSM; Figure 2D), and 237
then reconstructed with NeuronStudio (Rodriguez et al., 2008). The 3D reconstruction was 238
then imported into the simulation environment, Neuron, with the membrane properties 239
indicated above. Activation of a synaptic contact at 60 µm from the soma on any dendrite of 240
the reconstructed immature P16 SC, produced a simulated qEPSC that was consistently 241
smaller and slower (grey traces) than the one produced following the activation of a somatic 242
synapse (magenta trace; Figure 2E). Similarly, activation of synaptic inputs along a dendrite, 243
at increasing distance from the soma, produced soma-recorded qEPSCs that become smaller 244
and slower with distance (Figure 2F), similar to those in reconstructed adult SCs (Figure 2G, 245
9 2H) and idealized SC models (Abrahamsson et al., 2012). These simulations suggest that, like 246
their adult counterparts, the morphometric characteristics of immature SCs should also 247
produce significant cable filtering of both the amplitude and time course of EPSCs. 248
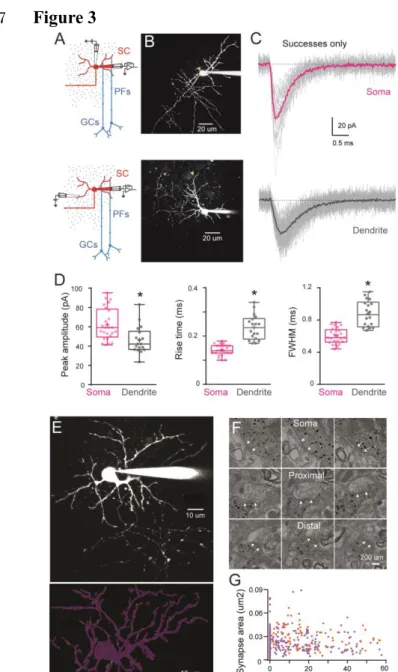
249
Synaptic events are electrotonically filtered in immature SCs 250
To confirm modeling predictions, we next explored whether dendrite-evoked quantal events 251
in immature SCs show evidence of cable filtering. Taking advantage of the orthogonal 252
projection of parallel fibers (PFs), we used parasagittal cerebellar slices to stimulate specific 253
PF beams that are synaptically connected to well-defined regions of an Alexa 594 loaded SC 254
by placing an extracellular electrode either above the soma or close to the distal part of an 255
isolated dendrite branch (Figure 3A and 3B). We recorded evoked qEPSCs using whole-cell 256
voltage clamp of the SC soma. This approach allows precise control of the location of the 257
activated synapses, in contrast with mEPSCs that can arise from unknown synapse locations 258
anywhere along the somato-dendritic axes. Dendritic filtering could then be examined by 259
measuring the amplitude and time course (response width at half-peak, half-width) of these 260
synaptic events, typically used to estimate cable filtering (Rall, 1967). To isolate qEPSCs, 261
PFs were stimulated in low release probability conditions (EPSC success rate of less than 262
10%; 0.5 mM extracellular [Ca2+] and 5 mM [Mg2+]). In these conditions, the average EPSC 263
generated from all successful trials is a good approximation of the quantal current amplitude 264
and time course (Silver et al., 2003). When stimulating somatic synapses, qEPSCs recorded 265
at the soma had a mean peak amplitude of 62 ± 3 pA, a 10-90 % rise time of 0.14 ± 0.004 ms, 266
and a half-width of 0.60 ± 0.02 ms (n = 25; Figure 3C, 3D). In contrast, stimulation of 267
dendritic synapses produced somatically recorded qEPSCs that were significantly smaller 268
(mean amplitude: 46 ± 3 pA) and slower (10-90 % rise time of 0.24 ± 0.012 ms and a half-269
width of 0.88 ± 0.04 ms; n = 18; all P<0.05, Figure 3C, 3D). These results are consistent with 270
cable filtering of EPSCs as they propagate along dendrites in immature SCs. 271
272
The decreased amplitude of qEPSCs evoked in the dendrite could also be due to lower 273
AMPAR content of dendritic synapses. As AMPAR density in SC synapses is constant 274
(Masugi-Tokita et al., 2007) we used post-synaptic density (PSD) size as a proxy for the 275
number of AMPARs. We measured PSD area of somatic and dendritic synapses from 3D 276
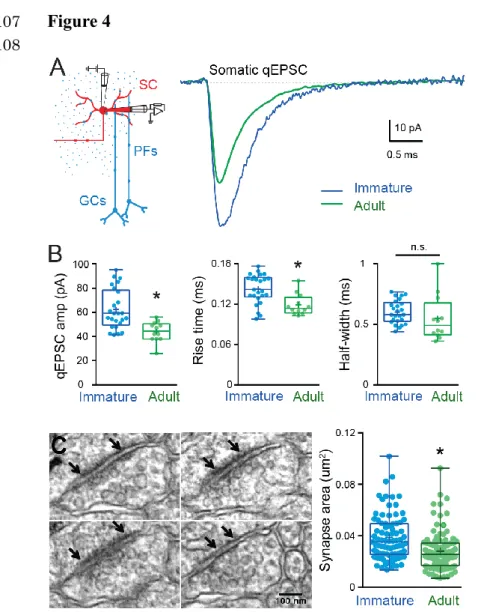
electron microscopy (EM) reconstruction of immature SCs. We reconstructed the soma and 277
the dendritic tree of two SCs (P14 and P17) loaded with Alexa 594 and biocytin (Figure 3E). 278
Immunogold labeling of biocytin made possible the identification of PSDs (Figure 3F) and 279
measurement of their distance from the soma. PSD area was constant along somatodendritic 280
axes (Figure 3G) ruling out synaptic scaling as a mechanism for the reduction in qEPSCs 281
after dendritic stimulation. Thus the difference in qEPSC amplitude and time-course observed 282
between somatic and dendritic synapses in immature SCs is likely due to cable filtering. 283
10 284
Developmental changes in synaptic conductance amplitude, but not time course 285
Because cable filtering of synaptic responses is present in both immature and adult SCs, we 286
next explored whether differences in mEPSC amplitude between the two ages were due to 287
maturation of quantal synaptic conductance (i.e. number of synaptic AMPARs). To avoid the 288
effects of cable filtering, we measured qEPSCs only at somatic synapses. In immature SCs, 289
somatic qEPSCs were 41% larger than those in adult SCs (62.3 ± 3.3 pA, n = 25 vs. 44 ± 2.4 290
pA, n = 12, Abrahamsson et al., 2012), p<0.05, Figure 4A, 4B), but with no difference in the 291
half-width (0.60 ± 0.02 ms, n = 25 vs. 0.59 ± 0.06 ms, n = 12, P>0.05, Figure 4B). These 292
results suggest that more AMPARs are activated by quantal release of glutamate at immature 293
somatic synapses. Similarly, the 10-90 % rise time was slower in immature SCs compared to 294
adult (0.14 ± 0.02 ms, n = 25 vs. 0.12 ± 0.004, n = 12, P<0.05; Figure 4B), indicating larger 295
immature synapses (Cathala et al., 2005). To confirm the reduction in synaptic AMPARs 296
during maturation, we compared somatic PSD areas between immature and adult SCs. In 297
immature SCs, mean somatic PSD size was 0.039 ± 0.002 μm2 (n = 83 synapses; Figure 4C), 298
which is 39% larger than that of adult SCs (0.028 ± 0.0015 μm2, n = 97, P<0.05; data 299
obtained by the same method from Abrahamsson et al., 2012). The developmental reduction 300
in PSD size is similar to the amplitude reduction of recorded somatic qEPSC, and thus will 301
contribute to the developmental reduction in mEPSC. However, fewer synaptic AMPARs 302
cannot explain the observed change in mEPSC time course. 303
304
Dendritic distribution of excitatory synaptic inputs changes during maturation 305
In addition to cable filtering of synaptic currents, a neuron’s somatic response to dendritic 306
input is also affected by synapse distribution within its dendritic tree, which may not be 307
uniform – as demonstrated for starburst amacrine interneurons (Vlasits et al., 2016) and CA1 308
pyramidal neurons (Katz et al., 2009; Magee and Cook, 2000). We hypothesized that changes 309
in synapse distribution could underlie the slowing of mean mEPSCs time-course observed 310
adult SCs. In support of this hypothesis, immature SC mEPSC rise and decay kinetics are 311
similar to those of somatic qEPSCs (compare Figure 1 vs. Figure 4), whereas adult SC 312
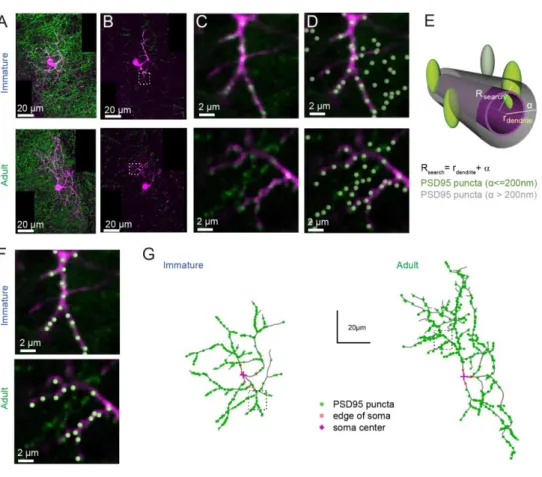
mEPSC kinetics are closer to those of dendritic qEPSCs (Figure 1 vs. Figure 3). Specifically, 313
in immature SC the mean mEPSC decay is similar to the qEPSC decay from somatic 314
synapses but significantly different from those of dendritic synapses, suggesting that synaptic 315
responses from distal synapses do not participate significantly to the mean mEPSC at this 316
developmental stage. In contrast, the adult mEPSC decay is close to the dendritic qEPSC 317
decay, but significantly different from that of somatic synapses. These results are consistent 318
with mEPSCs in adult SCs arising more often from more distal synapses. 319
To test this hypothesis, we examined the distribution of excitatory synaptic inputs along the 320
somato-dendritic compartment in immature and adult SCs. Since SC dendrites lack spines, 321
11 we used transgenic mice conditionally expressing Venus-tagged PSD95 to label putative 322
excitatory synapses. We then mapped Venus-tagged PSD95 puncta associated with the somata 323
and dendritic trees of Alexa 594-filled immature and adult SCs (Figure 5A-D), defining 324
puncta located within 200 nm of the dendritic surface (Figure 5E) as excitatory synapses 325
targeting the dendrite (Figure 5F; see Methods). Venus-tagged PSD95 puncta within the soma 326
and dendritic tree of 9 immature and 8 adult 3D-reconstructed SCs (Figure 5G), showed ~ 80 327
% more puncta on adult SCs (582 ± 48 puncta vs. 324 ± 21 in immature SC, p<0.05). 328
Synapse distribution was assessed by counting the number of PSD95 puncta within 10 µm 329
segments at increasing distance from the soma. In immature SCs, ~ 80 % are within 35 µm of 330
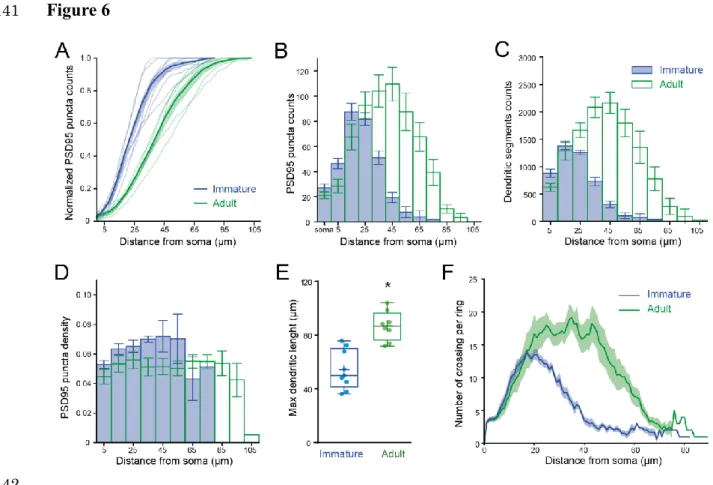
the soma, in contrast to only ~ 40% this close to the soma in adult SCs (Figure 6A, 6B). 331
However, the ratio of detected puncta (Figure 6B) to dendritic segments (Figure 6C) shows 332
that puncta density remained constant across the dendritic tree at both ages (Figure 6D). 333
Thus, the larger number of puncta located further from the soma in adult SCs is not due to 334
increased puncta density with distance, but a bigger dendritic field (Figure 6E) and many 335
more distal dendritic branches (Sholl analysis, Figure 6F). Taken together, these data 336
demonstrate that increased dendritic complexity during SC maturation is responsible for a 337
prominent shift toward distal synapses in adult SCs. Therefore, if mEPSCs are generated 338
from a homogeneous probability of release across all synapses, then this bias towards distal 339
synapses in adult SC will generate quantal responses that experience stronger cable filtering. 340
341
Change in synapse distribution underlies developmental slowing of mEPSC 342
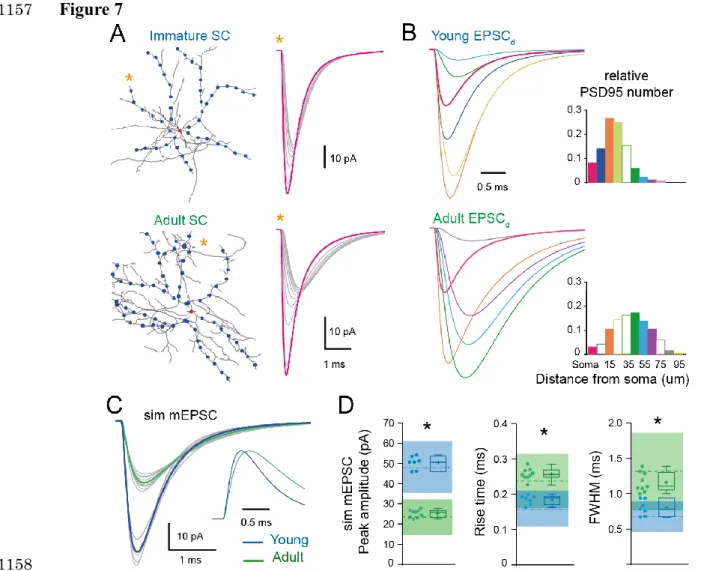
We next examined whether differences in synapse distribution could account quantitatively 343
for the observed changes in mEPSC amplitude and time course. We performed numerical 344
simulations using reconstructed immature and adult SCs (Figure 2D and 2G) and a quantal 345
synaptic conductance (gsyn) that reproduced measured immature and adult qEPSCs induced at 346
somatic synapses (Figure 4). We simulated qEPSCs evoked by synaptic activation at the 347
soma and at 10 µm intervals along the somato-dendritic axes (Figure 7A). Assuming that 348
mEPSCs are generated randomly with an equal probability at all synapses, we generated a 349
simulated mean mEPSC by summing the qEPSC at each distance (EPSCd), each weighted by 350
its relative frequency according to the synapse distribution (Figure 7B). EPSCds arising from 351
distal locations in the adult were larger and contributed relatively more to the simulated mean 352
mEPSC waveform (Figure 7B). The resulting mean mEPSC was smaller in adult SCs than in 353
immature SCs (26.0 ± 0.6 pA, n = 9 dendrites vs. 52.2 ± 0.4 pA, n = 7 for Ri 150) and its 354
time-course had slower rise (10-90 % rise time = 0.24 ± 0.05 vs. 0.17 ± 0.01 ms) and decay 355
(half-width = 1.11 ± 0.04 vs. 0.77 ± 0.01 ms; for all P<0.05). Moreover, the simulated mean 356
mEPSCs lay within one standard deviation of measured experimental mEPSC values (Figure
357
7C, 7D). Thus by implementing the experimentally observed synapse distributions in our 358
simulations, we could accurately reproduce the experimental mean mEPSCs. These results 359
12 demonstrate that developmental increases in dendritic branching complexity, provided that 360
synapse density is homogeneous, can account for the changes in mEPSC kinetics (Figure 1). 361
362
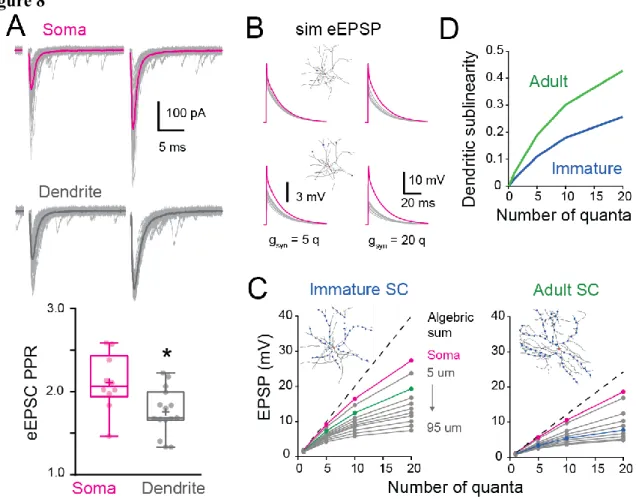
Influence of synapse distribution on dendritic integration of multiple synaptic inputs 363
We previously showed in adult SCs that the activation of dendritic synapses conveys 364
sublinear integration as compared to the soma (Abrahamsson et al., 2012) due to the large 365
local input resistance of thin dendrites resulting in synaptic depolarizations that reduced 366
synaptic current driving force (Bloomfield et al., 1987; Rall, 1967). This also produced a 367
distance-dependent decrease in short-term plasticity (STP). We examined whether dendritic 368
integration in immature SCs is also sublinear by comparing STP following dendritic and 369
somatic synapse activation. PFs targeting SC somata and dendrites were stimulated using a 370
pair of extracellular voltage pulses with an interval of 20 ms. The paired-pulse ratio (PPR; the 371
ratio of the amplitudes of the second vs. the first EPSC) was 2.1 ± 0.1 for somatic synapses (n 372
= 10) and decreased to 1.8 ± 0.1 for distal dendritic synapses (n = 15; P<0.05; Figure 8A), 373
consistent with sublinear integration. These results were reproduced by numerical simulations 374
of evoked EPSCs or EPSPs in the idealized passive SC model (with a synaptic gsyn matching 375
the recorded EPSC evoked at the soma and a 2.25 conductance ratio). These findings show 376
that immature SC dendrites also display an STP gradient, suggesting that they are capable of 377
sublinear integration. 378
379
To address this possibility, we used biophysical modeling of subthreshold synaptic input-380
output relationships (I/O) that has been shown to accurately reproduce experimental sublinear 381
I/Os recorded after neurotransmitter photo-uncaging (Abrahamsson et al., 2012). Evoked 382
EPSPs were simulated (sim eEPSP) in response to increasing synaptic conductance (gsyn), 383
equivalent to one to 20 quanta in order to encompass sparse and clustered activation of 384
parallel fibers (Wilms and Häusser, 2015) at the soma and at 10 µm intervals along the 385
reconstructed dendrites of the immature SC. (Figure 8B). I/O plots showed that sim eEPSPs 386
in the soma and dendrites were less than the linear sum of eEPSPs (dashed line). This 387
sublinear summation was apparent for dendritic eEPSPs generated from synaptic 388
conductances equivalent to 1 quantum for dendritic synapses and became more pronounced 389
for distal synapses (Figure 8C). The sublinearity increased with increasing number of 390
simultaneously activated quanta. These simulations show that immature dendrites 391
demonstrate sublinear summation, supporting experimental difference between somatic and 392
dendritic STP (Figure 8A). 393
394
To estimate the impact of development changes in synapse distribution on the maturation of 395
SC computations, we compared simulated subthreshold I/Os between immature and adult 396
SCs with their respective age-dependant gsyn (Figure 8C). For immature SCs we examined 397
13 subthreshold I/Os when activating synapses at 15 µm along reconstructed dendrites (Figure 398
8C, green), a distance with the highest relative number of synaptic contacts (Figure 7B), and 399
compared to I/Os generated from synapse activation at 45 µm in adult SCs (distance with the 400
largest relative number of synapses). Sublinearity was quantified by normalizing sim eEPSPs 401
to an sim eEPSP evoked by injecting a gsyn of 0.1 quanta, a conductance to which the voltage 402
is linearly related. Because large gsyn can generate sublinear integration at the soma (Figure 403
8C), we estimated the dendrite-specific sublinearity for each gsyn by taking the ratio between 404
the relative sim eEPSPs amplitude (normalized to quanta) at a given distance and the 405
normalized sim eEPSP amplitude for somatic synapses. The final estimate of dendritic 406
sublinearity was then defined as one minus this ratio (Figure 8D). While both immature and 407
adult SCs exhibited sublinear integration, dendritic sublinearity was larger in adult SCs for all 408
synaptic strengths, supporting an increased difference between the two layers of integration 409
(i.e. soma versus dendrite). The smaller difference in sublinearity between soma and dendrite 410
in the immature SC resulted from both fewer distal synapses and the larger gsyn. Thus the 411
developmental increase in dendritic field complexity and decreased synaptic strength together 412
contribute to the establishment of a two-stage integration model and provide a cellular 413
substrate for a developmental increase in computational power of SCs. 414
415
Discussion
416417
Dendritic integration of synaptic inputs is a critical component of neuronal information 418
processing, but little is known about how it matures during neuronal network formation and 419
maturation. We took advantage of the late development of the cerebellar cortex to 420
characterize developmental changes in synaptic and dendritic properties. By combining 421
patch-clamp recording of cerebellar SC interneurons, 3D-reconstructions of their aspiny 422
dendrites, along with the identification of excitatory synapse locations, and numerical 423
simulations, we showed for the first time how the maturation of synapse distribution within 424
interneurons combines with changes in synaptic strength and increased dendritic branching to 425
shape the development of neuronal computation. This maturation process favors the 426
emergence of a compartmentalized two-stage integrator model, which extends the repertoire 427
of transformations of synaptic inputs into neuronal output in adult SCs. These results 428
highlight the importance of characterizing not only dendritic morphology, but also synapse 429
placement and synaptic strength, in order to correctly infer a neuron’s computational rules. 430
431
Implications of developmental alterations of dendritic morphology 432
We showed that soon after SC integration into the cerebellar molecular layer microcircuit, 433
their dendrites are nearly the same diameter as adult SCs (Abrahamsson et al., 2012), 434
suggesting a similar capacity for cable filtering of synaptic responses. Since previous studies 435
14 suggested that SCs were electronically compact (Carter and Regehr, 2002; Llano and 436
Gerschenfeld, 1993), the observation that mEPSCs from adult SCs were slower led us to 437
consider changes in cable filtering as the underlying mechanism for the developmental 438
change in mEPSC kinetics. However, we showed, both experimentally and by modeling, that 439
dendrite-evoked qEPSCs from immature SCs have similar dendritic integration properties as 440
adult SCs (Abrahamsson et al., 2012): (a) dendrite-evoked qEPSCs are smaller and slower 441
than those evoked at the soma (Figure 3), consistent with cable filtering; (b) STP differed 442
between dendrite and somatic stimulation (Figure 8); and (c) subthreshold I/Os were 443
sublinear (Figure 8). Thus the basic electrotonic machinery to filter synaptic responses is 444
already present as soon as SC precursors reach their final location in the outer third of the 445
molecular layer. However, the maturational difference between mEPSCs, which presumably 446
reflect synaptic responses from the entire dendritic tree, suggested that another factor must be 447
contributing to the difference in apparent electrotonic filtering. 448
449
Previous studies have shown that synapses are not uniformly distributed along dendrites, 450
allowing pyramidal neuron dendrites to operate as independent computational units(Katz et 451
al., 2009; Menon et al., 2013; Polsky et al., 2004), and retinal starburst amacrine interneurons 452
to compute motion direction (Vlasits et al., 2016). We considered the possibility that the 453
distribution of synapse locations within the dendritic tree was altered during SC maturation. 454
We found that synapses were uniformly distributed along the somato-dendritic axis with a 455
similar density at the two ages. However, adult SCs had more synapses located at further 456
electrotonic distances (~ 2/3 vs. 1/3 of synapses were more than 30 μm from the soma; Figure 457
6 and 7) due to increased dendritic branching. Thus, the distal-weighted synaptic distribution 458
in adult SCs favors inputs that experience stronger cable filtering. This was confirmed by 459
simulating a mean mEPSC at the two ages, that fully reproduce the mEPSC recorded 460
experimentally (Figure 1), by weighting simulated qEPSCs according to the relative number 461
of synapses at specific distances along the dendrites (Figure 7). Indeed, the large fraction of 462
distal synapses in adult SCs was sufficient to account for the observed developmental 463
difference in mEPSC amplitude and time-course. 464
465
Synaptic conductance does not display distance-dependence synaptic scaling 466
Voltage-clamp recordings of mEPSCs showed that their time course and amplitude are both 467
halved during development (Figure 1). This result contrasts with findings in other neurons 468
that show faster mEPSCs during maturation due to changes of AMPAR subunits, glutamate 469
vesicular concentration content, and/or synapse structure (Cathala et al., 2005; Yamashita et 470
al., 2003). Knowing that dendritic inputs could be electrotonically filtered, we took advantage 471
of the ability to selectively stimulate somatic synapses to isolate somatic qEPSCs for 472
comparison between the two ages. Evoked qEPSCs showed a developmental reduction in 473
15 amplitude (~ 40%), with no change in kinetics (Figure 4). This likely results from the smaller 474
adult PSD size (Figure 4), and hence a lower AMPAR number (Masugi-Tokita et al., 2007), 475
rather than a developmental reduction in the peak glutamate concentration at the postsynaptic 476
AMPARs (Figure 1). Therefore individual synaptic inputs are less likely to influence adult 477
SC neuronal output. Moreover, since PSD area is constant along the somato-dendritic axis 478
(Figure 3), the observed developmental reduction in synaptic conductance can be 479
extrapolated to the whole dendritic tree. Thus SCs do not exhibit synaptic conductance 480
scaling mechanisms to offset dendritic filtering, such has been described for pyramidal 481
neurons (Katz et al., 2009; Magee and Cook, 2000; Menon et al., 2013; Nicholson et al., 482
2006), resulting in a strong dependence of somatic voltage responses on synapse location 483
within the dendritic arbor. 484
485
Developmental changes in computational rules 486
Our findings highlight the critical importance of understanding both the structural and 487
functional mechanisms underlying developmental refinement of synaptic integration that 488
drives a neuron’s computational properties and, the emergence of mature microcircuit 489
function. While a defining feature of immature SCs is the high propensity of quantal EPSPs 490
to generate spikes (Carter and Regehr, 2002), the observed developmental decrease in 491
synaptic conductance (Figure 4) and increased filtering of mEPSCs (Figures 2 and 3) will 492
tend to reduce the influence of single synaptic inputs on somatic voltage in adult SCs, 493
increasing their dynamic range of subthreshold integration. Although dendrites in immature 494
and adult SCs exhibit similar electrotonic filtering, the distal bias in synapse location 495
promotes sublinear subthreshold dendritic integration in adult SCs. Unlike pyramidal 496
neurons, where synapse strength and density are scaled to normalize the contribution of 497
individual inputs to neuronal output (Katz et al., 2009; Magee and Cook, 2000; Menon et al., 498
2013), the spatially uniform distribution of synapse strength and density in SCs do not 499
compensate the electrotonic filtering effects of the dendrites or the increased number of distal 500
synapses due to branching. 501
502
These properties of quantal synaptic responses, together with the larger difference in 503
sublinearity between soma and dendrites (Figure 8D), will favor the emergence of a spatially 504
compartmentalized two-stage integration model in adult SCs, thereby promoting location-505
dependent integration within dendritic subunits (Polsky et al., 2004) and enhanced neuronal 506
computations (Caze et al., 2013). In immature SCs, the repertoire of computations is more 507
similar to a simple single-stage integration model where large and fast synaptic potentials 508
will promote reliable and precise EPSP-spike coupling (Cathala et al., 2003; Fricker and 509
Miles, 2001; Hu et al., 2010), which may be critical for driving the functional maturation of 510
the local microcircuit (Akgül et al., 2020). In contrast, synaptic integration and summation in 511
16 adult SCs can obey different rules depending on synapse location within the dendritic tree 512
enabling to discriminate a larger number of spatial patterns of synaptic activation (Tran-Van-513
Minh et al., 2015) and therefore favor spatially sparse synaptic representations (Abrahamsson 514
et al., 2012; Caze et al., 2013) that might be essential for the development of enhanced 515
pattern separation by Purkinje cells (Cayco-Gajic et al., 2017). Since a recent theoretical 516
study showed that sublinear integration is also a property of hippocampal fast-spiking 517
interneurons (Tzilivaki et al., 2019) that influence memory storage, it will also be important 518
to determine if these interneurons exhibit a similar maturation of their neuronal computation. 519
520
Implications for neurodevelopmental and neurological disorders 521
The increasing complexity of dendritic arbors, accompanying changes in synaptic 522
connectivity and function during development is not limited to the cerebellum. These 523
maturational processes are altered in neurodevelopmental disorders, such as mental 524
retardation (Kaufmann and Moser, 2000), autism spectrum disorders (Antoine et al., 2019; 525
Peng et al., 2016), or Rett Syndrome (Blackman et al., 2012; Ip et al., 2018), as well as in 526
neurodegenerative disease. Indeed, these developmental processes are particularly relevant 527
for interneurons since they play a pivotal role in the establishment of the correct 528
excitation/inhibition balance for normal circuit function. During development, inhibitory 529
interneurons are essential for defining critical periods (Gu et al., 2016; Hensch et al., 1998) or 530
direction selectivity in the retina (Vlasits et al., 2016; Wei et al., 2011), so that interneuron 531
dysfunction is associated with neurodevelopment disorders (Akerman and Cline, 2007; Le 532
Magueresse and Monyer, 2013; Marín, 2016). Our work demonstrates how developmental 533
changes in neuronal morphology, and synapse distribution and strength, combine to 534
determine the impact of synaptic inputs on neuronal output. Our findings provide a functional 535
template of how dendritic integration matures throughout development to enrich interneurons 536
with more complex neuronal computations, promoting location-dependent integration within 537
dendritic subunits. 538
539 540
17
Materials and Methods
541
Slice preparation and Electrophysiology 542
Acute cerebellar parasagittal slices (250 or 200 µm thick respectively) were prepared from 543
immature (postnatal day 14-17) and adult (P35-57) mice (F1 of BalbC and C57B6 or 544
C57BL/6J) as described previously (Abrahamsson et al., 2012). Briefly, mice were killed by 545
decapitation, the brains rapidly removed and placed in an ice-cold solution containing (in 546
mM): 2.5 KCl, 0.5 CaCl2, 4 MgCl2, 1.25 NaH2PO4, 24 NaHCO3, 25 glucose, and 230 547
sucrose, bubbled with 95% O2 and 5% CO2. Slices were cut from the dissected cerebellar 548
vermis using a vibratome (Leica VT 1000S or VT1200S), incubated at 32°C for 30 minutes in 549
the following solution (in mM): 85 NaCl, 2.5 KCl, 0.5 CaCl2, 4 MgCl2, 1.25 NaH2PO4, 24 550
NaHCO3, 25 glucose, and 75 sucrose and subsequently maintained at room temperature for 551
up to 8 hours in the recording solution containing (in mM): 125 NaCl, 2.5 KCl, 2 CaCl2, 1 552
MgCl2, 1.25 NaH2PO4, 25 NaHCO3, and 25 glucose. Unless otherwise noted, this solution 553
included during patch recordings 10 μM SR-95531, 10 μM D-AP5, 20 μM 7-chlorokynurenic 554
acid, and 0.3 μM strychnine, to block GABAA, NMDA, and glycine receptors, respectively. 555
556
Whole-cell patch-clamp recordings were made from SCs located in the outer one-557
third at molecular layer at temperatures ranging from 33 to 36°C using an Axopatch-200A or 558
a Multiclamp 700 amplifier (Axon Instruments, Foster City, Ca, USA) with fire-polished 559
thick-walled glass patch-electrodes (tip resistances of 6-8 M) that were backfilled with a 560
solution containing (in mM): 117 K-MeSO4, 40 HEPES, 6 NaOH, 5 EGTA, 1.78 CaCl2, 4 561
MgCl2, 1 QX-314-Cl, 0.3 NaGTP, 4 NaATP, and, when applied 0.03 Alexa 594, adjusted to 562
~300 mOsm and pH 7.3. Series resistance and capacitance measures were determined directly 563
from the amplifier settings. 564
565
All EPSCs were recorded at -70 mV (not corrected for LJP ~ +6 mV) were filtered at 566
10 kHz, and digitized at 100 kHz using an analogue-to-digital converter (model NI USB 567
6259, National Instruments, Austin, TX, USA) and acquired with Nclamp (Rothman and 568
Silver, 2018) within the Igor Pro 6.2 environment, WaveMetrics). No series resistance 569
compensation was used. To evoke EPSC, parallel fibers were stimulated with a glass patch 570
electrode filled with external recording solution that was placed close to a fluorescently 571
labeled dendrite or close to the soma. 50 μs pulses between 5-55 V (Digitimer Ltd, 572
Letchworth Garden City, UK) were delivered as described previously (Abrahamsson et al., 573
2012). Somatic and dendritic quantal EPSCs were obtained from experiments where [Ca2+] 574
was lowered to 0.5 mM while [Mg2+] was increased to 5 mM to obtain an evoked EPSC 575
success rate <10% known to produce a qEPSC with a <10% amplitude error (Silver, 2003). 576
Trials with a synaptic event could be clearly selected by eye. The stimulation artifact was 577
removed by subtracting from single success traces the average obtained for the traces with 578
18 failed synaptic transmission.
579 580
Current-clamp recordings were performed using a Multiclamp 700 amplifier. Patch electrodes 581
were coated with dental wax and series resistance was compensated by balancing the bridge 582
and compensating pipette capacitance. Current was injected to maintain the resting potential 583
near -70 mV. Data were filtered at 10 kHz, and digitized at 100 kHz. 584
585
D-AP5, 7-chlorokynurenic acid,
DGG, QX-314 chloride, SR 95531 and Tetrodotoxin were 586purchased from Ascent Scientific (http://www.ascentscientific.com). Alexa 594 was 587
purchased from Invitrogen (https://www.thermofisher.com/invitrogen). All other drugs and 588
chemicals were purchased from Sigma-Aldrich (https://www.sigmaaldrich.com). 589
590
Multi-compartmental biophysical modeling 591
Passive cable simulations of EPSC and EPSP propagation within idealized and reconstructed 592
SC models were performed using Neuron 7.1, 7.2 and 7.5 (Hines and Carnevale, 1997). The 593
idealized SC model had a soma diameter of 9 μm and three 90 μm long dendrites of 0.47 μm 594
diameter, with either 1, 3 or 5 branches. An immature (P16) and adult SC (P42) were 595
reconstructed in 3D with NeuronStudio (Rodriguez et al., 2008) from 2PLSM image of SC 596
patch loaded with 30 µM Alexa 594 in the pipette and imported in Neuron. Passive properties 597
were assumed uniform across the cell. Specific membrane capacitance (Cm) was set to 0.9 598
µF/cm2. R
m was set to 20 000 Ωcm2 to match the membrane time constant experimentally 599
estimated at 19 ± 2.2 ms for immature SCs (n = 16) and 17 ± 2.7 ms for adult SC (n=10). Ri 600
was set to 150 Ωcm to match the filtering of EPSC decay in the dendrites of mature SC 601
(Abrahamson et al., 2012) and allowed to vary from 100 to 200 Ωcm to sample a large range 602
of physiological Ri since its physiological value is not known. The AMPAR-mediated 603
conductance waveforms (gSyn) were set to match the amplitude and kinetics of experimental 604
somatic qEPSCs and evoked EPSCs. Experimental somatic PPR for EPSCs were reproduced 605
with a gSyn2/gSyn1 of 2.25. 606
607
Electron microscopy and three-dimensional reconstructions 608
Electron microscopy and three-dimensional (3D) reconstructions of two SCs from acute 609
slices (postnatal day 14 and 17) were performed as described previously (Abrahamsson et al., 610
2012). Slices containing SCs whole-cell patched with a K-MeSO3-based internal solution 611
containing biocytin (0.3%) and Alexa 594 (30 μM) were transferred to a fixative containing 612
paraformaldehyde (2.5%), glutaraldehyde (1.25%), and picric acid (0.2%) in phosphate buffer 613
(PB, 0.1 M, pH = 7.3), and fixed overnight at room temperature. After washing in PB, slices 614
were transferred to sucrose solutions (15% for 30 minutes, then stored in 30%) for 615
cryoprotection and frozen in liquid nitrogen, then subsequently thawed. The freeze-thaw 616
19 cycle was repeated twice, then followed by incubation with a 1.4nm gold-conjugated 617
streptavidin (Nanoprobe, 1:100 in Tris-buffered saline (TBS) and 0.03% Triton X100). After 618
washing in TBS and dH2O, slices were treated with HQ silver enhancement kit (Nanoprobe) 619
for 5 minutes, fixed in 1% OsO4 in PB for 30 minutes, and block stained with 1% uranyl 620
acetate for 40 minutes. After dehydration through a series of ethanol solutions (50, 70, 80, 90, 621
95, 99, and 100%) and propylene oxide twice for 10 minutes, slices were embedded into 622
Durcupan (Fluka) and flat embedded. The labeled SCs were trimmed and 300~400 serial 623
ultrathin sections were cut at 70 nm using ATUMtome (RMC Boeckeler). Serial sections 624
containing immunogold labeled profiles were imaged with a scanning electron microscope 625
(Merlin Compact, Zeiss) and Zeiss Atlas package at X 22,000 for whole-cell reconstruction 626
and at X 55,000 for synapses. For the area measurement of synapses on soma, serial sections 627
through three unlabeled neighbor SCs were also used to avoid potential turbulence due to the 628
patching. These sections were cut at 70 nm using an ultramicrotome (Leica EM UC7), 629
observed with a transmission electron microscope (Tecnai 12, FEI), and photographed at X 630
21,000. Asymmetrical synapses made by axon terminals onto SC somata and dendrites were 631
analyzed only if they were fully present within the serial sections. The PSD length of the 632
asymmetrical synaptic membrane specialization was measured on each ultrathin section, and 633
the PSD area was calculated by multiplying the summed synaptic length from each synapse 634
with the thickness (70 nm) of the ultrathin sections. The 3D reconstruction of the two SC 635
soma and parts of their dendritic trees was performed using the software Reconstruct (JC 636
Fiala). The distances from each synapse to the soma were measured along the dendrites in the 637
reconstructed volume. 638
639
Transmitted light and fluorescence imaging 640
SC somata in the outer one-third of the molecular layer were identified and whole-cell 641
patched using infrared Dodt contrast (Luigs and Neumann). Two-photon excitation or LED 642
illumination coupled with the Dodt contrast was used to visualize Alexa 594 filled SCs and 643
position extracellular stimulating electrodes along isolated dendrites of SCs fluorescence. 644
Two-photon excitation was performed with a pulsed Ti:Sapphire laser (MaiTai DeepSee, 645
Spectra Physics) tuned to 810 nm and images were acquired with an Ultima two-photon laser 646
scanning microscope system (Bruker) mounted on an Olympus BX61WI microscope 647
equipped with a 60x (1.1 NA) water-immersion objective. LED excitation (470 nm) was 648
performed with a CAIRN LED module (optoLED) and wide-field fluorescence images were 649
acquired with a CCD camera (QIclick, QImaging) mounted on an Olympus BX51 650
microscope equipped with a 60x (1 NA) water-immersion objective. 651
652
One-photon confocal laser scanning fluorescence microscopy was performed with an Ultima 653
scan head mounted on a Nikon EFN microscope. SCs were filled with 40 μM Alexa 488. 654
20 Maximal intensity projections of confocal images were performed using a 100x 1.1 NA 655
Nikon dipping objective in 0.2 μm increments as described previously (Abrahamsson et al., 656
2012). We used the full-width at half maximum (FWHM) of intensity line profiles on 1 µm 657
segments of dendrites, made perpendicular to dendritic length, as an approximation of the 658
dendritic diameter. This is likely to be an upper limit given the blurring effect of the PSF. 659
660
2P imaging: The two-photon scanning microscope (2PLSM, Ultima IV, Bruker) was
661
equipped with a Ti:Sapphire Laser (Chameleon II, Coherent Inc.) at 940nm (SC body, Alexa 662
594) and 810nm (venus-tagged PSD95 puncta) using a 60x water immersion objective 663
(LUMFL N, 1.10 NA, Olympus). The point spread function of the microscope was estimated 664
from the FWHM value of the x-,y- and z- intensity line profiles from 3D images of 200nm 665
yellow-green fluorescent latex beads (FluoSpheres, F8811, Thermo Fisher Scientific): 666
PSF810x/y = 325 ± 27 (SD) nm, PSF810z =1178 ± 121(SD) nm, and PSF940x/y = 390 ± 23 (SD), 667
PSF940z =1412 ± 141 (SD) nm. 668
669
Three-dimensional reconstructions and puncta detection from 2P images 670
We examined the distribution of excitatory synaptic inputs along the somato-dendritic 671
compartment in SCs from a transgenic mouse line that conditionally expresses Venus-tagged 672
PSD95 under the control of the nitric oxide synthase 1 promoter (PSD95-Enabled (Fortin et 673
al., 2014) x Nos1 Cre (Kim et al., 2014)). We patch-loaded single SCs with the fluorescence 674
indicator Alexa 594, then performed live two-color 2PLSM to identify Venus-tagged PSD95 675
puncta associated with the labeled somata and dendritic trees. Z-stacks were acquired for 676
each wavelength with a z-step of 300 nm, a pixel size of 154 nm, and an image size of 512 x 677
512 pixels. To correct for a shift in the focal point for the different wavelengths and a 678
potential drift in x/y-directions, the individual stacks were registered to each other using as a 679
reference the dendritic structure imaged using Alexa 594 emission, which is primarily excited 680
at 810 nm, but weakly excited at 940 nm which allows to record both the puncta and the cell 681
body simultaneously. The registration was performed using the IMARIS stitcher tool. 682
Fluorescence emission was spectrally separated from laser excitation using a custom multi-683
pass dichroic (zt 405/473-488/nir-trans; Chroma) and a short pass IR blocking filter 684
(ET680sp-2p8; Chroma). Venus and Alexa 594 fluorescence emission were spectrally 685
separated and detected using detection filter cubes consisting of a long-pass dichroic 686
(575dcxr; Chroma) and two bandpass filters (HQ525/70m-2p and HQ607/45m-2p, 687
respectively; Chroma). A multi-alkali (R3896, Hamamatsu, Japan) photomultiplier tubes was 688
used to detect Alexa 594 fluorescence and gallium arsenide phosphide tube (H7422PA-40 689
SEL, Hamamatsu) for the Venus channel. Proximal and substage detection were used to 690
increase signal to noise. 691
21
Dendrite tracing: The image analysis software IMARIS 9.5 (Bitplane) was used for dendritic
692
tracing and fluorescence puncta detection. Fluorescence images were filtered using a 3x3 px 693
median filter to remove noise. Image stacks were then further combined using the IMARIS 694
stitcher tool to create one contiguous file that permits tracing of the entire dendritic tree.
695
Dendrites, but not axons, were traced in IMARIS using the filament tool in a semi-automatic 696
mode using the AutoPath method and the options AutoCenter and AutoDiameter activated. 697
The soma center was chosen as the starting point with centripetally tracing along dendrites. 698
Dendritic lengths were estimated as the dendritic path distance from the center of the soma 699
and Sholl analysis was performed with IMARIS from all reconstructed SC. 700
PSD-95 Venus puncta detection: Fluorescence puncta were detected using the IMARIS spot 701
creation tool, using background fluorescence subtraction to compensate for different levels of 702
fluorescent intensity along the z-axis of the stack. The initial minimal spot search size was set 703
to 300x300x1100 nm, slightly smaller than the PSF at 810 nm. No further thresholds or 704
criteria were applied inside IMARIS. Parameters describing the fluorescent puncta, including 705
the intensity at the center, their spatial coordinates, and their diameters, were exported as 706
excel files via the Statistics tab and further analyzed using custom python scripts. In order to 707
separate the PSD95 puncta from false detection of noise, two threshold criteria were applied. 708
1) All spots with a diameter smaller than and equal to the PSF (300x300x1100nm) were 709
rejected. 2) Only spots with a peak intensity larger than the mean of the background intensity 710
plus three times its standard deviation of the background noise, were considered for 711
subsequent analysis. In combination, the thresholds ensure that the spots originated from 712
fluorescent puncta and not false positives generated from noise fluctuations. The background 713
intensity and its corresponding standard deviation was measured for each file in Fiji, by 714
selecting regions without puncta and using the Measure tool to calculate the mean and 715
standard deviation. In order to ensure consistent sampling of the background, mean and noise 716
estimates were made from at least ten different regions at different z positions in each stack, 717
corresponding to an area between 17-27 μm2 (790 - 1210 pixels) and 10 - 40 μm2 (430 - 718
1850 pixels), for the immature and adult SCs, respectively. This approach is limited by the 719
resolution of 2P fluorescence imaging to differentiate individual synapses within clusters and 720
thus may result in an underestimate of absolute synapse density, but allowed for an unbiased 721
estimate of synapse distributions at the two developmental stages. 722
Puncta located on somata were selected from the total pool of detected puncta (described 723
above) using the following criteria: 1) spots were associated with the soma if the peak 724
intensity at the position of the spot center in the Alexa 594 channel was larger than half the 725
maximum of the whole stack, 2) detected spot diameters were greater than the size PSF 726
(300x300x1100nm), 3) spot intensities were larger than the mean plus 3*SD of background 727
intensity of the PSD95-venus channel, measured from within the soma. Puncta from somata 728
22 that showed saturation in the Alexa 594 channel were not included in the analysis.
729
Analysis of spot and dendrite distances: The structure of the dendritic tree, as well as the
730
position of the puncta, were further analyzed using custom python scripts. The dendritic tree 731
was reconstructed with the center of the soma as its root using the python NetworkX package. 732
Fluorescence puncta were considered to arise from the labeled dendrite if they were located 733
within a maximal distance from the center of the dendrite. This distance was taken as the 734
dendritic radius, estimated from IMARIS, plus 200 nm (~HWHM of the PSF810). The 735
estimation of local radius was made from IMARIS binary masks using a threshold of the 736
local contrast (DiameterContrastThreshold) set at three times the standard deviation above 737
the background fluorescence noise. The diameter is then calculated using the Shortest 738
Distance from Distance Map algorithm, which estimates the diameter as the distance from the
739
center of the dendrite to the closest part of the surface determined by the above threshold. The 740
average dendritic radius, using this approach, was found to be 0.66 ± 0.28 (SD) µm for adult, 741
and 0.72 ± 0.27 (SD) µm for immature mice. As this value was larger than that estimated 742
from single-photon confocal imaging, it was only used as a part of the criteria for assigning a 743
fluorescence puncta to a reconstructed dendrite. For each dendritic branch, the number of 744
PSD95 puncta and their distance to the soma surface were calculated. As the data points of 745
the dendrite structure obtained from IMARIS are not homogeneously spaced, the dendritic 746
structure was resampled in 100 nm intervals with the distance for each segment recalculated 747
with respect to the starting point of each corresponding branch from the soma surface 748
(estimated using the binary mask as for the dendrites). Histograms for the distribution of 749
PSD95 puncta and the number of dendritic segments at a given distance from the soma were 750
then generated in 10µm bins and used to estimate the puncta density along the dendritic tree. 751
Cumulative plots were sampled at 1µm intervals. 752
753
Electrophysiology analysis 754
Data analysis was performed using the Neuromatic analysis package (Rothman and Silver, 755
2018) written within the Igor Pro environment (WaveMetrics, Lake Oswego, OR, USA). 756
mEPSCs were detected with a threshold detection method and mEPSC population average is 757
calculated from the mean EPSC response calculated for each SC. All EPSC were baseline 758
subtracted using a 1 ms window before the stimulation artifact. Peak amplitudes were 759
measured as the difference between the baseline level immediately preceding the stimulation 760
artifact, and the mean amplitude over a 100 μs window centered on the peak of the response. 761
EPSC decay kinetics were assessed either as the width of the EPSC at the amplitude one-half 762
of the peak (half-width in ms) or as the weighted time constant of decay (
decay) calculated 763from the integral of the current from the peak, according to: 764