The Characterization of a Mouse Model of
Transient Stroke Using ex vivo MR Microscopy
and in vivo MR Imaging
by
Shuning Huang
Submitted to the Harvard-MIT Division of Health Sciences and
Technology
in partial fulfillment of the requirements for the degree of
Doctor of Philosophy in Health Sciences and Technology
at the
MASSACHUSETTS INSTITUTE OF TECHNOLOGY
February 2009
@
Massachusetts Institute of Technology 2009. All rights reserved.
A uthor ... . ... ...
Harvard-MIT Division of e
h Sciences and Technology
Jan 27, 2009
Certified
by....
Bruce R. Rosen, M.D., Ph.D.
Professor of Radiology and Health Sciences & Technology
Harvard-MIT Division of Sciences & Technology
Director, HST Marfrps Center for Biomedical Imaging, MGH
Thesis Supervisor
Certified by...
Acr rte-d hx
Young Ro Kim, Ph.D.
Instructor in Radiology at HMS
Apistant in Neuroimaging at MGH/Radiology
Thesis Supervisor
Lee Gehrke, PhD
Hermann von Helmholtz Professor of Health Sciences and Technology
Interim Director
Harvard-MIT Division of Health Sciences and Technology
MASSACHIUSETTS INSTIlTE OF TECHNOLOGY
APR 1 5 2009
ARCHIVES
The Characterization of a Mouse Model of Transient Stroke
Using ex vivo MR Microscopy and in vivo MR Imaging
by
Shuning Huang
Submitted to the Harvard-MIT Division of Health Sciences and Technology on Jan 27, 2009, in partial fulfillment of the
requirements for the degree of
Doctor of Philosophy in Health Sciences and Technology
Abstract
Disrupted blood-brain barrier after an ischemic attack can cause vasogenic edema and increase the risk of hemorrhagic transformation. Therefore, early detection and monitoring of BBB damage is important in the pathological understanding and ther-apeutic treatment of stroke. Currently, MR contrast agents have been widely used in clinics for disease diagnosis and treatment evaluation, and in basic research to achieve better anatomical structure visualization and to understand pathological mechanisms of various human diseases in animal models. Thus, the central theme of this thesis to exploit the use of MR contrast agents in the study of ischemic stroke using both in vivo and ex vivo MR techniques. Specifically, the overall goals of this thesis are twofold: (1) to exploit the multiple relaxation mechanisms and varying tissue-dependent affinities of different MR contrast agents for better structure delineation, tissue differentiation, and image contrast manipulation in magnetic resonance microscopy (MRM) staining, and (2) to develop an MRI technique that employs intrinsic water as a biomarker for qualitative and quantitative monitoring of blood-brain barrier (BBB) integrity alter-ation in a mouse model of stroke using an intravascular long-circulating MRI contrast agent.
Despite the great success of MRM in anatomical studies, MRM images based on intrinsic tissue contrast lack the flexibility and target-specificity offered by conven-tional histological staining. Therefore, the first focus of this thesis was on the devel-opment of MRM staining method by utilizing the different tissue relaxation ability and tissue biophysical/biochemical properties of different MR contrast agents. Two common MR contrast agents, Gd-DTPA and MnCl2 were used in this thesis. The
ability of MR contrast agents to increase SNR and enhance image contrast was first tested in a relatively simple in vitro glioma spheroid (diameter - 400
um)
system. We then fully characterized the relaxation mechanisms and tissue-dependent staining properties of these contrast agents in the brain tissue, and demonstrated that their unique relaxation and tissue properties led to differentiated MR staining in the exvivo mouse brains, which greatly enhanced the ability of MRM to delineate tissue
then applied to the Kif2la knockout mouse model for the anatomical phenotyping of the new born Kif2la knockout mice.
The BBB damage is usually detected through the spatial leakage profiles of extrin-sically administrated markers such as staining dyes, fluoresceins, radiolabeled pounds, or gadolinium based compound, which are only possible when BBB is com-promised to the extent that allows extravasation of these markers. It is therefore desirable to develop a technique that allows the early detection of BBB damage. In the second part of thesis, we first presented the theoretical background of measur-ing transvascular water exchange based on a two-compartment water exchange model. Parameters affecting the quantitative BBB water exchange measurement were initially characterized using computer simulations. We then performed graded hypercapnia and Mannitol-induced BBB-opening experiments to test the ability of this novel MRI technique to detect and monitor the changes of BBB integrity and cerebral blood volume (CBV). Upon the characterization of this MRI technique, we measured base-line BBB water exchange and other MRI-derived cerebrovascular parameters in the eNOS knockout mice, and showed that there is basal increase of transvascular wa-ter exchange in addition to the morphological changes in the vasculature of eNOS knockout mice.
After developing and characterizing these ex vivo and in vivo MR techniques, we applied the in vivo MRI BBB water exchange detection technique and the ex vivo MRM staining method to a mouse model of transient stroke. We demonstrated the importance of CBV restoration in the BBB integrity change at acute stage after reper-fusion, and showed that MRM staining may have a great potential in histopathological studies of ischemic brain injury.
Thesis Supervisor: Bruce R. Rosen, M.D., Ph.D.
Title: Professor of Radiology and Health Sciences & Technology Harvard-MIT Division of Sciences & Technology
Director, HST Martinos Center for Biomedical Imaging, MGH Thesis Supervisor: Young Ro Kim, Ph.D.
Title: Instructor in Radiology at HMS
Acknowledgments
I would like to express my deepest thanks to my advisor and mentor, Professor Bruce R. Rosen, for his unlimited support, inspiration and encouragement in the past five years. His great passion and deep insight on scientific research are invaluable to me. More importantly, his great support as a mentor guided me through the years at MIT in science and life. Hopefully his ability to identify the essence of scientific problems will pass on me.
I would like to thank Dr. Young Ro. Kim, who is my thesis co-advisor, for his endless patience, outstanding instruction, and uncompromisingly high academic stan-dard for which he motivated me to work on this interesting thesis project. Without the countless discussions with him and the help from him, I could not go this far
successfully.
I have also benefited a lot from the members of my thesis committee, Professor Alan Jasanoff and Dr. Joseph B. Mandeville. Their invaluable suggestions and deep insights lead my work to a next higher level after each meeting and discussion.
Many thanks to my collaborators at the Martinos Center and MGH for their help and support that made my graduate experience a pleasant one. Dr. George Dai, Dr. Christina Liu, and Philip Liu at the Martinos Center for Biomedical Imaing, Dr. Dmitriy Atochin, Dr. Hyung-Hwan Kim, Seo Kyoung Hwang, Brian Lee at the Massachusetts General Hospital provided so much help and insightful discussions about about my thesis projects.
Last, but by no means least, I would like to express my heartfelt appreciation to my parents, my husband Xiaofeng, and our lovely daughter Rosanna, for their deepest and everlasting love, care, and support.
Contents
1 Introduction 19
1.1 MR contrast agents ... . 19
1.2 Relaxation mechanisms of paramagnetic MR contrast agents in solution 22 1.2.1 Introduction . ... . . . . ... 22
1.2.2 Proton paramagnetic relaxation due to dipole-dipole interaction 23 1.2.3 Proton paramagnetic relaxation due to scalar (contact) coupling 23 1.2.4 Proton paramagnetic relaxation due to Curie relaxation . ... 24
1.2.5 Comparison of the three relaxation mechanisms ... 25
1.3 MR contrast agents in magnetic resonance microscopy ... 28
1.4 Detection of BBB damage due to stroke using MR contrast agent . 29 2 MR Microscopy of glioma spheroid in collagen I matrix 31 2.1 Introduction . ... ... . . . . ... 31
2.1.1 Methods . ... . . . . ... 33
2.1.2 Multicellular tumor spheroid (MTS) and extracellular matrix . 33 2.1.3 Magnetic resonance microscopy . ... ... . 34
2.1.4 Histology . ... ... . . . . ... 35
2.2 Results. ... .... 36
2.2.1 Magnetic resonance microscopy of MTS in collagen I gel . . . 36
2.2.2 Segmentation and 3D visualization of MTS . ... 37
2.2.3 Histopathology ... . ... . 37
2.3 Discussion . ... . . . . ... 41
3 MRM staining of ex vivo mouse brain at 14T
3.1 The development of MRM staining using Gd-DTPA and MnC12 in the wild type C57BL/6 mice ...
3.1.1 3.1.2 3.1.3 3.1.4 3.2 MRM 3.2.1 3.2.2 3.2.3 Introduction . . . .. . Materials and methods ...
R esults .. .. . . .. . . . D iscussion . . . . of kif2la knockout new born mouse brains
introduction . . ... Material and methods . ... Results and discussion ...
4 MRI detection of BBB water exchange: theoretical
4.1 Introduction . . . ...
4.2 Two-compartment water exchange model and BBB measurement . . ...
4.2.1 Two-compartment tissue model . . . .. 4.2.2 Method for water exchange measurement . . . 4.3 Parameters affecting WEI . ...
4.3.1 Effect of imaging related parameters . . . . . 4.3.2 Effect of contrast agent dose . ...
4.3.3 Summary . . ... .. . . . 46 .. . . . 48 . . . .. . 52 .. . . . 59 . . . . . 69 .. . . 69 .. . . . 69 .. . . . 70 background 73 .. . . . 73 water exchange .. . . . 75 .. . . . 75 . . . . . 78 .. . . . 80 .. . . . 82 .. . . . 85 .. . . . 85
4.4 Three-compartment model: effect of transcellular water exchange . . 4.4.1 Three-compartment tissue model . . . . . . . . . .. 4.4.2 Effect of transvascular and transcellular water exchange on CBV
and WEI measurements . .... . ... 4.4.3 Effect of intravascular volume on WEI measurement . . . . 4.5 Summary ...
5 The in vivo characterization of the proposed MRI technique and its application in the eNOS knockout mouse model
86 86 88 90 91 93
5.1 In vivo characterization using Mannitol administration and graded
hy-percapnia ... 5.1.1 Introduction . . . ..
5.1.2 Materials and method . . . 5.1.3 Results . ...
5.1.4 Discussion . ...
5.2 The change of baseline MRI-derived knockout mouse model . . . . 5.2.1 Introduction .. . ... 5.2.2 Materials and methods . . .
5.2.3 Results ... 5.2.4 Discussion 93
94
98 103vascular parameters the
OS
. . . . . 106
. . . . . 106
. . . . . 108
. . . . . 110
.. . . . . 115
6 In vivo BBB water exchange measurement and ex vivo MRM stain-ing of a mouse model of transient ischemic stroke 117 6.1 The detection of BBB water permeability change in a mouse model of transient ischemic stroke . ... 6.1.1 Introduction ... 6.1.2 Material and Method . . 6.1.3 Results . . . ... 6.1.4 Discussion . . . .. 6.2 Ex vivo MRM of ischemic injured logical staining . . . ... 6.2.1 Introduction . . . . 6.2.2 Material and Methods . 6.2.3 Results . . . ... 6.2.4 Discussion .. ... . .... .... .... . . . . 1 17 mouse brains toward . . . . .. . 117 . . . . . . 118 . . . . . . 120 . . . . . . 123 MRM histopatho-. histopatho-. histopatho-. histopatho-. histopatho-. . 125 . . . . . . 125 . . . . . . 126 . . . . . . 128 . . . . . . . 138 . . .
List of Figures
1-1 Effect of different relaxation mechanisms on proton paramagnetic re-laxation (figures are adapted from chapter 3 in [14]). ... . 27
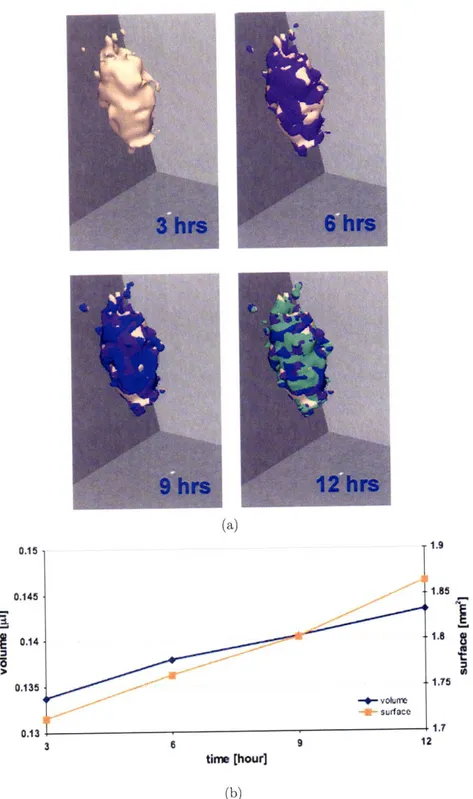
2-1 The images to the left depict the axial view, whereas those to the right show an arbitrary angle. These 2D images confirm the surface heterogeneity that emerges already 12 hrs post placement of the MTS into the gel, and depict a small group of invasive cells (images on the right) that can also be seen in Figures 2-2a and 2-3. On the other hand, images on the left demonstrate that certain parts of the solid spheroid actually grew into the gel (red circle). . ... . 38
2-2 Volumetric rendering and growth dynamics of the MTS in the collagen I matrix at four consecutive time points. (a) The segmented MTS is reconstructed in 3D and the color-coding indicates the growth increase at each time point. The MTS appears to grow anistropic, which may indicate regional heterogeneities in composition of either MTS or mi-croenvironment, or both, and/or point towards a heterogeneous local interaction between cells and gel. (b) MTS volume and surface area are calculated and plotted over time. . ... 39
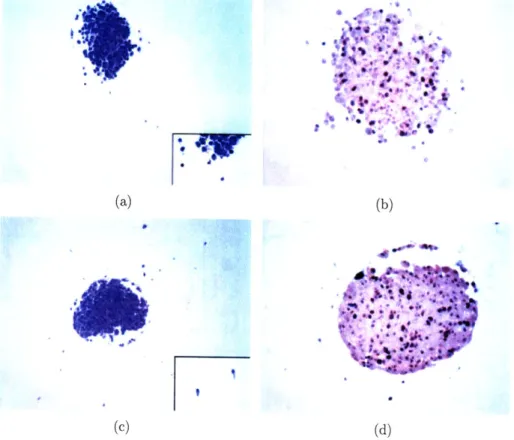
2-3 Histopathology findings, comparing 14T MTS with control. (a). H&E staining of 14T specimen (original magnification x100) showing only a small number of cells infiltrating the gel. Insert shows infiltrating cells in higher magnification (original magnification x400). (b). MIB-1 immunostaining of 14T specimen (original magnification x200), high-lighting cells that are not in GO as dark brown nuclei. (c). H&E staining of control (original magnification x100) showing a large num-ber of infiltrating cells in adjacent gel. Insert shows the infiltrating cells in higher magnification (original magnification x400). (e). MIB-1 immunostaining of control (original magnification x200), highlighting cells that are not in GO as dark brown nuclei. ... . ... ... 40
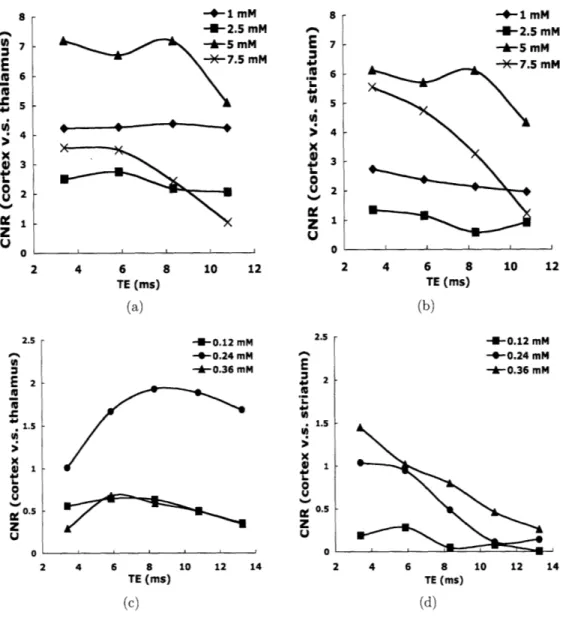
3-1 CNR vs. TE of mouse brains stained with Gd-DTPA or MnC12 at
different concentrations based on 2D MGE sequence. Top panel: brains in 1, 2.5, 5, or 7.5 mM Gd-DTPA, left: cortex v.s. thalamus, right: cortex v.s. striatum; bottom panel: brains in 0.12, 0.24, or 0.36 mM MnC12 showing image contrast between cortex and thalamus on the
left, cortex and striatum on the right. . ... 56
3-2 Coronal sections of mouse brains stained with 5 mM Gd-DTPA (a) or 0.24 mM MnC12 (b). Images were acquired using 3D FLASH sequence
with different flip angles (from left to right, 100, 250, 550, 700, and 90') and TEs (top: TE = 4 ms, bottom: TE = 8 ms). . ... . ... ... 57
3-3 Changes in tissue T1 relaxation time over time for mouse brains stained
with 5 mM Gd-DTPA and 0.24 mM MnCl2. These data demonstrate
that at least three days are needed for the contrast agent to fully pen-etrate brain tissue. To ensure good tissue staining, approximately five days are needed before imaging. . ... ... . . . . . 58
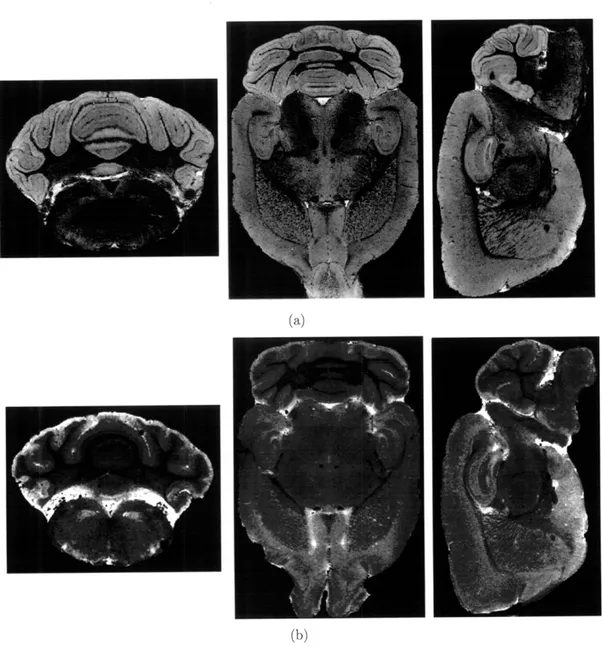
3-4 high-resolution MRM of ex vivo mouse brain stained with 5 mM
Gd-DTPA2 (a) or 0.36 mM MnCi (b) reveals detailed anatomical structurewith different image contrast in certain regions brain, e.g., cerebellum, cortex, and hippocampus. ... ... 60
3-5 high-resolution MRM of ex vivo mouse brain stained with 0.24 mM MnC12 (a) or 5 mM Gd- DTPA (b) reveals detailed anatomical
struc-ture with different image contrast in certain regions brain, e.g., cere-bellum, cortex, and hippocampus. ... . . . 61
3-6 Changes in R1, and R2* values in cerebellar molecular and granular
layers of mouse brain after stained with 0.36 mM MnCl2. The higher ARI and AR2* in granular layer indicate that Mn2+ is possibly
com-partmentalized into neuronal cells in this layer. . ... 65
3-7 Images of ex vivo mouse brains fixed without (a) and with (b) Mn2+ in 4% PFA during transcardial perfusion. Image contrast is not signif-icantly affected by the different staining protocols. . ... . . 66
3-8 Regions in the cerebellum of brains stained with MnC12 or Gd-DTPA
showed correlation with gene expression patterns of Ca2+ binding pro-tein calretinin (calb2) in cerebellum and lectithin cholesterol acyltrans-ferase (Lcat). Calb2 and Lcat expression images were obtained from online Allen Brain Atlas (http://www.brain-map.org) ... . 68
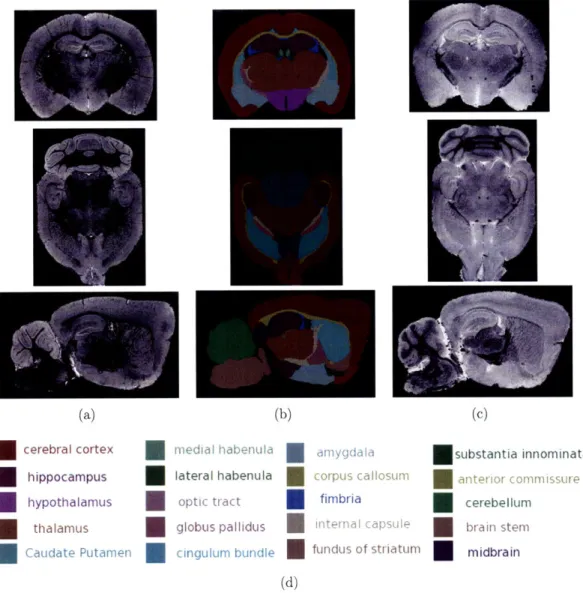
3-9 High resolution MR Images of wild type (top panel) and kif2la KO (bottom panel) mice revealed anatomical differences in multiple brain regions. ... ... .. 71
4-1 Diagram of a cerebral capillary enclosed in astrocyte end-feet. Char-acteristics of the blood-brain barrier are indicated: (1) tight junctions that seal the pathway between the capillary (endothelial) cells; (2) the lipid nature of the cell membranes of the capillary wall which makes it a barrier to water-soluble molecules; (3), (4), and (5) represent some of the carriers and ion channels; (6) the "enzymatic barrier" that re-moves molecules from the blood; (7) the effilux pumps which extrude fat-soluble molecules that have crossed into the cells. . ... ... 75
4-2 Two-compartment tissue model: assuming immediate and complete mixing of protons within each of the compartments . ... 76
4-3 Time course of intravascular MR signal after intravenous administra-tion of Gd-PGC ... ... 80
4-4 Dependency of Vapp on flip angle, TR, and water exchange rate. Mea-surement at larger flip angle reflects true cerebral blood volume; while those at smaller flip angles are sensitive to transvascular water ex-change rate. ... ... ... ... 81
4-5 Dependency of calculated WEI on contrast agent dose (i.e. TR (a) and intravascular Rpost) (b) at different WER. Increasing contrast agent dose and TR can increase the sensitivity of WEI. However, the linearity
relationship between WEI and WEI is reduced as TR increases. . . . 83
4-6 Error in CBV and WEI quantification due to the inaccuracy in flip angles at different transvascular water exchange rates.. .. .... .... 84
4-7 Three-compartment tissue model assuming no water exchange between intravascular and intracellular spaces ... ... 86
4-8 Effect of water exchange between interstitial and extracelllular spaces on CBV ... ... .... ... 89
4-9 Effect of transcellular water exchange on WEI quantification.. .... 90
4-10 Effect of intravascular blood volume on WEI under different BBB water permeabilities. ... ... .. 92
5-1 Experiment Paradigm: intravenous Mannitol administration (a) and
CO2 challenge (b) ... ... 97
5-2 Representative images of mouse brain acquired before (top panel) and after (bottom panel) contrast agent administration (a), and temporal evolution of vascular MRI signal showing the long half life of this in-travascular MRI contrast agent (b), 3D angiography revealing vascular structure (c). ... ... ... .. 99
5-3 Changes of CBV and WEI in response to CO2 challenge: CBV (a) and
WEI (b) ...
...
100
5-4 Changes of CBV and WEI after intravenous Mannitol administration: CBV (a) and WEI (b) ... ... ... 101
5-5 Plots of WEI vs. CBV due to repeated Mannitol boluses (bolus 1, bolus 2, and bolus 3) or CO2 inhalation. . ... 102
5-6 T2-weighted images of a wild type mouse (a) and eNOS-/- mouse (b)
after SPION injection ... ... ... 111
5-7 Comparison of VSI and MVD at cortical and sub-cortical levels be-tween eNOS KO and WT mice. ... .. 112
5-8 Comparison of CBV at cortical and sub-cortical levels between eNOS KO and WT mice. ... ... ... 113
5-9 H&E (magnification: 400x) staining of the cerebral cortex of wild type (a, c) and eNOS knockout (b, d) mice. Morphologically, eNOS knockout mouse is characterized by higher number of blood vessels with smaller vessel size in the cerebral cortex when compared with wild type mouse. ... ... 114
6-1 MRI angiography showing partial reperfusion of previously occluded MCA (a, orange arrow), and representative diffusion-weighted images (DWI) and apparent diffusion coefficient (ADC) maps of mouse sub-jected to transient lhr middle cerebral artery (MCA) occlusion (b) are shown in this figure. ... ... 121
6-2 Changes of CBV and WEI due to transient 1hr MCAo. Animal group with poor CBV restoration showed significantly higher WEI, indicating a dramatically increased BBB water permeability, thus more severe BBB damage than the group with relatively good CBV restoration. . 122 6-3 in vivo T2-weighted images of mice underwent 1hr transient MCAo.
Images were acquired 24 hours after occlusion (a. mouse 1, b. mouse 2).129 6-4 3D ex vivo images of mouse underwent 1hr transient MCAo (mouse 2).
Images were acquired 24 hours after occlusion. Image acquired before Gd-DTPA staining (a) revealed little contrast; while Gd-DTPA stain-ing not only enhanced overall image contrast but also clearly revealed the stroke affected area (b). . ... ... . . . . . . 130 6-5 Axial, horizontal, and sagital view of a stroke mouse brain initially
stained with 5 mM Gd-DTPA. The brain was collected 24 hours after one-hour MCA occlusion. ... ... . .... . . . ... . . . 131 6-6 Axial, horizontal, and sagital view of a stroke mouse brain stained with
0.36 mM MnC12 after the initial staining with 5 mM Gd-DTPA. . . . 132 6-7 Axial, horizontal, and sagital view of a stroke mouse brain initial
stained with 0.36 mM MnC12. The brain was collected 24 hours
af-ter one-hour MCA occlusion ... ... ... 133 6-8 Changes of ex vivo brain tissue R1 and R2 before contrast agent
stain-ing, after staining with 5 mM Gd-DTPA, during washout, and after the second staining. ... . . . . . . . . . 135 6-9 Changes of ex vivo brain tissue R1 and R2 before contrast agent
stain-ing, after staining with 0.36 mM MnC12, and during washout. ... 136
6-10 Comparison of MRM staining (5 mM Gd-DTPA, a) with the conven-tional Nissl stain (b). . . . . ... . . . ... . 137
List of Tables
1.1 Ratio R1 over R2 for dipolar and scalar relaxation contributions in
different motional regimes (table is adapted from chapter 3 in [14]) . 28
2.1 MRI properties of Gd-DTPA and collagen I gel. Measured longitudinal relaxivity of Gd-DTPA at 14 T, corresponding RI changes of collagen I gel after adding 10 mM Gd-DTPA, and the resulting SNR improvement. 36 2.2 To document proliferative activity, we report here the percentage of
MIB-I positive cells for the 14T specimen versus control. The invasion data result from measuring the straight-line distance between an inva-sive cell and a circle drawn around the spheroid. The measurements
are done on a print of a 20x magnification, and represent [arbitrary units]. (See text for more details) ... . 41
3.1 Concentrations of Gd-DTPA and MnC12 staining buffer and ex vivo
brain. Total buffer volume is 5 ml. . ... 54 3.2 Relaxivities of Gd-DTPA and MnC12 in water and ex vivo brain at 14T 54
3.3 Relaxivities of MnC12 in ex vivo brain measured at different field strength: 0.47T, 1.4T, and 14T. The NMRD profile strongly suggests macro-molecule binding of Mn2+ in exercised brain tissue. . ... 54
Chapter 1
Introduction
Magnetic resonance imaging (MRI) has been widely used in clinical diagnosis and basic research. It offers excellent tissue contrasts based on intrinsic tissue T1, T2, or
water diffusion, which allows visualization of various anatomical structures as well as pathological abnormalities. In addition, with the use of MRI contrast agents, we can not only greatly improve MRI's ability for tissue delineation and disease detection, but also open new approaches for understanding the biophysical and pathological mechanisms in different diseases. This thesis focuses on two major applications of MRI contrast agents: the improvement of tissue differentiation ability of ex vivo magnetic resonance microscopy (MRM) and the development of an MRI technique for in vivo detection of blood-brain barrier (BBB) change.
1.1
MR contrast agents
Based on magnetic susceptibility properties, materials can be classified as diamag-netic, paramagdiamag-netic, superparamagdiamag-netic, and ferromagnetic. Atoms in diamagnetic materials have no unpaired electrons, and therefore, no permanent magnetic dipole moments. When placed in a strong magnetic field, diamagnetic materials are repelled by the externally applied magnetic fields, hence they have a weak negative magnetic susceptibility. Unlike diamagnetic material, atoms in paramagnetic materials have permanent magnetic dipole moments due to unpaired electrons. When placed in a
magnet, they will align with the external magnetic field, generating a net magnetic field. However, this net magnetic field can not sustain itself when the external field is removed. Ferromagnetic materials have high magnetic susceptibility and magnetic memory properties. They will remain magnetized even after the external magnetic field is removed. Superparamagnetic materials are composed of very small ferromag-netic crystallites (1-10 nm). Each small crystallite has a net magferromag-netic moment, which is influenced independently by the external magnetic field. These small crystallites function as individual units and behave like atoms in paramagnetic materials. Su-perparamagnetic materials, therefore, are similar to paramagnetic materials in this regard, but their magnetic susceptibilities can be significantly higher than those of paramagnetic materials.
Currently, the majority of MR contrast agents are based on paramagnetic or su-perparamagnetic materials. Most clinically approved contrast agents are different forms of paramagnetic gadolium chelates. Other paramagnetic contrast agents (e.g. MnCl2) and superparamagnetic contrast agents (e.g. superparamagnetic iron oxide
nano particles (SPION)) are currently limited to animal studies. Based on tissue dis-tributions, MRI contrast agents can be divided into different categories. Intravascular (blood pool) contrast agents stay exclusively in the intravascular space, and have a molecular weight of 70,000 and above; extracellular agents are distributed in the ex-tracellular space, and have a relatively short blood half-life; inex-tracellular agents can enter into the intracellular space through different cellular uptake mechanisms. Fur-thermore, contrast agents can also be functionalized to become target specific, which allows in vivo visualization of bio-markers for understanding the disease processes.
These MR contrast agents can affect both T and T2 relaxation times of the tissue. However, because of their inherent magnetic properties, their abilities to affect tis-sue relaxation times are different; theses properties can be utilized for different MRI studies in both clinics and research labs. For example, superparamagnetic MR con-trast agents can produce strong and locally varying magnetic fields, leading to strong
T2 and T2* relaxation enhancements because of their high MRI susceptibility. This
sig-nificant signal reduction in structures containing superparamagnetic contrast agents. This class of contrast agents has now been actively used in molecular imaging to visualize target-specific processes at the molecular level [1]. The superparamagnetic MR contrast agents have also been extensively used in fMRI studies as a blood-pool agents and in various animal models of human diseases [2, 3]. Paramagnetic contrast agents, on the other hand, can cause a predominant reduction in tissue T relaxation times, producing increased MR signal intensity on Ti-weighted images. Paramag-netic MR contrast agents (CA) usually contains metal ions (e.g. Mn2 + and Gd3 + )
with unpaired electrons. These unpaired electrons can interact with tissue protons, causing the reduction in both T1 and T2 relaxation times. Depending on the nature
of these interactions and the strength of the external magnetic field, paramagnetic contrast agents have different relaxation abilities in tissue that can also be affected by their biophysical and biochemical properties in biological samples. Concenquently, paramagnetic contrast agents are widely used in various in vivo studies to help delin-eate pathological changes and evaluate disease treatments. They are also commonly used in the ex vivo studies to the increase signal-to-noise ratio (SNR) and enhance the image contrast for anatomical phenotyping of various transgenic and mutant mouse models [4, 5].
Paramagnetic and superparamagnetic MR contrast agents can affect tissue T and T2 relaxations through the dipole-dipole interaction, scalar coupling relaxation,
and Curie relaxation. For superparamagnetic contrast agents, the high magnetic susceptibility effect can also cause the T2 relaxation enhancement, and even larger T2*
effects. In general, their contributions to tissue T and T2 are usually concentration
dependent, and can be expressed using Equation 1.1, in which ri is the relaxivity of the contrast agent of interest and is normally expressed in the unit of mM-' - S- 1.
In next section, we will discuss in detail mechanisms governing contrast agent T and
T2 relaxation in solution. Understanding the relaxation mechanisms in solution will
help us to interpret the relaxation effect of different contrast agents in tissue.
= + ri [CA] , i = 1, 2 (1.1)
1.2
Relaxation mechanisms of paramagnetic MR
contrast agents in solution
1.2.1
Introduction
Paramagnetic relaxation enhancement comes from two major components: the inner-sphere contribution and the outer-inner-sphere contribution [6, 7]. Inner-inner-sphere relaxation arises from the strong interaction between the coordinative bound-water molecules and the magnetic moment of unpaired electrons in the contrast agent. Water pro-tons that diffuse close to paramagnetic contrast agent can also experience relaxation enhancement without undergoing coordinative binding. This so called outer-sphere relaxation is modulated through translational diffusion, electron spin dynamics, and molecular tumbling. In general, it is less efficient and more difficult to describe be-cause of the stochastic nature of the distances between protons and electrons.
The theory of inner-sphere relaxation was first formulated by Solomon, Bloem-bergen, and Morgan in the 1950s and 1960s [8, 9, 10]. In the SBM approach, the hyperfine interactions (dipole-dipole and scalar coupling) between electrons and pro-tons are modulated by molecular reorientation, chemical exchange between the co-ordinated water and the bulk water, and electron relaxation. In addition, for metal ions with high S values, the interaction between proton spins and the time-averaged electron magnetic moment can also cause significant relaxation enhancement, which is called Curie relaxation. For the three relaxation mechanisms (dipole-dipole, scalar coupling, and Curie), the time dependency of the proton-electron interactions is char-acterized by correlation time (-T), which can be influenced by time constants such as
the molecular tumbling (r), the chemical exchange (FTm), and the electron relaxation (T7). Next three sections are brief summaries of these different paramagnetic relax-ation mechanisms. Detailed descriptions can be found in the following references by Slicter, Solomon, Bloembergen, Morgan, Lauffer, and Review of coordinate chemistry [9, 11, 8, 10, 6, 12, 13].
1.2.2
Proton paramagnetic relaxation due to dipole-dipole
interaction
Dipole-dipole interactions can be modulated by molecular tumbling, chemical ex-change, and electron relaxation. Correlation time (%T) for dipole-dipole interaction can thus be expressed as:
1 11 1
- = + - + -- (1.2)
T
c Tr Ts Tm
where, the time constants were defined in the above section. Equation 1.3 and 1.4 are the Solomon-Bloembergen-Morgan equations governing the dipole-dipole relaxation [11, 8]: for longitudinal relaxation,
2 0 2 ggp2 (S + 1) 3,
R = r+
15 4~ 6 1 + (wi -ws)2 1 2F
S
67
(1.3)1 + (wI + Ws)272
for transverse relaxation,
1 (o 2 2Bgp S(S + 1) 73
R2 =- e B 4F + 1 (i ) + f
15
4L
WS)27c2 1 +WiTc21±
+
6T,
(1.4)
1 + (wI + WS)2Tc + W2 _2
where -7 is the proton gyromagnetic ratio, S is the electron spin quantum number, AB
is Bohr magneton, ge is the electronic Lande factor for the free electron, r is electron-spin distance, w, and ws are proton and electron Larmor frequencies respectively.
1.2.3
Proton paramagnetic relaxation due to scalar (contact)
coupling
The contact or scalar coupling relaxation is through the flip-flop mechanism. By its nature, it is not modulated by the reorientation of the molecule. The correlation time for contact relaxation is modulated by electron relaxation times as well as chemical
change, which can be calculated using the following equation:
1 1 1
- --
(1.5)
Tc Ts Tm
The equation for longitudinal relaxation enhancement is given by Equation 1.6, and Equation 1.7 describes the transverse relaxation enhancement due to contact coupling.
RI = S(S + 1) e (1.6)
1A)
2T2R2 = IS(S + 1) Tie + 2eT (1.7)
where :A is the electron-proton hyperfine coupling constant, T1e and T2e are electron
relaxation times, w1 and ws are proton and electron Larmor frequencies respectively.
For metal ions with long electron relaxation times, contact coupling to R2
relax-ation can be sizable leading to enhanced proton transverse relaxrelax-ation.
1.2.4
Proton paramagnetic relaxation due to Curie
relax-ation
In the presence of an external magnetic field, there exists a small population differ-ence between electron states. This time-averaged electron magnetic moment creates a fluctuating local magnetic field that is independent of electron spin relaxation. This local magnetic field, however, is still modulated by molecular motion and chemical exchange. The proton relaxation due to this local magnetic field is called Curie relaxation, or magnetic susceptibility relaxation. The correlation time for Curie re-laxation will be affected by the molecular rotation and chemical exchange, and can be expressed as:
1 1 1
- - + - (1.8)
7-c r 7Tm
The contribution of Curie relaxation to R1 and R2 can be expressed using the following two equations:
2
P
0 2 2 23
rr RI geB (Sz)2 (1.9) R1 5 4 r6 1 + w, 2 / 2 Wg44 (S + 1)2 3Tr7 52kieB
e Tr (1.10) 547
(3kT)2r6 1 + W27)1 1~(Io 7Ig2B2R2
-(Sz) 24, +
+ T1
37,
47
r6
1+
2 S 2 2 g4(S + 1)-2 37-, 1 o e B ( 47, +-
(1.12)47r
(3kT)2r6 + rHere, 7, is the proton gyromagnetic ratio, AUB is Bohr magneton, ge is the electronic
g factor, r is electron-spin distance, wu is proton Larmor frequencies.
Curie relaxation can be significant if electron relaxation times dominate the cor-relation time in dipolar coupling relaxation.
1.2.5
Comparison of the three relaxation mechanisms
Paramagnetic relaxation enhancement has a strong field dependency. Due to the nature of different relaxation mechanisms, the field-dependent relaxation profiles (NMRD: nuclear magnetic relaxation dispersion) exhibit different characteristics. For dipole-dipole relaxation, the NMRD profile (Figure 1-la) of the longitudinal relax-ation rate, R1, has a plateau at low field. It starts to decrease, then reaches another
plateau, and starts to decrease again as the magnetic field increases. The two in-flection points correspond to
wus"
TdiP,
1 and w, 7cdip 1, respectively, where Tcipis the correlation time governing the dipole relaxation. The NMRD profile of R2 is
similar to that of R1 except that it reaches another plateau at a high field due to
the field-independent term, 4rip in equation 1.4. The NMRD profiles of R1 and R2
due to scalar (contact) relaxation also plateau at a low field, and decrease with in-creasing magnetic field (Figure 1-1b). However, they have only one inflection point at
ws -7Co" 1, in which " is the correlation time for the scalar coupling relaxation.
in equation 1.7 (Figure 1-1b). For Curie relaxation, the magnitude of the induced magnetic moment is proportional to the external magnetic field (Figure 1-1c). There-fore, the contribution due to Curie relaxation is field dependent, and is proportional to the square of the external magnetic field strength. Moreover, Curie relaxation is usually observed at the high magnetic field (> 100 MHz), and its contribution to R1 is often negligible. It is, therefore, more relevant for the T2 relaxation leading to the
line broadening.
In the motion limited regime where wI --~ < 1 (usually true for the field strength
up to 100 MHz),
R
1 equals R2. There are no field-dependent terms.R
1 ismaxi-mum at r7 = w;, then starts to decrease as r continues to increase. On the other hand, R2 continues to increase due to the non-dispersion term. In this regime, for
most paramagnetic contrast agents, the dominant relaxation mechanism is the dipole-dipole relaxation. However, when the electron relaxation time (r7) is longer than the rotational correlation time (r), the contribution of the scalar (contact) coupling to paramagnetic relaxation, especially T2, can be sizable. The contribution of the scalar
coupling term and the dipole term to R2 relaxation is proportional to s/Fr,. For
example, if r, is on the order of 10-10 to 11 second and Tr is on the order of 10-to 10-9 (e.g., Mn2+), the contribution of the scalar coupling to R2 can be 102 to 103
times higher than that of the dipole-dipole interaction. Curie relaxation, on the other hand, is always negligible under this condition.
Curie contribution, in general, becomes higher with increasing field, S, and Tr/Ts
ratio. Outside the motion limited regime, its contribution to R2 can be appreciable.
The contribution of Curie relaxation to R1, on the other hand, is leveled off, and
usually is small compared to the dipole relaxation, due to the fact that wl - is much greater than one in this regime. The relative contributions of dipole-dipole interaction and contact (scalar) coupling to relaxations outside the motion limited regime are dependent on the magnetic field strength as well as the correlation times governing the two processes. In the range where IWsl Ton >
1
> IWi1di p, the contribution from contact coupling is small (equation 1.6). The dominant relaxation mechanism for R17.5
5
79
0.01 0.1 1 10 100 1000
Proton Larmor Frequency (MHz)
17.5
5
-2.5
0.01 0.1 1 10 100
Proton Larmor Frequency (MHz)
0 2.5*10' 510' 7.5"10'
Proton Lartor Frequency squared (MHI)
1000
I.10'
(c)
Figure 1-1: Effect of different relaxation mechanisms on proton paramagnetic relax-ation (figures are adapted from chapter 3 in [14]).
these two mechanisms to R2 relaxation is highly dependent on the correlation times.
For paramagnetic contrast agents with long electron relaxation times (i.e. large scalar coupling correlation times), scalar (contract) coupling relaxation can be big, leading to a high R2/R 1 ratio. On the other hand, if the dipole-dipole coupling is dominant,
the ratio of R2/R 1 is around one. In the region where w Iwlc > 1, the R1 relaxation
is not very effective, leading to a ratio of R2
/R
1 much larger than one. Table 1.1summaries the relative contributions of dipole-dipole and scalar coupling relaxation to
R
1 and R2-Table 1.1: Ratio R1 over R2 for dipolar and scalar relaxation contributions in different
motional regimes (table is adapted from chapter 3 in [14])
WSTc < 1 WSTc > 1 > WITc WITc > 1
R1/R 2 (dipolar dominant) 1 6/7 < 1
R1/R 2 (scalar dominant) 1 <1 1<
1.3
MR contrast agents in magnetic resonance
mi-croscopy
With advances in MRI techniques, MR image resolution has been greatly improved over the past decades, approaching a microscopic level. Magnetic resonance mi-croscopy (MRM) has now become an important tool for anatomical phenotying and morphologic screening of different mouse strains and various transgenic/mutant mouse models [15, 16, 5, 17, 18]. Comprehensive mouse brain atlas of C57BL/6J and 129S1/SvImJ strains [19, 20, 21] have also been established based on MRM im-ages. Despite the great success of MRM in anatomical studies, MRM images based on intrinsic tissue contrast lacks the flexibility and target-specificity offered by con-ventional histological staining. One the other hand, there exist multiple relaxation mechanisms and varying tissue-dependent affinities for different contrast agents. This may potentially help improve tissue differentiation and provide tissue staining flexi-bility resembling that found in conventional histology. We hypothesize that the use
of extrinsic contrast agents in MRM studies can both improve overall signal-to-noise ration (SNR) and help to achieve tissue/cellular specificity in MRM. Using an in
vitro system of Glioma spheroid suspended in a collagen I matrix, we first
demon-strated that the use of MR contrast agent can reduce acquisition time, improve SNR, and allow us to monitor dynamic tumor growth. We then explored the changes of image contrast in mouse brans stained with different MR contrast agents at a 14T MRI system. Our results showed that the distinct tissue relaxation properties and tissue-dependent affinities of different MR contrast agents may be utilized in MRM brain staining to manipulate image contrast for better tissue differentiation and struc-ture visualization. Finally, we applied the protocol developed using normal mouse brain to the Kif2la knockout mouse model for anatomical phenotyping and to a transient middle cerebral artery occlusion (MCAo) mouse stroke model for potential histopathological MRM staining.
1.4
Detection of BBB damage due to stroke using
MR contrast agent
Stroke, the most common cerebrovascular disease, is the third leading cause of adult mortality and morbidity in the United States and developed countries. Of various strokes, ischemic stroke accounts for about 85% of total incidents. After an ischemic insult, the affected brain area first undergoes cytotoxic edema, which is later followed by vasogenic edema. Brain swelling and increased intracranial pressure as a result of cerebral edema are two major causes of mortality in stroke patients. Among various factors, the impairment of blood-brain barrier (BBB) integrity is mainly responsible for interstitial fluid accumulation or vasogenic edema. In previous studies, the quan-tification of BBB permeability was performed using the extravasation of extrinsic markers (e.g., Evans Blue, radio labeled isotopes, Gd-DTPA) [22, 23, 24]. However, these extrinsic markers for measuring vascular permeability are usually not capable of crossing the BBB at acute stages of ischemia, thus, limiting their ability to
ob-serve the progressive weakening of BBB. It is therefore desirable to find biomarkers that allows the detection of early or subtle changes in BBB integrity and permits qualitative and quantitative monitoring of BBB alteration. Thus, the second fo-cus of the thesis is the development of MRI technique that uses intrinsic water as a qualitative and quantitative biomarker to evaluate the overall BBB integrity by utilizing effect of transvascular water exchange on Ti-weighted MRI signal intensity. First, the theoretical background was presented. Parameters affecting transvascular water exchange measurement were determined using computer simulations based on two- and three-compartment models. This new MRI method was characterized using two well-known physiological and pharmacological challenges: graded hypercapnia and systemic administration of Mannitol. Furthermore, we applied this technique to study the baseline BBB water permeability and CBV changes in the eNOS knockout mouse model and the BBB damage resulting from ischemic stroke using a mouse model of transient stroke.
Chapter 2
MR Microscopy of glioma spheroid
in collagen I matrix
2.1
Introduction
High-grade malignant gliomas are characterized by rapid volumetric growth and ex-tensive local tissue infiltration. Despite all efforts to improve diagnostics and therapy, the outcome remains dismal with a five-year survival rate below 3.3% in the main age group of 45-years and older [25]. Since the surrounding tissue is thought to im-pact, and perhaps even guide the tumors invasive patterns, much weight is currently being put on better understanding the dynamic interaction of an expanding brain tumor with its microenvironment. As such, following an interdisciplinary approach, collaborators of this project have previously employed an in vitro glioma multicellu-lar tumor spheroid (MTS) model to investigate the spatial and temporal dynamics of MTS expansion within extracellular matrix environments [26, 27, 28], and started to model them in silico [29, 30, 31]. In these studies, various aspects of the interaction between a growing spheroid system and its environment were studied and mathemat-ically modeled, including extracellular matrix concentration, mechanical forces, and invasion directionality.
In the 1980s, several groups independently acquired microscopic images of dif-ferent biological samples using magnetic resonance microscopy [32, 33, 34]. These
early studies demonstrated the feasibility of magnetic resonance microscopic imaging with its unique sensitivity to tissue water environment. Since then, with continued advances in magnetic resonance imaging (MRI) techniques (incl. stronger gradient coils, improved RF coil design, and more powerful computers), imaging resolution has steadily increased. We are now able to acquire three-dimensional (3D) in vitro images at a high SNR with a resolution approaching the single cell level. This allows us to employ MRI, the imaging modality of choice in vivo, to study these microscopic tumor models also in vitro.
We have previously reported that magnetic resonance microscopy (MRM) enables us to distinguish an MTS of roughly 250 ypm in diameter in a collagen I gel and provides us with a true 3D view of the MTS within the matrix [35]. However, the time required to obtain high-resolution 3D images was considerably long, typically 10 hours. To dynamically monitor MTS growth, we would have to increase the temporal resolution while maintaining a comparable signal to noise ratio (SNR). For this very purpose, we applied Gd-DTPA, the contrast agent widely used in clinics, to the collagen I matrix, achieving not only a significantly shortened MR imaging time down to 3 hours, but also increasing the SNR from 20 to over 40. Therefore, we are able to dynamically monitor both global and local changes of the MTS over a 12-hour period at a temporal resolution of 3 hours and an isotropic spatial resolution of 24 ym. Using conventional immunohistochemistry techniques we were able to confirm cell viability in the MRM sample post imaging, as well as to find patterns of cell proliferation and invasion that seem distinctively different from the controls and thus warrant further analyses.
In summary, we argue that MRM enables us to examine MTS growth dynamically with a true 3D view. The nature of MRM data allows us to segment the spheroids contour out of its microenvironment, reconstruct and visualize its surface, and sub-sequently analyze the MTS distinct 3D dynamics from any selected angle. Tracking tumor expansion non-invasively down to the single-cell scale by using a clinically rel-evant imaging modality should facilitate data integration, and, in combination with in silico modeling, will yield valuable insights into the critical interaction between the
tumor and its microenvironment.
2.1.1
Methods
2.1.2
Multicellular tumor spheroid (MTS) and extracellular
matrix
Cell culture:
The U87mEGFR [35, 36, 37] cell line is cultured in 10 mL of high-glucose Dulbecco's Modified Essential Medium (DMEM; Invitrogen, Carlsbad, CA), supplemented with 1% Penicillin-Streptomycin (PS; Invitrogen), 10% Fetal Bovine Serum (FBS; JRH Biosciences, Lenexa, KS), 0.5 mg/mL Geneticin (Invitrogen) and 20 mM hepes buffer (Invitrogen) in 10 cm diameter Petri dishes (Corning, Corning, NY). Once cells are confluent, they are twice rinsed with Phosphate Buffered Saline (Invitrogen) and detach after the addition of 1 mL Trypsin-EDTA (Invitrogen). After 5-10 min, 9 mL of fresh cell media is added to neutralize the Trypsin. The cell solution is then transferred into a 15 mL centrifuge tube and centrifuged for 5 min at 1200 RPM ( 2 x 10³ m/s 2). After aspirating the supernatant, the cells are resuspended in fresh media at a concentration of 2 x 10⁵/mL.
Multicellular spheroids:
Spheroids are then generated using the hanging droplet method [38], with a drop size of 20 pL, which seeds 4 x 10³ cells in each spheroid to yield a diameter of approximately 400 pm. Briefly, multiple droplets of 20 pL of cell solution are pipetted onto the inside of a 100 mm-diameter Petri dish cover. After placing the cover back on a culture medium-filled dish, the dish itself is placed in the incubator (5% CO2,
37 'C). Surface tension maintains droplet integrity, while gravity pulls cells together at the bottom of each droplet. Cells are left to form spheroids in the incubator for 3 days before they are collected.
Extracellular matrix:
The extracellular matrix (ECM) model is a 1.5 mg/mL bovine collagen type I (Inamed Biomaterials, Fremont, CA) matrix supplemented with 10% FBS, 10% Minimum Es-sential Medium (MEM; Invitrogen), 1% PS, 50 mM sodium bicarbonate (NaHCO3;
Sigma, St. Louis, MO) buffer. For image enhancement, 10 mM Gd-DTPA (Mag-nevist; Berlex, Wayne, NJ, U.S.A.) is added to the collagen solution. To induce polymerization, a few pL of 1 M sodium hydroxide (NaOH; Sigma) are added un-til a neutral pH is reached. The choice of 1.5 mg/mL concentration used here is based on work by Kaufman et al. [26] and represents a reasonable compromise be-tween achieving a sufficiently high viscoelastic modulus while avoiding blocking cell motility altogether.
Sample preparation:
For each sample, we pipette 280 pLs of collagen solution into a pPCR tube (VWR, West Chester, PA). After 15-30 min in the incubator to allow the gel to initiate polymerization, a spheroid is pipetted into this collagen gel, which is then placed back in the incubator for several hours to allow cells to attach properly to the ECM before imaging. To assess the impact of MRM on cell viability, we compared the histology of the MR-imaged specimen with a control sample that was treated identically but for one difference: instead of being imaged overnight, it was kept in the incubator. As soon as the experiment was halted, both the imaged specimen and the control samples were fixed, sectioned and stained.
2.1.3
Magnetic resonance microscopy
We first measured Gd-DTPA (Magnevist) relaxivity in water at 14T (Magnex, 89mm vertical bore, gradient strength 100 gauss/cm, Bruker Biospin System) using the conventional inversion recovery spin echo sequence at three different concentrations
(0.075, 2.5, 5 mM). The Gd-DTPA concentration (10 mM) used here was then deter-mined based on its dosage (0.2 - 0.5 mmol/kg) in MRI mouse model studies [39, 40]
and its relaxivity at 14T.
The MTS in collagen with 10 mM Gd-DTPA was imaged using MRM at 14T. Specifically, we first used a modified FLASH pulse sequence to acquire multi-slice multi-echo (TR/TE = 400/3 8 13 18 ms; FOV = 0.95 cm, Matrix size = 256 x 256; slice thickness = 400 Am; Flip angle= 300) images with an in-plane resolution of 37 x 37 Am2 to localize the MTS in the collagen I gel. A quick Ti measurement was then performed using a modified IR_RARE sequence (TR/TE: 1500/7.86 ms; rare factor: 2; matrix size: 128x128; 10 slices with 0.4 mm slice thickness; FOV: 0.6 cm; TI: 5.621 55.620 105.620 205.620 505.620 1005.620 2005.620 ms). A three-dimension spoiled gradient echo (FLASH) sequence (TR/TE = 20/5.5 ms; FOV = 1.2 x 0.6 x 0.6; matrix size: 512 x 256 x 256; signal was optimized at the Ernst angle) was then used to acquire high-resolution (24 ,m isotropic) microscopic images every three hours for a total of 12 hours. After imaging, the sample was fixed for histopathological analysis as described below. MR images were displayed employing an ImageJ software package [41] and then segmented using the 3D Slicer software package [42]. T1 of the sample and Gd-DTPA relaxivity were fitted using Matlab (Mathwork, Inc., Natick, MA). After the MTS was manually segmented for each time point, its corresponding volume and surface area were calculated.
2.1.4
Histology
The spheroids were harvested and processed as described previously [28], fixed in 10% formalin and embedded in paraffin. Blocks were serially sectioned in 7 Am thick sections and stained with hematoxylin and eosin (H&E). In order to assess the proliferative activity, immunohistochemistry was performed by using cell cycle-unspecific MIBI antibody (which detects the nuclear Ki-67 antibody so that quiescent cells (GO) remain unstained) (DAKO, M7240, USA; 1 : 50 dilution). The so called MIB-1 labeling index was then calculated as the fraction of MIB-1 positive cells from the total number of cells. In addition, images of the test specimen and control were printed. The number of invading cells was counted and the distance of each cell was calculated from a circle drawn at the circumference of the spheroid. The
distances were measured by drawing the shortest straight line from the circle around the spheroid to the invading cells. The measurements are in cm, but do not represent true distance of invasion (due to magnification of the image printed), but rather represent an arbitrary unit by which distances of the cells from the two MTS, i.e.
14T specimen versus control, can be compared.
2.2
Results
2.2.1
Magnetic resonance microscopy of MTS in collagen I
gel
Prior to imaging the MTS, we characterized the rl relaxivity (longitudinal relaxivity) of Gd-DTPA at 14T and the SNR improvement after adding 10 mM Gd-DTPA into the collagen I gel that did not contain any tumor cells. Table 2.1 shows that with 10 mM Gd-DTPA, we were able to reduce the T1 relaxation time of the collagen gel
from around 3000 ms to about 24 ms. The imaging time was reduced from 10 hours to 3 hours with a two-fold increase of SNR (from - 20 to over 40). The original
Table 2.1: MRI properties of Gd-DTPA and collagen I gel. Measured longitudinal relaxivity of Gd-DTPA at 14 T, corresponding
R
1 changes of collagen I gel afteradding 10 mM Gd-DTPA, and the resulting SNR improvement.
Collagen I Gel Collagen I Gel Gd-DTA without 10 mM Gd-DTPA with 10 mM Gd-DTPA
ri (mM-1S- 1) 3.88
± 0.12
R1 (S- 1) 0.003 42.32
SNR 16 42
MRM images of the MTS specimen are shown in Figure 2-1. The time series clearly documents the growth of the spheroid from different angles and at different planes. Even with the 2D view, MRM showed different patterns of cellular growth. Images on the left in Figure 2-1 show cells growing attached to the main body (red circle); while those on the right show some cells seemingly moving away from the main spheroid.
It becomes apparent that with reduced imaging time and increased SNR, MRM can indeed monitor the spatio-temporal expansion of an MTS system.
2.2.2
Segmentation and 3D visualization of MTS
The 3D reconstruction shows rather heterogeneous expansion patterns with rough surface growth areas throughout over the course of the observation period (Figure 2-2a). Intriguingly, once started (orange droplets at the proximal apex of the MTS at time point: 3 hours) glioma cell expansion into the gel seems to give rise to an 'imprinting' process which confirms the 'trailblazer' concept that has been described previously in [28, 26]. Finally, corresponding to the MTS preserved structural viability
(compare with Fig. 3) Figure 2-2b also confirms its functionality in that both MTS volume and surface area increase throughout the observation period.
2.2.3
Histopathology
To semi-quantitatively evaluate the viability of the MTS that has been imaged over 12 hours with 14T MRM, standard immunohistochemistry was performed and the histopathology results were compared with the control (as described above). As documented in Figure 2-3, the imaged MTS not only remains viable overall but, compared to the control tumors the 14T specimen even contained a substantially larger proliferative fraction (see Table 2.2). More specifically, the MIB-1 labeling index for the control is 12.5% (30 positive cells out of 239 counted) as compared to the MIB-1 labeling index for the specimen which is 21.1% (50 positive cells out of 236 cells counted) almost doubled. Furthermore, reviewing comparable sections, in the 14T specimen only 5 cells could be found to invade the gel; conversely, a total of 32 cells invaded the collagen matrix in the control experiment. While the min-max values expectedly (given the difference in n) showed considerably more heterogeneity in the control group, intriguingly, the overall mean invasion distance was with 2.10 versus 2.11 almost identical between 14T specimen and control. We note that a 2nd control experiment confirmed the results.
3 hours
6
hours
9
hours
12 hours
Figure 2-1: The images to the left depict the axial view, whereas those to the right show an arbitrary angle. These 2D images confirm the surface heterogeneity that emerges already 12 hrs post placement of the MTS into the gel, and depict a small group of invasive cells (images on the right) that can also be seen in Figures 2-2a and 2-3. On the other hand, images on the left demonstrate that certain parts of the solid spheroid actually grew into the gel (red circle).
0.15 1.9 0.145 1.85 0.14 1.8 0.135 1.75 -4- volurre .. surface 0.13 1.7 3 6 9 12 time [hour] (b)
Figure 2-2: Volumetric rendering and growth dynamics of the MTS in the collagen I matrix at four consecutive time points. (a) The segmented MTS is reconstructed in 3D and the color-coding indicates the growth increase at each time point. The MTS appears to grow anistropic, which may indicate regional heterogeneities in composi-tion of either MTS or microenvironment, or both, and/or point towards a heteroge-neous local interaction between cells and gel. (b) MTS volume and surface area are calculated and plotted over time.
(a) (b)
(c) (d)
Figure 2-3: Histopathology findings, comparing 14T MTS with control. (a). H&E staining of 14T specimen (original magnification x1OO) showing only a small num-ber of cells infiltrating the gel. Insert shows infiltrating cells in higher magnification (original magnification x400). (b). MIB-1 immunostaining of 14T specimen (origi-nal magnification x200), highlighting cells that are not in GO as dark brown nuclei. (c). H&E staining of control (original magnification x100) showing a large number of infiltrating cells in adjacent gel. Insert shows the infiltrating cells in higher magnifi-cation (original magnifimagnifi-cation x400). (e). MIB-1 immunostaining of control (original magnification x200), highlighting cells that are not in GO as dark brown nuclei.
Table 2.2: To document proliferative activity, we report here the percentage of MIB-1 positive cells for the MIB-14T specimen versus control. The invasion data result from measuring the straight-line distance between an invasive cell and a circle drawn around the spheroid. The measurements are done on a print of a 20x magnification, and represent [arbitrary units]. (See text for more details)
Proliferation Invasion
14T 50 pos/236 21.1% n: 5 Mean: 2.10 SD: 2.07 min-max: 0.50 - 4.70 Control 30 pos/239 12.5% n: 32 Mean: 2.11 SD: 1.6 min-max: 0.30 - 6.50
2.3
Discussion
Our data provide clear evidence that magnetic resonance microscopy can be used to study the dynamic growth of multi-cellular tumor spheroid embedded in a colla-gen I matrix, at a resolution close to the single cell level (Figure 2-1). Adding 10 mM Gd-DTPA to the gel dramatically reduced the image acquisition time without any detrimental impact on cell viability (Figure 2-3). Intriguingly, the glioma cells showed distinct spatio-temporal expansion patterns into the gel with spotty surface expansion across the spheroid and the notion of a 'trailblazer' mechanism that guides cell motility in that single cells follow each other along preformed pathways (Figure 2-2a). The histological results showed surprisingly not only more proliferative activ-ity yet concomitantly also less cells pursuing invasion in the MRM specimen than in the control. Intriguingly, the mean invasive distance was virtually identical which supports the notion that the phenotype itself remained unaffected. This preliminary data support the notion of a "dichotomy" between proliferation and migration, which was experimentally shown by Giese et al. [43] and modeled with a molecular switch-ing mechanism by Athale et al [44] and Zhang et al [45]. The impact of high field MR (14 Tesla in our study) on cancer cells is somewhat controversial. For instance, Santini et al [46] showed that a sinusoidal 50 Hz magnetic field of ImT significantly increased spheroid invasive properties, but had no damage on growth. Short et al. [47] showed that for the two cell lines exposed to a 4.7T field up to 72 hours, there was no change in cell growth rate. On the contrary, Raylamn et al [48] demonstrated
![Figure 1-1: Effect of different relaxation mechanisms on proton paramagnetic relax- relax-ation (figures are adapted from chapter 3 in [14]).](https://thumb-eu.123doks.com/thumbv2/123doknet/14236714.486242/27.918.309.618.161.988/figure-effect-different-relaxation-mechanisms-paramagnetic-figures-adapted.webp)