SOLAR PHOTOVOLTAIC POWER SYSTEMS Paul R. Carpenter and Gerald A. Taylor M.I.T. ENERGY LABORATORY REPORT - MIT-EL 78-007
May 1978
Revised December 1978
PREPARED FOR THE UNITED STATES DEPARTMENT OF ENERGY
Under Contract No. EX-76-A-01-2295 Task Order 37
THE ECONOMIC AND POLICY IMPLICATIONS OF GRID-CONNECTED RESIDENTIAL SOLAR
PHOTOVOLTAIC POWER SYSTEMS BY
Paul R. Carpenter Gerald A. Taylor
ABSTRACT (Revised)
The question of the utility grid-connected residential market for photovoltaics is examined from a user-ownership perspective. The price is calculated at which the user would be economically indifferent between having a photovoltaic system and not having a system. To accomplish this, a uniform methodology is defined to determine the value to the
user-owner of weather-dependent electric generation technologies. Two models are implemented for three regions of the United States, the first of which is a previously developed simulation of a photovoltaic
residence. The second is an economic valuation model which is required to translate the ouputs from the simulation into breakeven array prices. Special care is taken to specify the input assumptions used in the
models. The accompanying analysis includes a method for analyzing the year-to-year variation in hourly solar radiation data and a discussion of the appropriate discount rate to apply to homeowner investments in
photovoltaic systems.
The results of this study indicate that for the regions
characterized by Boston, Omaha, and Phoenix, under the assumptions noted, photovoltaic module breakeven costs for the residential application are
in the range of $.68, $.43 and $1.27 per peak system watt respectively (.42, .24, .89 per peak module watt).
FOREWORD TO REVISED VERSION December 1978
Appendix A to this volume presents revised values for breakeven capital costs for photovoltaic modules in residential applications. In the main body of the report, specifically in Section V, the measure for BECC, dollars/watt (peak), as reported in this paper is in delivered, system or effective peak watts (module). The use of dollars/watt (peak)
is somewhat ambiguous in the literature; it is necessary to point out that this measure is not dollars/watt (peak) of module output. The methodology used in this study consistently focuses upon delivered energy. The system NPV figure is the value of the energy delivered by the particular system under consideration - the valuation procedure per se is not sensitive to the efficiency of the system which delivers the energy.
Conversion from a dollars/watt (peak) system is a straightforward algebraic process. The dollars/m2 figure is the same in both
situations; the question relates to the number of watts of delivered energy at either the system or the module; and this question is merely which n(efficiency), system or module, to use in the conversion:
Dollars/watt (peak) system= Dollars/m2
nsystem x 1000w/m2 Dooars/watt (peak) module = Dollars/m2
nmodule x 1000w/m2
Since n(system) is used multiplication of the values listed in this report by n(system)/n(module) will yield a dollar value for module peak watts.
The results presented in Aopendix A incorporate the results of research in cell efficiency, increased information on balance of systems costs and results of discussion and comment concerning the May 1978 version of this paper. For this reason these values should be used to represent current best estimates of breakeven capital costs for
4
TABLE OF CONTENTS
Page
Abstract 2
Foreword to Revised Version 3
Table of Contents 4
Table of Tables 7
Table of Figures 9
Acknowledgment 10
I. Solar Photovoltaics as an Electric Power Source 11
1.1 Introduction 11
1.2 History of the Federal Photovoltaics Program 13 1.3 Photovoltaic Market Segments and Their
Relationship to the Federal Plan 17
1.4 Scope of This Study 22
1.5 Footnotes 24
II. A Uniform Economic Valuation Methodology 27
2.1 Introduction 27
2.2 Economic Valuation of Photovoltaics 29 2.3 Unique Features of Photovoltaics Which
Affect Economic Valuation 30
2.4 Previous Approaches to Economic Valuation 32 2.5 Suggested User-Owned Economic Valuation
Methodology 38
TABLE OF CONTENTS (continued)
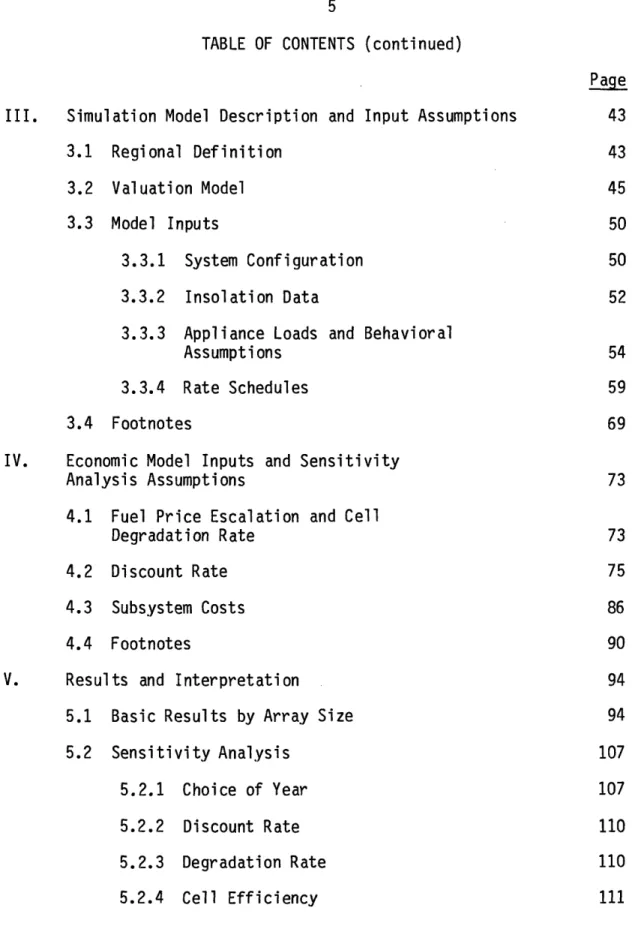
III. Simulation Model Description and Input Assumptions 3.1 Regional Definition
3.2 Valuation Model 3.3 Model Inputs
3.3.1 System Configuration 3.3.2 Insolation Data
3.3.3 Appliance Loads and Behavioral Assumptions
3.3.4 Rate Schedules 3.4 Footnotes
IV. Economic Model Inputs and Sensitivity Analysis Assumptions
4.1 Fuel Price Escalation and Cell Degradation Rate
4.2 Discount Rate 4.3 Subsystem Costs 4.4 Footnotes
V. Results and Interpretation
5.1 Basic Results by Array Size 5.2 Sensitivity Analysis 5.2.1 Choice of Year 5.2.2 Discount Rate 5.2.3 Degradation Rate 5.2.4 Cell Efficiency Page 43 43 45 50 50 52 54 59 69 73 73 75 86 90 94 94 107 107 110 110 111
6
TABLE OF CONTENTS (continued)
Page V. (continued)
5.2.5 Fuel Price Escalation 111
5.2.6 Subsystem Costs 113
5.3 Comparison of Results to Utility Studies 114
5.4 Footnotes 117
VI. Policy Implications and Conclusions 119
6.1 New Information 119
6.2 Implications for the Long-Term Markets 119 6.3 Implications for Systems Tests and
Applications (ST&A) Policy 122
6.4 Utility Response and Interactive Models:
Further Research 123
6.5 Conclusion 125
6.6 Footnotes 129
VII. Appendices 131
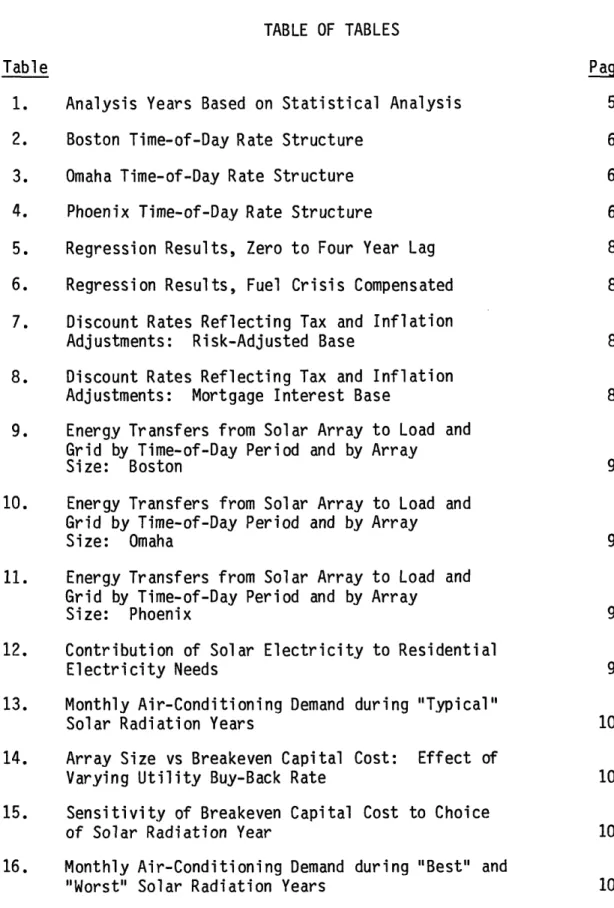
Table Page 1. Analysis Years Based on Statistical Analysis 53
2. Boston Time-of-Day Rate Structure 63
3. Omaha Time-of-Day Rate Structure 64
4. Phoenix Time-of-Day Rate Structure 65
5. Regression Results, Zero to Four Year Lag 82 6. Regression Results, Fuel Crisis Compensated 82 7. Discount Rates Reflecting Tax and Inflation
Adjustments: Risk-Adjusted Base 87
8. Discount Rates Reflecting Tax and Inflation
Adjustments: Mortgage Interest Base 88
9. Energy Transfers from Solar Array to Load and Grid by Time-of-Day Period and by Array
Size: Boston 95
10. Energy Transfers from Solar Array to Load and Grid by Time-of-Day Period and by Array
Size: Omaha 96
11. Energy Transfers from Solar Array to Load and Grid by Time-of-Day Period and by Array
Size: Phoenix 97
12. Contribution of Solar Electricity to Residential
Electricity Needs 98
13. Monthly Air-Conditioning Demand during "Typical"
Solar Radiation Years 100
14. Array Size vs Breakeven Capital Cost: Effect of
Varying Utility Buy-Back Rate 103
15. Sensitivity of Breakeven Capital Cost to Choice
of Solar Radiation Year 108
16. Monthly Air-Conditioning Demand during "Best" and
8
TABLE OF TABLES (continued)
Table Page
17. Effect of Varied Discount Rate on Breakeven Cost 110 18. Sensitivity of Breakeven Cost to Altered Degradation
Rates 111
19. Sensitivity of Breakeven Cost to Increased
Cell Efficiency 112
20. Sensitivity of Breakeven Cost to Altered
Fuel Price Escalation Rate 112
21. Sensitivity of Breakeven Cost to Subsystem
TABLE OF FIGURES
Figure Page
1. Photovoltaic Applications and Breakeven Costs 20 2. Regional Definition-Factor Analysis Process 44 3. Composite Solar Energy Planning Regions 46
4. Simulation Model Scheduling Heuristic 48
5. System Configuration Baseline Assumptions 50 6. Appliance Use and Behavioral Assumptions 55
7. Sample Appliance Load Vectors 58
8. Formula for Revenue-Return Equalization 67 9. Rate Structure Adjustment Calculation for Boston 68
10. Alternative Degradation Rate Scenario 74
11. Contribution of Solar to Residential Load vs
Array Size 99
12. Air-Conditioning Demand during Selected "Typical"
Insolation Years. 101
13. Breakeven Capital Cost vs Array Size: Boston 104 14. Breakeven Capital Cost vs Array Size: Omaha 105 15.. Breakeven Capital Cost vs Array Size: Phoenix 106 16. Photovoltaic Applications and Breakeven Costs 120 17. Proposed Model Interaction for Utility Response
10
ACKNOWLEDGEMENT
While many individuals have greatly contributed to the development of this study, several deserve special recognition. The authors would especially like to thank Jesse Tatum of the MIT Energy Laboratory for his many hours devoted to the development of the simulation model used to generate the results herein. Others who made special contributions include Ms. Susan Finger, Mr. Drew Bottaro, Dr. Lawrence H. Linden, and Dr. Neil Goldman of the MIT Energy Laboratory Photovoltaics Project, and Dr. Jeffrey L. Smith of the Jet Propulsion Laboratory LSA Project, and Alice Sanderson, whose typing efforts were greatly appreciated. Finally we wish to thank Professor Henry Jacoby, our Sloan School thesis adviser, for his many helpful comments and criticisms and, above all, Dr. Richard Tabors, manager of the MIT Energy Laboratory Photovoltaics Project, for his unfailing support and assistance and his Vermont mountain retreat.
Paul Carpenter
I. SOLAR PHOTOVOLTAICS AS AN ELECTRIC POWER SOURCE 1.1 INTRODUCTION
Among the emerging technologies which may provide solutions to current energy problems, photovoltaic power is, perhaps, the most
unique. Without moving parts or intermediate thermal conversion, the sun's radiation is converted directly into usable electric power.
Because of the peculiar properties of the semiconductor materials which make up photovoltaic cells (often called "solar cells"), incident
sunlight creates an electrical potential which can be used to generate a flow of electrons, or electric current. Individual cells, each creating a small amount of electricity, can be linked to produce energy in amounts suitable for myriad practical applications including central power
(utility) stations.
The characteristics of any technology naturally have a great deal of impact upon its development and practical application. The nature of photovoltaic cells is such that there appears to be great potential
advantage in their application. On the other hand, there are substantial practical problems which mitigate the technology's positive aspects and there appear to be some disadvantages as well that have not yet received much attention. While, for instance, the modularity of PV cells and the concomitant absence of significant economies of scale imply that energy can be produced in small quantities without high costs per unit output, the electricity produced is direct current which must be converted
12
to alternating current for most conventional uses by power-conditioning equipment (inverters). Inverters do exhibit scale economies and thus the advantages of modularity are offset by the need for power conditioning. Another advantage of the PV technology is its lack of moving parts which makes it ideal for remote or residential applications where generating
equipment must operate for long periods while unattended. But such unattended applications require module designs which are both very safe and durable and the expense of achieving such designs is significant. Finally PV technology is frequently advocated as an ideal energy source because of the absence of such negative externalities as pollution. While it is true that PV devices produce energy without emitting
pollutants there are other problems associated with widespread use. These problems include occupational and safety hazards during production
and maintenance of photovoltaic cells, and extremely heavy energy consumption in the production of the semiconductor materials.1
The process of selecting development applications which economically achieve a favorable balance of these positive and negative
characteristics is bound to be a difficult one requiring not only careful analysis but also a well-directed and documented testing program. Given a catalogue of the technology's characteristics a logical first step in
such a selection process might be to identify applications for further study which exhibit positive aspects of photovoltaics while avoiding, insofar as possible, negative aspects. Since there is so
much uncertainty surrounding photovoltaic development (as with any new technology) both in terms of production and potential markets, another criterion in the selection process might be an application's potential for an orderly progression both in the acquisition of practical
experience with the technology and market and production growth. A final factor to be considered, especially from a governmental policy
perspective, is an application's commercial potential, i.e. capability to compete on its own in the marketplace. Other things being equal, the more rapidly an application achieves market competitiveness, the better for the taxpayer since governmental development or commercialization
subsidies should no longer be necessary for a competitive product.
Before turning to a discussion of the relationship between specific photovoltaic applications or market segments and their
economic/commercial potential (and how one goes about analyzing that potential), a short digression on the history of the Federal
Photovoltaics Program is in order. This history is important because it has been perhaps the most aggressive of the technology development
programs at the Department of Energy since nuclear power, and its nature has broad implications for the kinds of information required from the economic analysis of photovoltaic applications.
1.2. HISTORY OF THE FEDERAL PHOTOVOLTAICS PROGRAM
Since its inception in the early 1970s, the Photovoltaics Program within the Energy Research and Development Administration (now Department
14
of Energy) has focused its effort on driving the costs of photovoltaic devices down. This approach is manifested in several program objectives, actors, and concepts.
The specific objectives of the National Photovoltaic Conversion Program were first articulated at the NSF/RANN Cherry Hill, New Jersey Conference in the fall of 1973. Program goals were here for the first time described in terms of array costs. "It is anticipated that
large-scale application of solar photovoltaic technology will become economically viable by approximately 1980. This will be made possible by the reduction of solar array cost to less than $0.50/watt (peak)."2,3 At the time this number was not supported with economic analysis of potential applications. It was later established by ERDA as its 1986 Photovoltaics Program goal.4 Given the state of knowledge of
photovoltaic technology and its applications at the time, the Cherry Hill statement of program objectives was not unreasonable.* But much faith has been placed in that number as a target for economic value,
independent of any particular applications environment or region. Given the history of the photovoltaic conversion technology as a satellite power system, it is not surprising that many of the actors in the Photovoltaics Program were also actively involved in the space
*Since $0.50/watt(p) represented a good estimate of 5/kWh translated to photovoltaic array terms.
program. The Jet Propulsion Laboratory through its Low Cost Silicon Solar Array Project is one such organization that now has primary responsibility for the development of a low-cost silicon technology.5 "The primary goal of the LSSA Project is to develop by 1986 the
technological and industrial capability to produce silicon solar
photovoltaic arrays at a rate of more than 500 peak MW per year, having an efficiency of greater than 10 percent and a 20-year minimum lifetime, at a market price of less than $500 per peak KW, ($0.50/watt(peak))."6 Thus, the JPL program is utilizing its experience in space program management to generate technical and production advances (supply-side phenomena) to meet the 1986 Cherry Hill/ERDA objective. The Aerospace Corporation, another space program actor, has performed a set of "Mission Analyses" of photovoltaic applications in residential, commercial and central station applications which brought together first-order technical
performance and financial analyses. 7 In the majority of the research and development effort to date the program has placed primary effort on attainment of the goals, a legacy of the space program, and secondary emphasis on the costs of accomplishing this research and development.
Given the program objectives and actors it is not hard to understand the concept behind the commercialization of photovoltaics in the program, a concept that has been characterized as a "market-pull" philosophy. The essence of this concept is that government purchases of photovoltaic cells, independent of their use in particular applications, is enough of a stimulus to drive the photovoltaic industry down the experience curve and thus meet the 1986 cost goals. This was articulated in the 1976 Photovoltaics Program plan:
16
a stimulus to drive the photovoltaic industry down the experience curve and thus meet the 1986 cost goals. This was articulated in the 1976 Photovoltaics Program plan:
It is expected that ERDA purchases of approximately 600 KWe through FY78, coupled with purchases by other federal agencies with ERDA's support, will result in a factor of 4 reduction in the present cost of silicon-based solar cells...A total government purchase of approximately 11 MW through FY 1983 is planned. Costs for silicon
solar cell arrays are expected to drop to $1000 per peak KW by 1984.8
"Market-pull" is a concept that is rational given the objectives and actors described above, especially in a situation where achieving cost goals is the primary objective. At present, however, there appears to be a greater realization that future strategies for the commercialization of photovoltaics require that attention be focused on the marketplace,
particularly the marketplace in which electric utilities reside.
More recently, in the latest National Photovoltaic Program Plan,9 an even more aggressive eight-cycle, eight-year photovoltaic procurement initiative has been proposed that would cost the government approximately $380 million. The purpose of this new initiative is to accelerate by several years the diffusion of photovoltaic devices into the
markeplace.l0 The "market-pull" concept has been institutionalized in terms of the so-called PRDA (Program Research and Development
Announcement) which is the mechanism whereby the government solicits proposals from private sector interests to be recipients of these
new plan includes the same program goals as described above but they are now time-phased as follows.11
Near-term
To achieve prices of $2 per peak watt (1975 dollars) at an annual production rate of 20 peak megawatts in 1982.
· Mid-term
To achieve prices of $0.50 per peak watt, and an annual production rate of 500 peak megawatts in 1986.
· Far-term
To achieve prices of $0.10 to $0.30 per peak watt in 1990, and an annual production rate of 10-20 peak gigawatts in 2000. 1.3. PHOTOVOLTAIC MARKET SEGMENTS AND THEIR RELATIONSHIP TO THE
FEDERAL PLAN
Several attempts have been made to attach particular applications to the set of time/price horizons above. Before discussing the evidence which has accumulated to date, let us briefly consider the variety of potential photovoltaic markets and their characteristics.
While there are myriad potential uses for photovoltaics, most applications seem to fall into three major categories: remote applications, grid-competing (or load-center) applications, and grid-connected applications.
Remote Applications
This set of applications is composed of small-scale stand-alone systems that take advantage of the low maintenance and modularity
18
features of the technology. They include satellites, ocean buoys, cathodic protection, micro-scale agricultural pumping and other
military-related applications. As can be seen, this set is made up of applications which heretofore had no (or very expensive) alternative energy sources. This fact means that these users are willing to pay a very high price for photovoltaic power and thus all current production is geared toward these uses. The remote market is not important with
respect to the world's energy problems and in relative terms the market is very small.
Grid-Competing Applications
This set of applications includes those load centers which would otherwise need to be connected to the utility grid. A typical
configuration would be a school or industrial plant with a large set of photovoltaic arrays supplemented by backup power from a diesel generator or other source. The category could also include a stand-alone house with some form of solar heating and cooling and electrical and thermal
storage system for uninterrupted use. As one might guess, this set of applications may also be somewhat limited in market size due to the relatively low marginal cost of attaching oneself to the utility grid. To operate independent of the grid would imply the payment of a "premium"
in the form of high capital costs in order to be totally independent. Grid-Connected Applications
Since nearly all electricity generated in the United States is produced by large electric utilities, if the objective of the
commercialization of photovoltaic technology is to replace some of this conventional generation capacity, then the long-term market for
photovoltaics is the grid-connected market. This set includes residences, schools, industrial and commercial establishments (in dispersed mode) as well as central station photovoltaic applications. There appear to be few technical problems associated with the interplay between on-site photovoltaic power as it is fed back into the grid and the use of electricity from the grid when the solar power is
insufficient.12
It was mentioned above that several attempts have been made to attach various applications to the time/price framework of the National Plan. Figure 1 represents a plot of the various applications which have been studied and the "competitive" prices associated with those
applications. As can be seen, there are significant gaps in the knowledge,1 3 particularly with respect to breakeven prices of
grid-connected applications, not to mention knowledge of the potential quantities demanded at these prices. As yet, no adequate measure of potential quantities demanded in the grid-connected market has been
developed. As will be suggested later, one way to approach this question is to examine the effects of added penetration on utility system costs. While this method does not estimate a future demand curve, it does offer a means of defining demand potential. The best information available to date on the effect of photovoltaics on the utility system has been
20
Cathodic Protection of Shallow Oil Wells
Cathodic Protection of Pipelines Microwave Repeaters Cathodic Protection of Deep Oil Wells
Current Array Prices
Micro-Scale Pumping (LDCs)
Remote Water Pumping (U.S.)
Remote Outdoor Lighting
Central Station (Phoenix)
-Central Station (Boston)
-Central Station (Miami)
0
u)
I"U-)
O
30 o o 4-A co Ui U" * S.-C0
'N LU I- zr-UL / C( C)L
u
>
I-,:
cs cmz
CD_
C)3.. (,. 0. .-LJ LJz
Cu -cD C) iY0
4-(n t, E 4-' 0 cn ; a) U L.) C o)L V) 0 SL r X Co
Vi) /provided by the work of General Electric14 and Westinghouse1 5 with regard to the effect of central station photovoltaic plants on utility reliability and thus, costs. This valuation of the central station
application was a reflection of the study authors' orientation as well as the focus of the Federal Program several years ago. The results of the central station studies show that photovoltaic power plants improve utility system reliability and thus do not require 100% backup; however, the breakeven prices calculated were low relative to the Program goals.
It should be noted that these studies considered the residential
application, but their analysis required utility ownership of the systems and thus the framework in which their financial analysis was performed failed to capture many of the potential advantages of residential,
user-owned systems which will be elaborated upon later. General Electric, in its Requirements Assessment study, recognized this fact:
It is not possible to define the breakeven capital cost for a user-owned PEPS (Photovoltaic Electric Power System) plant in the same way as has been done for utility-owned plants. This is because the economic incentive to purchase and install such a plant lies in the savings in purchased electricity costs accruing to the user.16 Given the importance of the grid-connected market to the achievement of the long-term goals of the Photovoltaics Program, it is argued here that before the Nation commits itself to a very large technology commercialization enterprise such as the initiative proposed, several questions need to be answered about the economics of the long-term market for photovoltaics.
22
· Are there advantages of user-owned, residential systems that are reflected in the value of the system to the user?
. How should one go about valuing the worth of a photovoltaics system to a user/owner?
. Should the residential market be pursued by an aggressive commercialization program? Does this application minimize the
subsidy required to accelerate photovoltaics penetration in the long-term market?
. What is the impact of these systems on electric utilities and how will/should they respond?
1.4. SCOPE OF THIS STUDY
The purpose of this study is twofold. First, it examines the question of the dispersed, residential market for photovoltaics from a regional and user-ownership perspective. It attempts to determine at what price the user would be economically indifferent between having a photovoltaic system and not having a system. To accomplish this, the study first defines a uniform methodology for examining the value to the user-owner of weather-dependent electric generation technologies. This methodology is general enough to be applied to other on-site technologies
such as wind systems. To make this calculation, two models are implemented for three regions of the United States. The first is a
simulation model of a photovoltaic residence, developed by Jesse Tatum of the MIT Energy Laboratory.18 The second is an economic valuation
model, required to translate the outputs from the simulation into breakeven array prices. Special care is taken to specify the input assumptions used in the models. The accompanying analysis includes a method to analyze the year-to-year variation in hourly solar radiation data, a discussion of the appropriate discount rate to apply to homeowner investments in photovoltaic systems, and a disucssion of the use and determination of marginal cost based rate structures for PV system valuation. Second, this study evaluates the implications of the resulting partial equilibrium price1 7 for the Federal Photovoltaics Program and it identifies a program of follow-on research to fill more completely the gaps in the knowledge of the long-term market for
photovoltaic cells.
The normative nature of the results of this study must not escape the notice of the reader. The valuation will be derived on the basis of assumptions about rate structures and consumer discount rates.
Specifically, the rate structures employed are based upon marginal costs (see Section 3.3.4) and the discount rates used were developed through application of the capital asset pricing model (see Section 4.2) which assumes rational consumers, and perfect financial markets. Insofar as these assumptions about how utility companies and consumers ought to behave prove unfounded, the results resting upon them will also be in error. This fact is, however, typical of any analysis which attempts to explain consumer behavior purely in economic terms.
24 1.5 FOOTNOTES
1. See Neff, Thomas, Social Cost Factors and the Development of Photovoltaic Energy Systems, MIT Energy Laboratory, Cambridge, MA
(forthcoming).
2. The $0.50/watt(peak) goal is in contrast to current array costs of $10.00 to $15.00 per watt(peak). One kW (peak) corresponds to the
amount of solar radiation falling on one square meter of a
horizontal surface on a clear day with the sun directly overhead at one atmosphere pressure and at 280C.
3. Bleiden, H.R., "A National Plan for Photovoltaic Conversion of Solar Energy," in Workshop Proceedings, Photovoltaic Conversion of Solar Energy for Terrestrial Applications, Vol. 1, October 23-25, 1973, Cherry Hill, NJ, NSF-RA-N-74-013.
4. Energy Research and Development Administration, Division of Solar Energy, Photovoltaic Conversion Program Summary Report, Washington, D.C., November 1976.
5. Although the LSSA Project charter is now being expanded to encompass nonsilicon technologies as well.
6. Low-Cost Silicon Solar Array Project, "Division 31 Support Plan for FY77 Project Analysis and Integration Activities," Jet Propulsion Laboratory, California Institute of Technology, Pasadena, CA, April 25, 1977.
7. Aerospace Corporation, Mission Analysis of Photovoltaic Solar Energy Conversion, for ERDA/Sandia, SAN/1101-77/1, March 1977.
8. ERDA, op. cit., p. 2.
9. U.S. Department of Energy, Division of Solar Technology, National Photovoltaic Program Plan, Washington, D.C., February 3, 1978. 10. Information memorandum, December 21, 1977, to the Undersecretary
from the Acting Program Director for Solar, Geothermal, Electric, and Storage Systems concerning "A Strategy for a Multi-Year
Procurement Initiative on Photovoltaics, (Acts No. ET-002). 11. U.S. Department of Energy, op. cit., pp. 6-7.
12. For discussion of the technical aspects of grid connection, see Office of Technology Assessment, U.S. Congress, Application of Solar Technology to Today's Energy Needs, Washington, D.C., 1977, Vol. I, Chapter V.
13. The previous photovoltaics market assessment studies known to the authors include the following:
Remote Market:
Aerospace Corporation, Mission Analysis of Photovoltaic Solar Energy Conversion, for ERDA/Sandia, SAN/1101-77-1, March 1977, Vol. II,
"Survey of the Near Term (1976-1986) Civilian Applications in the U.S."
BDM Corporation, Photovoltaic Power Systems, Market Identification and Analysis, Draft Final Report, November 1977, DOE Contract EG-77-C-01-1533.
BDM Corporation for FEA Task Force on Solar Energy
Commercialization, DOD Photovoltaic Energy Conversion Systems Market Inventory and Analysis, Washington, D.C., June 1977.
InterTechnology Corporation, Photovoltaic Power Systems, Market Identification and Analysis, Draft Final Report, 1977, DOE Contract EG-77-C-01-4U22.
MIT Lincoln Laboratory, The Economics of Adopting Solar Photovoltaic Energy Systems in Agriculture, Report #COO/4094-2, July 1977.
Smith, Douglas V., Photovoltaic Power in Less Developed Countires, MIT Lincoln Laboratory, Lexington, MA, March 1977.
Grid-Connected or Grid-Competing Market:
Aerospace Corporation, Mission Analysis of Photovoltaic Solar Energy Conversion, for ERDA/Sandia SAN/1101-77-1, March 1977, Vol. III,
"Major Missions for the Mid Term (1986-2000)."
General Electric Corporation, Conceptual Design and Systems Analysis of Photovoltaic Systems, GE Space Division for ERDA/Sandia,
Albuquerque, NM, March 1977.
Westinghouse Electric Corporation, Conceptual Design and Systems Analysis of Photovoltaic Systems, ERDA Contract E(11-1) 2744, April 1977.
With regard to residential applications, Westinghouse limited their analysis to stand-alone (non grid-connected) houses. The work of the Aerospace Corporation is perhaps the pioneering work with
26
busbar costs fails to capture many of the important features of user-ownership of the PV devices. The valuation was performed by comparing the rooftop arrays (performance of which was determined by hourly simulation) with a single type of conventional utility
generation plant (i.e. the value of the PV was not rate structure determined). See Chapter II for further discussion of methodologies. 14. General Electric Co., Requirements Assessment of Photovoltaic
Electric Power Systems, RP 651-1, for Electric Power Research Institute by GE Electric Utility Systems Engineering Department, Schenectady, NY, Draft Final Report, June 1, 1977.
15. Chowanic, C.R., Pittman, P.F., and Marshall, B.W., "A Reliability Assessment Technique for Generating Systems with Photovoltaic Power Plants," IEEE PAS, April 21, 1977.
16. General Electric Co., Requirements Assessment of Photovoltaic Electric Power Systems, op. cit.
17. By "partial equilibrium price" we mean the price at which
photovoltaics will initially penetrate the market. (Note that this is not the standard meaning of "partial equilibrium" as used in formal economics.) It is assumed that such initial penetrations will have minimal effect on existing electric utilities. See
discussion of utility response to larger penetrations in Section 6.4. 18. See Tatum, Jesse, A Parametric Characterization of the Interface
Between Dispersed Solar Energy Systems and the Utility Network, unpublished MIT master's thesis (forthcoming); Kaplow, R., Tabors, R., Tatum, J., Photovoltaic/Hybrid Simulation Model for
Grid-Interconnected Residential Applications, MIT Energy Laboratory, Cambridge, MA (forthcoming).
II. A UNIFORM ECONOMIC VALUATION METHODOLOGY 2.1 INTRODUCTION
As General Electric mentioned in the recently completed Requirements Assessment study quoted above,1 traditional methods of valuing
utility-generated power do not apply to a user-owner of a grid-connected technology. It is the purpose of this chapter to describe a general methodology to perform this function. There are at least three major requirements or features which this methodology must exhibit. These
issues, listed here, will be more fully elaborated in the course of the following discussion:
A) There is a need for a methodology that provides full economic valuation for the unique features of weather-dependent technologies. As will be seen, the sunlight dependence of solar systems results in both advantages and disadvantages to the user. The methodology, whether it involves analytics or simulation, must explicitly value these effects.
B) The methodology should be able to allow for the direct comparison of alternative technologies on "equal footing." The comparison should not be influenced by scale, region, or climate beyond the influence of these variables on the economics of the system in its applications environment.
C) The methodology should allow for the consideration of various government policy actions. The great disadvantage of cost goals is that they do not allow for the effects of policy on the demand side. (Cost
28
reduction is accomplished only through supply side progress, while commercialization policy is primarily aimed at stimulating demand.)
If a methodology can be agreed upon that exhibits the three features suggested above, then it will provide two chief benefits, the first of which is a market-related technology R&D investment goal. This goal will be meaningful in that it will provide a benchmark for the achievement of true economic competitiveness with current technology. In the case of
the Federal Photovoltaics Program it can be a valuable input to the JPL technology development project since it not only indicates a cost target,
but it also indicates the particular configuration of the technology, such as residential shingles, flat plates, concentrators, etc., which applies to that cost.
Second, the methodology will provide the parameters necessary to make comparisons between technologies. One important component of R&D
investment decisions is the economic benefits which a given technology will exhibit in its applications environment. Comparison of these
demand-side benefits between technologies is at least as important as the consideration of supply-side progress. Of course, the combination of the demand-side benefit measure with a supply-side cost measure would provide
the best economic viability measure for differing technologies. For technologies at or near the commercialization stage, government investment decisions can and probably should be made based on the distance certain technologies are from economic viability. For the
moment, this appears to be a more important criteria than ultimate market penetration and is motivated by the increased concern in the Department of Energy that the government get out of the technology development
business as soon as the technology is able to compete in the private
sector. Dr. Henry Marvin, Director of the ERDA Division of Solar Energy, has suggested that the Photovoltaics Program be restructured to focus on near-term goals under the assumption "that the market will enter an explosive self-sustaining growth phase at an array price of $1 to $2 per peak watt."2 Dale D. Myers, Undersecretary of DOE, who is responsible for overseeing the development of technology, recently stated, "My
objective is to move it (new energy technology) all into the industry and get the hell out of the business." 3 Both of these statements indicate the importance of understanding in advance not only the nature of the long-run markets for photovoltaics, but more importantly, the price at which new technologies become competitive with current ones, and the uncertainties associated with those prices.
The remainder of this chapter evaluates the economic valuation approaches that will meet the requirements discussed above. The section which immediately follows describes the nature of the economic valuation question.
2.2 ECONOMIC VALUATION OF PHOTOVOLTAICS
The term economic "benefits" or "valuation," as used in this report, is meant to be device-ownership specific, in that it is a valuation based
30
on the fuel bill saved for the owner. Specifying the valuation in this manner implies that it takes into account three things.
A) It is owner-specific in that it values the photovoltaic energy based on the alternative fuel source which that particular consumer faces
and it is also configuration-specific in that it requires that the particular application be described.
B) It is region-specific in that it is a valuation based on the local cost of alternative fuels and local insolation.
C) It also includes a measure of the foregone cost of electric generation capacity (if any) and the value of improved (or degraded) utility system reliability and generation and transmission efficiency.
This valuation does not claim to indicate whether or not the
photovoltaic systems will actually be purchased. The purchase decision is more complex than simple comparative life-cycle costs would
indicate.4 Furthermore, one can argue that the economic valuation of a new technology should be made in the context of some future environment, such as in comparison with other renewable resources.5 In this report economic valuation is interpreted to mean the result of an economic comparison of photovoltaic devices with current electric generation technologies. Finally, the benefits measured here do not include potential social, environmental, or national security benefits.
2.3 UNIQUE FEATURES OF PHOTOVOLTAICS WHICH AFFECT ECONOMIC VALUATION There are several characteristics unique to photovoltaic technology which bear examination because they have a direct impact on how one goes
about valuing the worth of the technology.
The modularity of photovoltaic arrays is notably uncharacteristic of conventional means to generate electricity and as a result, methods of calculating the value of the energy produced by photovoltaics cannot be divorced from the particular applications in which they are configured. This makes simple analytic valuation methods intractable, requiring
instead more detailed simulation.
The second, often overlooked, feature of photovoltaics is that its energy output (a function of solar radiation) is generally coincident with the peak demand periods for electricity. This correlation is
particuarly important for air-conditioned residences, most schools, and summer-peaking utilities. The fact that photovoltaic output tends to be present at peak demand periods means that there is a "quality" component in the energy that must be specifically valued by the methodology. The implication is that the calculations must be made for short time slices, perhaps by the hour, and that methodologies which employ average solar insolation values together with an overall system efficiency are likely to misrepresent the potential economic impact of the solar devices.
Third, in applications that are utility grid-connected, the electric utility will have no direct control of the output of the photovoltaic
device. This is analogous to the situation utilities confront with respect to "run-of-the-river" hydroelectric power. The valuation method for calculating the impact of the devices on utilities must be
32
sophisticated enough to account for the effects of this "run-of-the-sun" feature. As we shall see, this also impacts how one calculates the
"buy-back" price at which utilities are willing to buy surplus power fed back into the grid from user-owned systems.
The last feature that bears acknowledgment is the site-dependence of photovoltaics, mentioned earlier. Since the value of the device is so heavily dependent on the local climatic conditions and utility
environment, the calculations must be performed initially only for specific device configurations in particular regions for specific
utilities. The aggregation effects of photovoltaic devices on utilities is thus a nontrivial problem that requires explicit consideration in the methodology, perhaps through stochastic processes.6
In summary, specific characteristics of photovoltaic systems make the economic valuation question more complicated than the question of the value of conventional technologies. In the next section, we will examine some of the approaches to measuring the economic value of alternative electric-generation technologies to see if they fit these requirements and needs.
2.4 PREVIOUS APPROACHES TO ECONOMIC VALUATION
All of the methodological approaches that have been used to date to evaluate the economic worth of photovoltaics were developed originally under the assumption of utility ownership. As we shall see, this presents problems when the methodology is applied to non-utility
ownership cases. The two approaches to be discussed in this section are the Levelized Busbar Cost approach7 used by the Aerospace
Corporation8 in its Photovoltaics Mission Analyses7 and the Total System Cost approach9 used by both General Electric and Westinghouse Corporations in their Photovoltaics Requirements Assessment
StudieslO,11.
Levelized Busbar Costs
As the name implies this is a costing not a valuation methodology. In this method the cost of supplying electricity from a single generating plant, or photovoltaic device, is calculated independently of any other plants in the system at a specified annual capacity factor. Thus, in any configuraton where the energy producing device is connected to the grid, the rest of the plants in the system are ignored. The costs are
calculated in mills per KWH according to the following formula:
Ct . FCR
BBEC
:
P
&
+
Where:
Ct = Capital cost at time t, in dollars FCR = Fixed charge rate, per unit
8.76 = constant to convert years to hours and dollars to mills PCF = Plant capacity factor, annual
34
FT = Annualized fuel costs, in mills/KWH
(Fr would be zero for photovoltaic plants)
Notice that this is not an economic valuation measure as we have defined the term. It allocates capital costs over a specified lifetime implicit in the fixed charge rate. The performance characteristics of the plant are contained within the single plant capacity factor number.
There are a number of reasons why levelized busbar cost is an inadequate methodology for the economic comparison of two methods of supplying electricity. First, in order to be valid the capacity factors must be the same for the two systems being compared. Capacity factor is defined as the ratio of the average load on a machine or equipment for the period of time considered, to the rating of the machine or
equipment. Thermal power plants have capacity factors lower than 100 percent due to unexpected or planned system outages. Photovoltaic plants generally have very low capacity factors since here the capacity factor
is a function of sunshine availability. "It is impossible therefore for a (photovoltaic) plant to have a capacity factor as high as the highest of conventional thermal plants..."12 Of course, comparisons could be made over a range of capacity factors, holding them the same for both plants, but even this would not allow one to choose the appropriate
systems because the answer will change as the capacity factor changes. Second, busbar costs do not account for the "effective" capacity of the two plants. Effective capacity has been defined as the amount of
conventional capacity that would be displaced upon the installation of a photovoltaics plant of a certain rated capacity. This is related to the discussion earlier where it was argued that photovoltaic energy has a "quality" component related to the time of day. "The insolation tends to be available at a time in the daily work cycle when the loads are
highest; and depending upon the relationship of the timing of the
insolation peak and the daily load peak, (photovoltaic plant) effective capacity can be considerably higher than capacity factor."1 3
Finally, busbar costs do not place a valuation on the impact of the power plant on the total utility system. It is never the case that one is just comparing a photovoltaics plant with a coal plant, in isolation. A photovoltaics plant will behave very differently with respect to the
utility system when it is installed than would a coal plant, even if they had the same capacity factor. Thus, busbar cost is not a sufficiently detailed method to determine the value of a photovoltaic system to its utility owner. It is also questionable whether the results it gives even allow the decision-maker to make rough-cut, technology rankings.
Total Utility Systems Cost
In contrast to busbar cost, which is a purely analytic method, Total Utility Systems Cost is a method that relies upon simulation. As we shall see, this method, when implemented correctly, is the type of analysis needed to perform the economic valuation of photovoltaics from the utility point of view. If the photovoltaic system is utility-owned, then we can stop here. If the systems are user-owned, however, total
36
systems costs provides only one part of the ultimate analysis (see Section 6.4).
The Total Systems Cost Methodology involves a detailed hourly stochastic simulation of the utility system reliability. This is
accomplished in terms of the widely-used expected value of systems outage known as the loss of load probability (LOLP). The economic valuation of a photovoltaic plant is calculated based on its ability to contribute to
the overall generation system reliability. A photovoltaic plant is added to a "base" utility system, its output being considered a negative load on the system, and conventional capacity is retired from the system until reliability returns to its base LOLP value. This amount of conventional capacity "displacement" is referred to as the photovoltaic plant
"effective capacity". The economic valuation is completed by summing the value of the fuel costs displaced and the value of this effective
capacity. In order to assess the energy displacement characteristics of a photovoltaic plant it is necessary to analyze the entire utility
generation system operation through a production cost simulation model. This model dispatches generating capacity to meet the total system load
at minimum cost. Since the photovoltaic plant output is sunlight
dependent ("run-of-the-sun"), it must first be modeled and then the rest of the utility plants are dispatched around it in the simulation.
Running the simulation with and without the photovoltaic plant addition yields a valuation which includes both the displaced conventional
capacity and the displaced energy all at constant system reliability.1 4 This approach was used successfully by General Electric in their Requirements Assessment of Photovoltaic Electric Power Systems1 4 to
show that photovoltaic plants did not necessarily require 100 percent conventional capacity backup, as was widely asserted by many
commentators. There are, however, several necessary conditions that must be accounted for in this methodology, conditions that General Electric did not meet in their study:
A) The solar insolation data which determines the output of the photovoltaic plant must be matched on an historical basis with the utility system load data. This could be especially critical for
summer-peaking utilities where the presence of sunshine will increase the air conditioning load. Energy demand and insolation are not independent variables.
B) This methodology is not sufficient by itself for dispersed, utility-owned systems. Explicit consideration must be taken of
transmission-distribution loss and reliability improvements that will be enjoyed with dispersed photovoltaic systems.1 5
C) As alluded to earlier, the use of the total utility system cost methodology by itself to calculate the economic value of photovoltaic
systems implies necessarily that utilities own the systems.
In the next section a methodology will be suggested that calculates the economic value of user-owned photovoltaic plants.
38
2.5 SUGGESTED USER-OWNED ECONOMIC VALUATION METHODOLOGY
It is important at the outset to distinguish between the methodology in general and the particular way in which it will be configured to examine user-owned photovoltaics. In general, the methodology defines
two numbers. The first is called the "breakeven" capital cost and is calculated by finding the difference between the user's electricity bills with and without the PV device according to the following formula:
8760
EC n E (x0i -xDi) . EFACT(J) . DFACT(J) - FIXEDC + VARC
BECC
J=1 (1 +p) ACOL
Where: system
BECC = Breakeven capital cost in $/W*
XOi = Utility bill for hour i without device in $
XDi = Utility bill for hour i with device in $
EFACT(J) = weighted fuel price escalation factor for year J based on fuel price component of rate structure DFACT(J) = benefits degradation factor for year J based on
module degradation
p = discount rate appropriate to user n = lifetime of device
ACOL = collector area in m2
FIXEDC = fixed subsystem costs (including installation,
power conditioning, lightning protection, etc.) in $
*See Foreword and Appendix A.
VARC = variable subsystem costs (including installation O&M, markups, insurance, taxes, etc.) in $/m2
nsystem = system efficiency.
BECC can be considered an economic indifference value - that price at which the user would be economically indifferent between having and not having the device. This formula contains a number of features. First, the valuation which is the difference in the utility bills to the user,
is determined by the utility rate structure and whatever the utility is willing to pay for surplus energy supplied by the owner to the grid. If the rate structure reflects the load demand on the utility (as under peak-load pricing), then this valuation explicitly values the "quality" component of the energy supplied by the device. Second, it is a figure defined in dollar units. This automatically adjusts for the scale of the device and allows direct comparison between two devices in the same
application.
The second number that this methodology allows one to calculate is a dimensionless "break-even index". It is calculated by dividing the
break-even capital cost by the cost at which the technology is available today for that particular application:
BEI = BECC
where
BEI = breakeven index
40 CC = current capital cost.
This measure is an attempt to implement in a simple manner the demand-side, supply-side interaction mentioned earlier. The numerator, BECC, constitutes the demand-side benefit measure while CC represents the
supply-side cost measure which indicates availability.
In a situation where future costs (CC) were perfectly known, this index would allow one to compare different technologies in the same application (what the busbar energy cost figure claims to do). BEI
would, under these circumstances, tell the investment decision-maker "how far away" the technology is from break-even. Unfortunately, CC is not known with certainty, and thus this measure is also imperfect. But by introducing judgements as to possible future supply costs with
probabilistic distributions around these costs, it may be possible to use this index for technology comparison. 1 6
While there is a fine line between what one would call an analytic model and a simulation model, the fact that this methodology requires hour-by-hour analysis suggests the necessity of simulation.
2.6 FOOTNOTES
1. General Electric Co., Requirements Assessment of Photovoltaic Electric Power Systems, RP 651-1 for EPRI by GE Electric Utility Systems Engineering Dept., Schenectady, NY, Draft Final Report, June
1, 1977.
2. H.H. Marvin, Letter to Photovoltaic Program participants on "Photovoltaic Program Plan Restructure," August 5, 1977.
3. Dale D. Myers, Quoted in The New York Times, December 5, 1977, p. 61. 4. For discussion of the photovoltaics purchase decision and a
methodology to measure the factors involved, see: Gary L. Lilien, The Diffusion of Photovoltaics: Background, Modeling and Initial Reaction of the Agricultural-Irrigation Sector, MIT Energy Laboratory
Report MIT-EL 76-004, Cambridge, MA, March 1978.
5. Amory Lovins, Soft Energy Paths, Ballinger Publishing Company, Cambridge, MA, 1977, p. 69.
" Since we are obliged to begin committing resources now to the long-term replacement of historically cheap fuels, we must compare all potential long-term replacement technologies with each other, not with the cheap fuels, in order to avoid a serious misallocation of resources." (emphasis in original) 6. Work is currently under way to analyze this load aggregation problem
by Prof. Fred C. Schweppe et al. of the MIT Electric Power Systems Engineering Laboratory.
7. J.W. Doane, et al., The Cost of Energy from Utility-Owned Solar Electric Systems, JPL/EPRI-1012-76/3, Jet Propulsion Laboratory, Pasadena, CA, June 1976.
8. Aerospace Corporation, Mission Analysis of Photovoltaic Solar Ener Conversion, for ERDA/Sandia, JAN/1101-77/1, March 1977.
9. C.R. Chowaniec, P.F. Pittman, D.W. Marshall, "A Reliability
Assessment Technique for Generating Systems with Photovoltaic Power Plants," IEEE PAS, April 21, 1977.
10. General Electric Co., op. cit.
11. Westinghouse Electric Co., Utility Assessment of Photovoltaic Electric Power Systems, Follow-on Project under ERDA Contract
42
E(11-1)-2744 "Conceptual Design and Systems Analysis of Photovoltaic Power Systems," 1977.
12. General Electric Co., op. cit., p. L-3. 13. Ibid., p. L-4.
14. For a more detailed description of the total systems cost methodology, see GE, op. cit., Appendix F.
15. The so-called residential shingle scenario studied by General Electric is a misnomer, because no effort was made to model the transmission-distribution system. The answer would have been the same if all of the dispersed shingles had been aggregated in a central power plant, except for differences in subsystem costs. 16. It must be emphasized that this index provides only a part of the
information necessary to make R&D investment choices and decisions. No one measure can make these decisions in isolation since it is necessary to understand how alternative R&D budget allocations affect future technology development along many dimensions. The claim is made, however, that knowledge of the point at which technologies reach economic "breakeven" in the marketplace is a vital piece of the information that is needed.
III. SIMULATION MODEL DESCRIPTION AND INPUT ASSUMPTIONS 3.1 REGIONAL DEFINITION
The choice of regions in which to perform the analysis is based on the work of Carpenter and Tabors.1 This regional definition study was performed in recognition of the fact that most existing regional schema for energy analysis are not well suited to data collection 2 or are
improperly constructed to reflect solar energy and climatic
characteristics. The methodology employed by this analysis was a
multivariate statistical method called two-stage factor analysis coupled with cluster analysis of cases. Using states as regional building
blocks, this methodology examines groups of variables and their correlations and based on these correlations constructs linear
combinations of variables, called factors. This technique isolates the underlying dimensions in the data and allows one to condense many
variables into a few "factored" variables. Each state has a
corresponding score for each of these factors and these factor scores are then used by the cluster analysis to group similar states and
differentiate dissimilar states. Homogeneous regions are thus constructed based on many underlying variables.3 Figure 2 is a box diagram depicting this two-stage process. As indicated, the data set consisted of 8 climate variables representing solar radiation
availability and heating and cooling requirements, 10 economic variables measuring energy consumption, income, value added and growth, and 12
A A ~cl)
U).J
(ac(
M v, Cl) (I)~ w W , cr5 cr &LJ(3scn Q- QZ
0
Iz
o
~LLFO
LLZ -JZ0
o
_dat
w
c-
),
o
I-zzo
0w
Cl)0
I-.I
0n0
O~ Iproduction-supply variables reflecting fuel prices, refinery capacity and energy pruduction.
The final regional breakdown is illustrated in Figure 3. Because of their homogeneity, each region can be unabiguously defined based on the final factors which are linear combinations of the above variables. For
example, Region V, the Southwest, is characterized by high consumption, sunny climate, affluence and high energy prices. (See Carpenter and Taborsl (1978) for a more detailed summary and quantitative description of the regions). Due to time and data limitations, three of these seven regions were selected for the analysis presented in this document; those regions which include Boston, Omaha, and Phoenix. It was felt that these three areas provided a sufficiently broad cross-section to be
representative of typical results for all regions. 3.2 VALUATION MODEL
The model employed to value PV systems in this study can be conceptualized as three separate models: A) a photovoltaic array simulation model B) a load-scheduling simulation model, and C) an economic valuation model.
PV Array Model
This model provides an application and location-specific simulation of the output of a photovoltaic system. Specific system configurations
are input by means of design parameters such as array size, packing factor, efficiency, loss factors, array tilt, etc. Location specificity
C
C
E
C
C
uj
LL 1! i-is achieved by the designation of latitude and the use of local data for insolation and temperature. Thus, given system configuration, latitude, and hourly weather data, the simulation provides hourly PV system (i.e. conditioned A/C) electric power levels.4
Load-Scheduling Model
Residential usage of electricity is determined on the basis of appliance load and electricity price inputs and the availability of
electricity from the solar array model. Appliance energy consumption and use assumptions are input to the model in the form of vectors described below in Section 3.3.3. Price information is in the form of utility rate structures. Output from the array simulation determines the availability of photovoltaic energy.
Scheduling is accomplished through a process intended heuristically to optimize use of the PV array output. 5 Each half-hour the scheduling
heuristic proceeds through five steps summarized in Figure 4, first
constructing a prioritized list of loads with "must run" loads at the top and other "runnable" loads in descending order of total cost.6
Available PV system output is then dispatched to cover as many of the loads as possible. If array output is more than needed to cover all the "runnable" loads in a period, excess is sold back to the utility grid at a designated price. When solar electricity is insufficient to cover the entire list, the remaining loads are postponed except for those
48 Figure 4
SIMULATION MODEL SCHEDULING HEURISTIC
1. IS LOAD IN MUST-RUN PERIOD? RUN THOSE LOADS THAT MUST BE RUN.
2. IS LOAD "RUNNABLE"? A LOOK-AHEAD IS PERFORMED FOR RUNNABLE LOADS WHICH ATTACHES COSTS TO THE LOADS IN VARIOUS RUN SCENARIOS BASED ON
THE AVERAGE UTILITY PRICE OVER THE RUN PERIOD. LOADS ARE RANKED IN ORDER OF MOST EXPENSIVE AND, IF THERE ARE TIES, BY LARGEST LOAD.
3. IS THERE SOLAR AVAILABLE? RUNNABLE LOADS ARE SWITCHED ON IN PRIORITY ORDER WHILE EXCESS SOLAR EXISTS. IF INSUFFICIENT SOLAR EXISTS TO COVER FULL LOAD THEN LOAD IS SWITCHED ON WHILE THE WEIGHTED PRICE OF SOLAR PLUS UTILITY POWER IS LESS THAN A PRE-SET LIMIT.
4. LEFT-OVER SOLAR IS SOLD BACK TO UTILITY.
purchased from the utility grid at the price (determined by the rate structure) prevailing for that particular time period. Records are kept
accounting for all PV output and all electricity purchased from the utility, as well as the total utility bill incurred and what that bill would have been had consumption remained unchanged and had all energy
been purchased from the utility grid. Economic Model
The economic valuation model performs two functions. The first is necessitated by the fact that the first two sections described above, which simulate the PV residence, are run for only a single year. Since these single-year reslts would not be expected to remain stable through time, evaluation requires that the one-year figures be projected over the lifetime of the system. This is accomplished by applying degradation7 and fuel escalation8 assumptions through time to develop a twenty-year profile of PV benefits. The second portion of the model simply performs a net present value calculation by the application of a discount rate to yearly energy savings* to arrive at a gross market breakeven value. Subsystem, operation and maintenance, shipping and distribution, and other relevant costs9 as well as profit margins etc. are then
*It should be mentioned here that the utility bill with solar was
compared to the time-of-day bill that would have resulted without solar. This was done to assure that savings resulting from behavioral shifts motivated by the time-of-day structure alone were not capitalized into the value of the PV system.
50
subtracted to arrive at the net breakeven figures presented. See formula in Section 2.5 and computer program in Appendix C. The input assumptions and sensitivity analysis scenarios for the economic valuation model are presented in Chapter IV.
3.3 MODEL INPUTS
The following sections describe the specific assumptions and data inputs for each segment of the array and load scheduling models described above.
3.3.1 SYSTEM CONFIGURATION
The system configuration assumptions for the base case are presented in Figure 5. Mismatch and inverter efficiencies as well as packing
factor remained constant through the entire analysis. The array tilt Figure 5
SYSTEM CONFIGURATION ASSUMPTIONS
Array Size: 35 m2
Cell Efficiency: .12
Wiring and Mismatch Efficiency .95
Inverter Efficiency: .88
Packing Factor: .80
Array Tilt Angle: Latitude less 10o
Storage: None
angle was set to optimize year-round performance1 0 and also was not varied. Virtually all analysis was done without storage and this factor deserves more detailed comment.
Storage was omitted from the analysis primarily for two reasons. The first is the problem storage causes in array-size optimization.
Without marginal cost functions for array and storage equipment it was not possible strictly to optimize the PV system. It was hoped that over the range of array sizes relevant to the residential application there would be a peak in the per unit net breakeven value1 1l ($/m2) which would proxy as an optimum assuming constant cost per m2 of array.1 2 The inclusion of storage would have made such a determination much more complex. A much more serious problem which provided the second reason for storage exclusion is the fact that benefit allocation becomes more difficult when storage is included. Since storage can reduce electricity
bills given a time-of-day pricing structure with or without a PV array,1 3 the benefits to a combined system could accrue to the PV
array, to the storage, or to the interaction of the two. This allocation difficulty underscores the fact that photovoltaics and storage, rather than being complementary as is commonly believed, appear in fact to be competitive or substitute devices for grid-interfaced systems.1 4
Both array size and cell efficiency have been varied from the base case in parametric analysis. The 35 m2 array size was in fact selected as the base size because of its apparent optimality, given location and buy-back rate possibilities (see Section 5.1) in the sensitivity runs. The range on size, 5-85 m2, covers those thought reasonable in
residential applications. Cell efficiency was set at .15 on sensitivity runs because, while present efficiencies are around .12, the higher figure is projected cell performance for 1986.15