Dynamic fleet-based life-cycle greenhouse gas assessment of the
introduction of electric vehicles in the Portuguese light-duty fleet
The MIT Faculty has made this article openly available.
Please share
how this access benefits you. Your story matters.
Citation
Garcia, Rita, Jeremy Gregory, and Fausto Freire. “Dynamic
Fleet-Based Life-Cycle Greenhouse Gas Assessment of the Introduction
of Electric Vehicles in the Portuguese Light-Duty Fleet.” The
International Journal of Life Cycle Assessment 20, no. 9 (July 15,
2015): 1287–1299.
As Published
http://dx.doi.org/10.1007/s11367-015-0921-8
Publisher
Springer Berlin Heidelberg
Version
Author's final manuscript
Citable link
http://hdl.handle.net/1721.1/104642
Terms of Use
Article is made available in accordance with the publisher's
policy and may be subject to US copyright law. Please refer to the
publisher's site for terms of use.
MODERN INDIVIDUAL MOBILITY
Dynamic fleet-based life-cycle greenhouse gas assessment
of the introduction of electric vehicles in the Portuguese light-duty
fleet
Rita Garcia1 &Jeremy Gregory2&Fausto Freire1
Received: 16 February 2015 / Accepted: 13 June 2015 / Published online: 15 July 2015 # Springer-Verlag Berlin Heidelberg 2015
Abstract
Purpose Reducing greenhouse gas (GHG) emissions from the transportation sector is the goal of several current policies and battery electric vehicles (BEVs) are seen as one option to achieve this goal. However, the introduction of BEVs in the fleet is gradual and their benefits will depend on how they compare with increasingly more energy-efficient internal combustion engine vehicles (ICEVs). The aim of this article is to assess whether displacing ICEVs by BEVs in the Portuguese light-duty fleet is environmentally beneficial (fo-cusing on GHG emissions), taking into account the dynamic behavior of the fleet.
Methods A dynamic fleet-based life-cycle assessment (LCA) of the Portuguese light-duty fleet was performed, addressing life-cycle (LC) GHG emissions through 2030 across different scenarios. A model was developed, integrating: (i) a vehicle stock sub-model of the Portuguese light-duty fleet; and (ii) dy-namic LC sub-models of three vehicle technologies (gasoline ICEV, diesel ICEV and BEV). Two metrics were analyzed: (i) Total fleet LC GHG emissions (in Mton CO2eq); and (ii) Fleet
LC GHG emissions per kilometer (in g CO2eq/km). A
sensi-tivity analysis was performed to assess the influence of different parameters in the results and ranking of scenarios.
Results and discussion The model baseline projected a reduc-tion of 30–39 % in the 2010–2030 fleet LC GHG emissions depending on the BEV fleet penetration rate and ICEV fuel consumption improvements. However, for BEV introduction in the fleet to be beneficial compared to an increasingly more efficient ICEV fleet, a high BEV market share and electricity emission factor similar or lower to the current mix (485 g CO2
eq/kWh) need to be realized; these conclusions hold for the different conditions analyzed. Results were also sensitive to parameters that affect the fleet composition, such as those that change the vehicle stock, the scrappage rate, and the activity level of the fleet (11–19 % variation in GHG emissions in 2030), which are seldom assessed in the LCA of vehicles. The influence of these parameters also varies over time, be-coming more important as time passes. These effects can only be captured by assessing Total fleet GHG emissions over time as opposed to the GHG emissions per kilometer metric. Conclusions These results emphasize the importance of tak-ing into account the dynamic behavior of the fleet, technology improvements over time, and changes in vehicle operation and background processes during the vehicle service life when assessing the potential benefits of displacing ICEVs by BEVs. Keywords Battery electric vehicles . Fleet model .
Greenhouse gas emissions . Internal combustion engine vehicles . Life-cycle assessment
1 Introduction
The transportation sector is increasingly energy- and carbon-intensive, contributing to about 32 % of the final energy
Responsible editor: Wulf-Peter Schmidt
Electronic supplementary material The online version of this article (doi:10.1007/s11367-015-0921-8) contains supplementary material, which is available to authorized users.
* Rita Garcia
rita.garcia@dem.uc.pt
1
ADAI-LAETA, Department of Mechanical Engineering, University of Coimbra, Polo II Campus, R. Luís Reis Santos,
3030-788 Coimbra, Portugal
2 Department of Civil and Environmental Engineering, Massachusetts
Institute of Technology, 1-276, 77 Massachusetts Avenue, Cambridge, MA 02139, USA
consumption and 25 % of the greenhouse gas (GHG) emis-sions in the European Union (EU28) (40 % and 36 % in Portugal, respectively) (European Commission2014). Light-duty vehicles (LDVs) are of special concern, as they are re-sponsible for about 15 % of EU’s CO2emissions (European
Commission2012). The reduction of energy and GHG emis-sions in this sector is the goal of several current policies (e.g., EU Climate and Energy Package, US Corporate Average Fuel Economy standards). Several measures to reduce energy and environmental impacts from vehicles have been proposed, which include the reduction of fuel consumption of conven-tional technologies (e.g., through lightweighting, downsizing, and more efficient powertrains), displacement of fossil fuels by biofuels, and development of alternative technologies (e.g., electric vehicles, fuel cell vehicles) (Leduc et al.2010; Althaus2012).
Recent attention has been drawn to the potential of electric vehicles (EVs) to reduce energy and environmental impacts (Althaus2012). A number of countries have set targets for EV sales and/or stock and adopted policy measures to promote EV adoption, such as financial incentives and infrastructure deployment (IEA2013). In Portugal, a public charging infra-structure has been deployed. This strategy, combined with the incorporation of high levels of renewable energy in Portugal’s electricity mix, aims to promote the adoption of EVs and the development of related industries. Nevertheless, the market share of EVs has been low and additional efforts are deemed to be required to boost their wide adoption (IEA2013).
The potential of EVs to reduce environmental impacts is, however, highly dependent on the electricity sources used to charge the batteries and how they evolve over time. Additionally, EV benefits for GHG emission reduction will also depend on how EVs compare with increasingly more energy-efficient conventional vehicles, as the introduction of EVs in the fleet is gradual and its effects will not be seen in the short term (Frischknecht and Flury2011). In order to assist policymaking, we need to understand the conditions under which the introduction of EVs in a vehicle fleet is environ-mentally beneficial.
The life-cycle assessment (LCA) literature has ad-dressed the environmental impacts of EVs and compared them with those from different powertrains (e.g., McCleese and LaPuma 2002; Samaras and Meisterling 2008; Gao and Winfield 2012; Freire and Marques 2012; Hawkins et al. 2012; Marques et al. 2013; Hawkins et al. 2013; Messagie et al. 2014; Nordelöf et al. 2014; Noshadravan et al. 2015). These studies, although comprehensive in scope, often perform static analysis of single vehicles, aiming at assessing which options have the least environ-mental impact. In addition, they lack a future time per-spective regarding advances in material processing, tech-nology development and changes in electricity production (Nordelöf et al. 2014). However, when the goal is to
assess new or changing technologies, transient effects may be important and cannot be captured with such static, single-product analysis (Field et al. 2000). Moreover, if the goal is to explore solutions able to reduce overall environmental impacts (e.g., to meet medium/long-term policy targets), both scale and timing of adoption may influence the results (Hillman and Sandén 2008; Stasinopoulos et al. 2011).
Field et al. (2000) proposed an approach to capture these effects by combining LCA with a fleet model. The fleet-based LCA implies a different approach to the functional unit and system boundary, since it takes into account the set of units in service, and introduces the notion of time, by integrating in the life-cycle model the dynamics associated with substituting older products by new products in the fleet (or the product stock); therefore, it is able to capture the overall environmental effects of technology turnover. This approach has been mainly used to assess trade-offs between the use of steel and lighter materials in vehicle manufacturing (Field et al. 2000; Das 2000;2005; Cáceres2009; Stasinopoulos et al.2011), to op-timize the service life of products (Kim et al.2004,2006), and to assess the overall effects of product populations in the en-vironment (Yokota et al.2003).
The assessment of the LC environmental impacts of the introduction of vehicle technologies in existing fleets has been addressed by several authors through scenario analysis, with mainly two objectives: (i) to assess the overall reduction in the environmental impacts achieved by implementing different technology/fuel pathways (e.g., Bandivadekar et al. 2008; Baptista et al. 2012; Bodek and Heywood2008; Kromer et al.2010; Reichmuth et al.2013); and (ii) to define pathways that allow achieving certain emission reduction targets (e.g., Cheah and Heywood2011; Melaina and Webster2011). Most studies were performed for the USA or regions within the USA (EPRI 2007; Bandivadekar et al.2008; Plotkin and Singh2009; Keoleian et al.2011; Bastani et al.2012a;b;c). A well-to-wheels perspective is the most common in the liter-ature, and only few studies have taken a full life-cycle ap-proach (Bandivadekar et al.2008; Baptista et al.2012). In general, the role of EVs in the reduction of the LC impacts of a vehicle fleet over time is only one of the many options assessed. Although some studies addressed different scenarios for the electricity mix (EPRI 2007; Kromer et al. 2010; Keoleian et al. 2011; Reichmuth et al. 2013) and included technology improvements over time, such as fuel economy improvements (Reichmuth et al. 2013) and vehicle lightweighting (Cheah and Heywood2011), the integration of all these aspects in the analysis of the potential of EVs to reduce fleet LC impacts has not been fully explored.
This article contributes to the literature by investigating the fleet-wide environmental benefits of displacing internal com-bustion engine vehicles (ICEVs) by EVs across different sce-narios. The analysis takes into account the increasing fuel
consumption reduction of ICEVs and the necessary reductions in the electricity mix impacts, within different fleet penetration scenarios, fleet and distance traveled growth rates, and chang-es in vehicle weight and composition and battery technologichang-es over time. In particular, the aim of this article is to assess whether displacing ICEVs by EVs in the Portuguese light-duty fleet is environmentally beneficial, taking into account the dynamic behavior of the fleet. It also aims to identify the conditions under which this displacement is beneficial. The range of conditions was defined by a set of parameters: elec-trical grid intensity, EV fleet penetration, and reduction in ICEV fuel consumption.
The remainder of this article is structured as follows: Section 2 describes the dynamic fleet-based life-cycle model, including LC parameters, data sources, and the four scenarios assessed (Business-as-usual; ICEV improve, BEV dominate, and Combined); Section 3 pre-sents the results for those scenarios and the contribution of LC stages, a sensitivity analysis to key model param-eters, and a parametric analysis to examine the effects of EV fleet penetration rate, electricity GHG intensity, and ICEV increased efficiency in the results; and Section 4 lists the conclusions.
2 Methods
2.1 Model overview
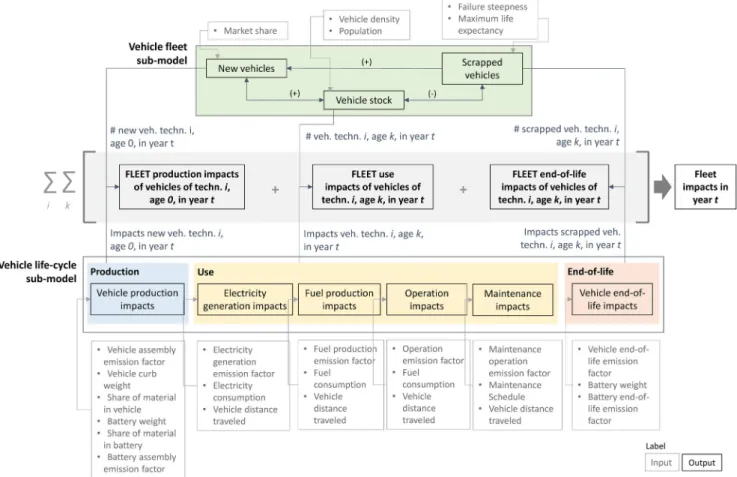
A dynamic fleet-based life-cycle (LC) model was developed to assess fleet-wide LC greenhouse gas (GHG) emissions over time, from 1995 to 2030. The model integrates: (i) a vehicle stock sub-model of the Portuguese light-duty fleet; and (ii) dy-namic life-cycle sub-models of three vehicle technologies (gas-oline ICEV, diesel ICEV and BEV). Fleet-wide impacts in each year are a combination of the impacts of single vehicles and the number of vehicles in the fleet across all ages and technologies. Figure1shows an overview of the model, including the main inputs and outputs. More details about the parameters, data sources, and the equations that describe the vehicle stock sub-model and the dynamic life-cycle sub-sub-models are presented in
theElectronic Supplementary Material.
The vehicle stock sub-model estimates the annual stock of vehicles by technology, the age of vehicles in the fleet, and the number of vehicles, by age, that leave the fleet every year, from 1995 up to 2030. The dynamic LC sub-models were developed for three vehicle technologies: diesel ICEV (~67 % market share in 2010), gasoline ICEV (~33 %), and battery EV
Fig. 1 Dynamic fleet-based life-cycle model overview. More details in the Electronic Supplementary Material: Vehicle fleet sub-model Fig.S-1; Production Fig.S-4; Use Fig.S-6; End-of-life Fig.S-13. i technology
(gasoline, diesel, BEV); k vehicle age; t calendar year. Positive causal link + the two variables change in the same direction; negative causal link− the two variables change in opposite directions
(BEV) (0.01 %). We divided the vehicle LC into three main stages: (i) production, (ii) use, and (iii) end-of-life, and modeled the emissions from these stages as functions of vehicle age and model year, which makes these LC models dynamic. The ve-hicle manufacturing stage includes raw material acquisition, transportation, and processing, as well as parts and components manufacturing and vehicle assembly. The use stage accounts for vehicle operation (tailpipe and tire abrasion emissions) and maintenance, as well as fuel, and electricity production and distribution. The end-of-life stage accounts for vehicle and bat-tery dismantling, recycling, and disposal of components. We excluded road infrastructure, refueling stations for ICEVs, and charging points for EVs from the assessment, as their contribu-tion to the impacts is deemed to be minor (Lucas et al.2012).
We based our vehicle stock sub-model on the US passenger vehicle fleet model developed by Bandivadekar et al. (2008) and improved by Cheah (2010), and adapted it to the Portuguese context following the work of Moura (2009). We further developed the model to include different vehicle tech-nologies, i.e., electrical engines (BEVs), in addition to internal combustion engines (gasoline and diesel), and parameterized it for our specific analysis.
2.2 Vehicle stock sub-model
The vehicle stock sub-model tracks the number of vehicles in use in the Portuguese light-duty fleet, by technology (i) and age (k), from 1995 to 2030 (t). We considered LDVs up to 25 years old and three technology types—gasoline ICEV (g), diesel ICEV (d), and BEV (e) (we note that BEVs only started to be sold in Portugal in 2010). Details about the model equa-tions can be found in Fig.S. 1in the Electronic Supplementary Material.
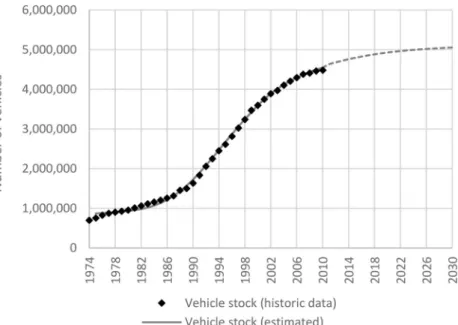
The total fleet turnover is expressed as the number of ve-hicles in the fleet in the previous year subtracted by the num-ber of scrapped vehicles and adding the numnum-ber of new vehi-cles entering the stock. We calculated the total vehicle stock by multiplying the vehicle density (i.e., the number of vehicles per 1000 inhabitants) by the population in each year. The vehicle density for Portugal was estimated by calibrating a logistic curve based on vehicle data from ACAP (2011) and demographic data from PORDATA (2011), for the time period between 1974 and 2010 (r2=0.998). Population projections were obtained from INE (2009). Figure2shows the estimated vehicle stock over time. The number of LDVs being driven in Portugal currently exceeds 4.5 million, 3 times more than in 1990. Vehicle density increased from about 163 to 422 vehicles/1000 inhabitants in the same period.
Vehicle scrappage was estimated by using a modified Weibull distribution, which characterizes the survival rate of vehicles in the fleet as a function of vehicle age. We used the calibration of the survival curve for Portuguese conditions done by Moura (2009) for model years 1995, 2000, and 2005. We assumed the same survival curve from 2005 on-wards and a similar curve for all vehicle types. We started the simulation using the characterization of the Portuguese vehicle fleet composition (age and technology distribution) in 1995 used in Ceuster et al. (2007) and depicted in Table S-2 of the Electronic Supplementary Material. Total vehicle sales were derived from the accumulated vehicle stock. The number of new vehicles of each technology was calculated by multiplying the total sales by its market share. Over 2005 to 2010, about 220,000 to 235,000 new vehicles entered the fleet each year, while 115,000 to 195,000 older vehicles were retired annually.
Fig. 2 Portuguese light-duty vehicle stock
2.3 Dynamic life-cycle sub-model 2.3.1 Vehicle production
Fleet environmental impacts of vehicle manufacturing in each year were determined by the sum of manufacturing impacts of all new vehicles entering the fleet. The environmental burdens of vehicle manufacturing include vehicle materials and assem-bly burdens. Vehicle and battery material burdens are propor-tional to vehicle curb weight and battery weight, which varies with model year. Because impacts from vehicle production are accounted for in the year the vehicles are produced, they are independent of vehicle service life. SectionS-2.1 in the Electronic Supplementary Material details the calculation of vehicle production impacts, including vehicle and battery weight data.
Material composition of ICEVs was assumed to change over time according to Cheah (2010). The main changes are related to the substitution of cast iron and conventional steel by lightweight materials such as high-strength steel, alumi-num, and plastics. Material composition of BEVs and batte-ries was assumed constant. Iron, steel, aluminum, and magne-sium material production (i.e., extraction and processing) was assumed to become more energy-efficient and less GHG in-tensive over time (evolution according to Cheah 2010). Regarding other materials, we assumed energy use and GHG emissions to be constant over time. Energy intensity and GHG emissions from 1995–1999 were assumed equal to 2000.
2.3.2 Vehicle use
The use of the vehicle includes both vehicle and fuel life cycles. Use stage burdens are a function of vehicle distance traveled, fuel consumption, and emission factors. The use stage fleet impacts in each year result from the sum of use-related impacts from all vehicles in the fleet. These include impacts from fuel production and distribution, electricity gen-eration and distribution, vehicle opgen-eration, and maintenance (see SectionS-2.2in the Electronic Supplementary Material for more details about the calculation of vehicle use impacts). Environmental impacts of fuel production and distribution include resource extraction, initial conversion of petroleum, transport of petroleum, fuel production, and distribution of gasoline and diesel. GHG emissions from gasoline and diesel production were obtained from Jungbluth (2007) and assumed constant over time, primarily due to a lack of information on how these emissions would evolve. A sensitivity analysis to assess the effect of a change in the fuel supply chain perfor-mance over time on the overall fleet GHG emissions was performed.
Environmental impacts of electricity generation and distri-bution include extraction, processing and transport of fuels,
operation of power plants, construction and decommissioning of power plants, waste management, transmission and distri-bution (T&D) grid infrastructure, and T&D grid losses. GHG emissions from electricity generation and supply in Portugal were obtained from Garcia et al. (2014). The average of the emission factors for the last 10 years (2003–2012) was used as a constant value up to 2030, in order to account for the vari-ability between years. Variations of this emission factor were assessed in the sensitivity analysis.
Environmental impacts of vehicle operation (combustion phase) include direct tailpipe and tire abrasion emissions. The operation emission factor is assumed constant and esti-mated based on the carbon content of the fuel as being fully oxidized into CO2(Moura 2009). Environmental burdens
from maintenance are a function of the cumulative distance traveled. Maintenance operations are performed according to Table S-5 in the Electronic Supplementary Material. It was assumed that fuel and electricity consumption remain constant over the life of the vehicle, since there is little evidence that the effect of vehicle deterioration and defective maintenance on fuel consumption can be generalized to the vehicle population (Austin and Ross2001). More details about vehicle fuel con-sumption ascon-sumptions can be found inSection S-2.2.2in the Electronic Supplementary Material.
The distance traveled by a vehicle varies depending on a number of factors, such as vehicle age (due to deterioration, reduced reliability, and shifting of primary to secondary car usage (Kim2003; Moura2009)), technology (diesel vehicles tend to be driven more than gasoline vehicles), and utilization purpose. We based our annual vehicle distance traveled esti-mations on vehicle inspection data for Portugal for 2005 (Azevedo2007; Azevedo and Cardoso2009). We estimated different vehicle distance traveled profiles for gasoline and diesel ICEVs. For BEVs, we assumed the same profile as gasoline ICEVs; however, since BEVs are about 70 % more energy efficient than gasoline ICEVs, we assumed a higher distance traveled in order to account for the expected rebound effect, in line with Silva (2011). More details about vehicle distance traveled assumptions can be found in SectionS-2.2.3 in the Electronic Supplementary Material.
2.3.3 Vehicle end-of-life
Fleet environmental impacts of vehicle end-of-life in each year were determined by the sum of end-of-life impacts of all scrapped vehicles leaving the fleet. The environmental bur-dens of vehicle end-of-life include the dismantling of the ve-hicle and the battery. The energy use of materials that are recycled and later used in a vehicle are taken into account in the burdens for each specific material. Section S-2.3 in the Electronic Supplementary Material details the calculation of vehicle end-of-life impacts.
2.4 Scenarios
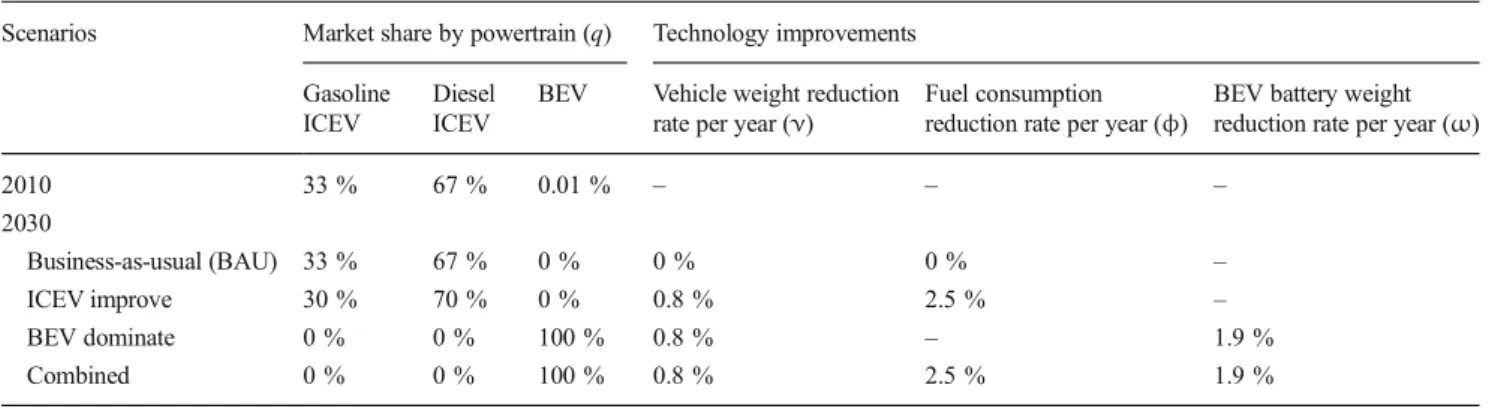
Options for reducing LDV GHG emissions include adoption of alternative powertrains, such as BEVs, and technology provements, such as vehicle lightweighting and efficiency im-provements. We explore possible combinations of these op-tions by constructing four scenarios: (i) Business-as-usual (BAU), in which ICEVs continue to dominate the fleet (con-stant diesel/gasoline ICEV market share), but no new vehicle technology improvements occur; (ii) ICEV improve, charac-terized by improvements on fuel consumption of new ICEVs to meet EU targets and vehicle lightweighting; (iii) BEV dominate, in which the emphasis is on the aggressive intro-duction of BEVs in the fleet, reaching 100 % of vehicle sales in 2030, and no improvements in ICEVs take place; and (iv) Combined, which associates BEV aggressive penetration and ICEV improvements. Characterization of each scenario is shown in Table1, in contrast with the 2010 fleet. It should be noted that, although all parameters are kept constant in 2010-2030 in the BAU scenario, the fleet size and composition do not remain constant due to the dynamic evolution of the fleet.
A rapid shift from gasoline to diesel ICEVs has recently occurred in Portugal. In 1995, only 10 % of all LDV sold were diesel-powered, compared with 68 % in 2010. Market share of BEVs was only 0.01 % in 2010. The BAU scenario assumes the same market share as 2010 and the ICEV improve scenario that 30 % of new vehicles are gasoline ICEVs and 70 % diesel ICEVs, following recent trends, as depicted in Fig.3a. The BEV dominate and Combined scenarios represent rapid pene-tration of BEVs assuming that BEV market share reaches 100 % in 2030, following an S-shaped curve (Fig.3b). In the BAU and ICEV improve scenarios, 42 % of the fleet in 2020 is gasoline ICEVs and 58 % is diesel ICEVs, and only in 2030 does the sales fraction match the fleet composition, as shown in Fig.3c. The BEV dominate and Combined scenarios lead to a fleet similar to the ICEV scenarios in 2020 (60 % diesel ICEVs, 36 % gasoline ICEVs and 4 % BEVs), and
composed of 36 % diesel ICEVs, 16 % gasoline ICEVs and 48 % BEVs in 2030, as depicted in Fig.3d.
2.5 Output metrics
We assessed fleet-wide impacts up to 2030 using two metrics: (i) Total fleet life-cycle (LC) GHG emissions (in Mton CO2
eq); and (ii) Fleet LC GHG emissions per kilometer (in g CO2
eq/km). The first metric addresses the societal concern of re-ducing global GHG emissions. The second metric addresses the viewpoint of the policies that aim at reducing GHG emis-sions from LDVs by targeting specific emisemis-sions (e.g., per kilometer) of new vehicles or fleets of new vehicles. Examples of these policies are the European Union (EU) leg-islation, which set binding emission targets for new vehicle fleets, and the Corporate Average Fuel Economy (CAFE) standards in the USA, which aims at improving the fuel econ-omy of new vehicles sold in the USA, indirectly reducing their specific GHG emissions. GHG emissions were assessed using the IPCC2007method (IPCC2007).
3 Results and discussion
3.1 Model baseline
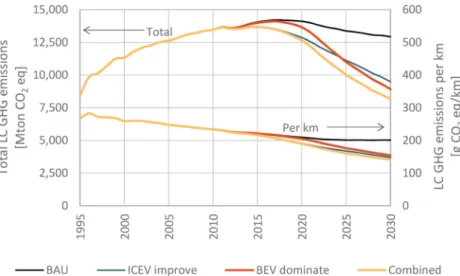
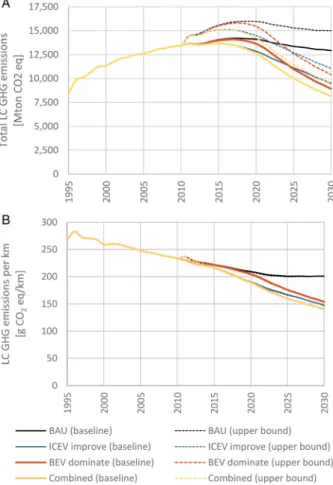
Figure 4 shows the LC GHG emissions evolution for each scenario. Total LC GHG emissions of the fleet increased from 1995 to 2010 due to an increase in fleet size. Nevertheless, a reduction of impacts per kilometer occurred, resulting from the rapid increase in market share of diesel ICEVs as well as a reduction in the fuel consumption of new gasoline ICEVs. Total LC GHG emissions of the fleet are expected to continue to increase until 2017 in the BAU scenario, due to the com-bined effect of fleet size and vehicle distance traveled growth. As the fleet size and distance traveled stabilize, a 4 % reduc-tion compared to 2010 is observed. This occurs because new vehicles entering the fleet are replacing older, higher-emitter
Table 1 Scenario description
Scenarios Market share by powertrain (q) Technology improvements Gasoline
ICEV
Diesel ICEV
BEV Vehicle weight reduction rate per year (ν)
Fuel consumption reduction rate per year (ϕ)
BEV battery weight reduction rate per year (ω)
2010 33 % 67 % 0.01 % – – – 2030 Business-as-usual (BAU) 33 % 67 % 0 % 0 % 0 % – ICEV improve 30 % 70 % 0 % 0.8 % 2.5 % – BEV dominate 0 % 0 % 100 % 0.8 % – 1.9 % Combined 0 % 0 % 100 % 0.8 % 2.5 % 1.9 %
vehicles. Even though the new vehicles are not improving over time, the overall fleet emissions are improved by the elimination of the older vehicles. Until 2025, reducing fuel consumption of new ICEVs (ICEV improve) has a larger effect on the LC GHG emissions than the introduction of BEVs in the fleet (BEV dominate), since it takes time for BEV share in the fleet to become significant. Nevertheless, a slightly higher reduction in 2010–2030 GHG emissions is obtained in this
scenario (34 %) than in the ICEV improve scenario (30 %). The Combined scenario leads to an extra 5 % reduction (39 %). LC GHG emissions per kilometer continue to de-crease for all scenarios (except the BAU, in which it stabilizes around 2025). A steeper reduction occurs in the Combined scenario (40 % decrease), while the ICEV improve (37 %) reaches a slightly higher reduction in 2030 than the BEV dominate scenario (34 %).
Fig. 3 Market share and fleet share of vehicle technologies in the Portuguese light-duty fleet for the Business-as-usual/ICEV improve (a and b, respectively) and BEV dominate/Combined (c and d, respectively) scenarios in 1995–2030. 1995–2010 data were retrieved from ACAP (2011)
Fig. 4 Total life-cycle (LC) GHG emissions of the fleet (left axis) and LC GHG emissions per kilometer (right axis) for the Business-as-usual (BAU), ICEV improve, BEV dominate, and Combined scenarios from 1995 to 2030
The shape of the curves and the ranking of scenarios ob-tained for Total fleet GHG emissions and GHG emission per kilometer analysis differ. While the Total fleet GHG emissions assessment shows that GHG emissions from the Portuguese LDV fleet have been increasing and only after 2015 will start to decrease, the GHG emissions per kilometer analysis shows a reduction tendency along time. This means that, although the emissions of an average kilometer traveled in the fleet have been decreasing, mainly because gasoline ICEVs have been replaced by diesel ICEVs, the absolute emissions from the fleet have increased, as a result of the increase in the number of vehicles and distance traveled. This effect cannot be captured by the per kilometer analysis. On the other hand, the ranking of scenarios in the Total GHG emission analysis is very dependent on the number of kilometers traveled by the fleet, which changes according to the scenario (a higher share of diesel ICEVs results in a higher total distance traveled). In the BEV dominate and Combined scenarios the total distance traveled by the fleet in 2030 is about 10 % lower than in the BAU and ICEV improve scenarios. This effect is discussed in the sensitivity analysis (Section3.2).
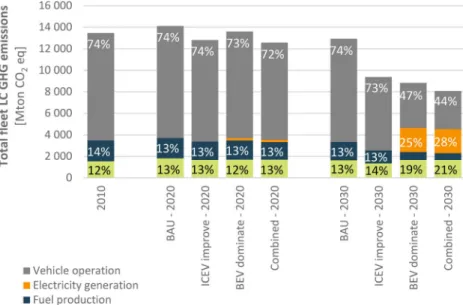
3.1.1 Contribution analysis
Figure 5shows the contribution of the life-cycle stages to the fleet LC GHG emissions in 2010, 2020, and 2030 for the four scenarios. The category Vehicle production, maintenance, and EoL includes materials production, ve-hicle assembly, maintenance, and end-of-life (EoL) im-pacts. In 2010–2020, the contribution of each stage varies little between scenarios (1–2 %) and the operation stage accounts for most of the fleet impacts (72–74 %). This trend continues in both BAU and ICEV improve scenarios in 2030. In the BEV dominate and Combined scenarios,
there is a shift of impacts from the fuel production to the electricity generation stage and, to a smaller extent, to the vehicle production, maintenance and EoL stages, in 2030. In absolute terms, vehicle operation impacts are reduced by 56–63 % compared to the BAU scenario, but indirect impacts (which include fuel production, electricity gener-ation, and vehicle production, maintenance, and EoL) in-crease by 36–39 %.
3.2 Sensitivity analysis
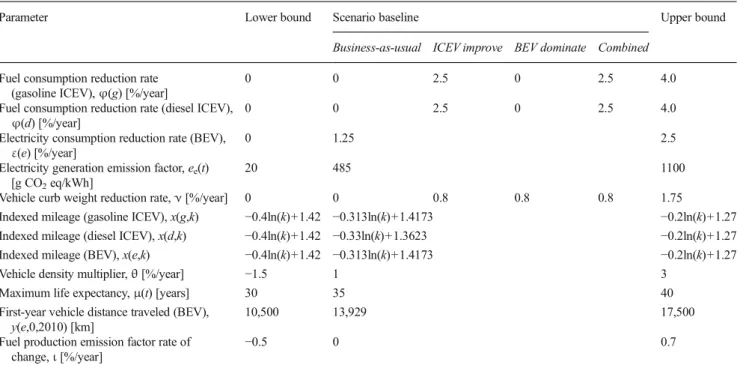
We performed a sensitivity analysis to assess the influence of different model parameters on the Total fleet LC GHG emissions and GHG emissions per kilometer in each scenario. We used the one-factor-at-a-time (OFAT) method and varied the parameters listed in Table2between their lower and upper bounds. The rationale behind the choice of the lower and upper bounds for each parameter is presented in the Electronic Supplementary Material. Detailed results of the sensitivity analysis are presented in Figs.S-14 to S-17(Total fleet LC GHG emissions) andS-18 to S-21(Fleet LC GHG emissions per kilometer) in the Electronic Supplementary Material. Table3 shows how the ranking between scenarios changes in the sensitivity analysis.
The sensitivity analysis for Total fleet LC GHG emissions in 2020 shows that the diesel ICEV indexed mileage (x(d,k)) and the vehicle density multiplier (θ) have the largest influ-ence in the results in all scenarios (variations of 9–17 %, as shown in Fig.S-15in the Electronic Supplementary Material). Nevertheless, varying these parameters does not change the ranking of the scenarios. On the other hand, although a change in the diesel ICEV fuel consumption reduction rate (φ(d)) leads to no more than 10 % variation in the fleet GHG emis-sions in 2020, if its value is close to its higher bound, the BEV
Fig. 5 Contribution of the life-cycle stages to the fleet LC GHG emissions in each scenario in 2010, 2020, and 2030
dominate scenario becomes better than the ICEV improve sce-nario. The other parameters do not significantly affect the total fleet GHG emissions in all scenarios (less than 8 % variation). Regarding 2030 results, although the diesel ICEV indexed
mileage (x(d,k)) and the vehicle density multiplier (θ) contin-ue to have a high inflcontin-uence in the results (11-19 %), the elec-tricity generation emission factor (ee(t)) is the parameter with
higher influence in the BEV dominate and Combined
Table 2 Parameters for sensitivity analysis. d: diesel ICEV; g: gasoline ICEV; e: BEV; k: vehicle age (in years)
Parameter Lower bound Scenario baseline Upper bound Business-as-usual ICEV improve BEV dominate Combined
Fuel consumption reduction rate (gasoline ICEV),φ(g) [%/year]
0 0 2.5 0 2.5 4.0
Fuel consumption reduction rate (diesel ICEV),
φ(d) [%/year] 0 0 2.5 0 2.5 4.0
Electricity consumption reduction rate (BEV),
ε(e) [%/year] 0 1.25 2.5
Electricity generation emission factor, ee(t)
[g CO2eq/kWh]
20 485 1100
Vehicle curb weight reduction rate,ν [%/year] 0 0 0.8 0.8 0.8 1.75
Indexed mileage (gasoline ICEV), x(g,k) −0.4ln(k)+1.42 −0.313ln(k)+1.4173 −0.2ln(k)+1.27 Indexed mileage (diesel ICEV), x(d,k) −0.4ln(k)+1.42 −0.33ln(k)+1.3623 −0.2ln(k)+1.27 Indexed mileage (BEV), x(e,k) −0.4ln(k)+1.42 −0.313ln(k)+1.4173 −0.2ln(k)+1.27 Vehicle density multiplier,θ [%/year] −1.5 1 3
Maximum life expectancy,μ(t) [years] 30 35 40
First-year vehicle distance traveled (BEV), y(e,0,2010) [km]
10,500 13,929 17,500
Fuel production emission factor rate of change,ι [%/year]
−0.5 0 0.7
Table 3 Ranking of scenarios according to the results of the sensitivity analysis (1—higher impact; 4—lower impact). Highlighted cells represent a change in the ranking of scenarios compared to the baseline.
Cell shading indicates the difference (Δ) in impacts between those cells, according to the legend. Parameters are defined in Table2. All parameters were analyzed, but only those whose ranking changed are presented here
scenarios (24–35 % variation) and the diesel ICEV fuel con-sumption reduction rate (x(d,k)) in the BAU and ICEV improve scenarios (up to 32 % variation). Nevertheless, varying these parameters does not change the ranking of the scenarios, ex-cept for the electricity generation emission factor, which, at its higher bound, makes the ICEV improve scenario better than the BEV dominate (−19 %) and Combined (−13 %) scenarios. When BEV distance traveled is increased to match ICEV dis-tance traveled (BEV first-year vehicle disdis-tance traveled, y(e,0, 2010), upper bound), the ICEV improve scenario becomes slightly better than the BEV dominate scenario (<0.5 %). The scrappage rate (described by the maximum life expectan-cy,μ(t)) has a higher influence in the BAU scenario (up to 14 % variation) than on the other scenarios (less than 7 %). Changing the fuel production emission factor (ι) has a higher influence in the ICEV scenarios (up to 11 % variation) than in the BEV scenarios (up to 5 %), as expected. All parameters increase their influence in the results as time passes; except the gasoline ICEV indexed mileage (φ(g)), which decreases, and the maximum life expectancy (μ(t)), which varies.
When we examine the LC GHG emissions per kilometer perspective, the sensitivity analysis shows little influence by all parameters (less than 10 % change) in 2020. In 2030, the diesel ICEV fuel consumption reduction rate (φ(d)) and the electricity generation emission factor (ee(t)) are the most
influ-ential parameters (up to 35 % change), similar to the Total fleet LC GHG emissions perspective. Keeping the other parameters constant, if diesel ICEV fuel consumption reduces enough, the Combined scenario may no longer be better than the ICEV improve scenario and the BAU scenario becomes slightly better than the BEV dominate scenario. This is because the diesel ICEV fuel consumption positively affects a higher number of vehicles in the BAU and ICEV improve scenarios (due to a higher diesel ICEV market share). Moreover, if the electricity generation emission factor increases significantly, the ICEV improve scenario becomes better than the Combined scenario and the BEV dominate becomes the scenario with higher im-pacts. The BEV dominate scenario becomes slightly better than the ICEV improve scenario if the BEV first-year distance trav-eled (y(e,0,2010)) or the fuel production emission factor (ι) approach the upper bound (1.3 and 0.3 %, respectively).
Results for Total fleet LC GHG emissions are sensitive to more parameters than GHG emissions per kilometer. In par-ticular, they are more sensitive to those parameters that affect the fleet dynamic, such as those that change the vehicle stock (vehicle density multiplier,θ), the scrappage rate (maximum life expectancy, μ(t)), and the activity level of the fleet (indexed mileage of diesel vehicles, x(d,k), which have higher distance traveled per vehicle). When we look at impacts per kilometer, the fleet size and turnover do not significantly affect the results. Only parameters influencing the operation (fuel consumption,φ(i), and electricity emission factor, ee(t)) play
a role in the impacts per kilometer. For example, an increase in
the fleet size (illustrated in Fig.6by assuming the upper bound figure for the vehicle density multiplier,θ) amplifies the total fleet impacts in all scenarios (resulting in a lower reduction of impacts in 2010–2030, and, in the BAU scenario, even an increase in the 2010–2030 impacts), without affecting the per-formance per kilometer. On the other hand, increasing the distance traveled by BEVs decreases GHG emissions per kilometer in the BEV dominate and Combined scenarios, while increasing the Total fleet LC GHG emissions. To achieve an effective reduction of the fleet GHG emissions, focus should be given not only on reducing operation impacts but also on reducing the fleet size and activity, and that can only be assessed through a Total fleet LC GHG emissions analysis.
3.3 Parametric analysis
The sensitivity analysis showed that: (i) total fleet GHG emis-sions should be examined in order to account for the charac-teristics of the fleet (size and activity level) that affect the fleet emissions over time; and (ii) the diesel ICEV fuel consump-tion reducconsump-tion rate and the electricity emission factor are the parameters that show higher variation in the 2030 GHG emis-sions (the latter being key for the ranking of scenarios). In this section, we look at how the fleet GHG emissions in 2030 change relative to the BAU scenario for different electricity emission factors, 2010–2030 new diesel ICEV fuel consump-tion reducconsump-tion, and BEV market shares (Fig.7).
At low BEV market shares, the BEV potential to reduce fleet GHG emissions compared to an all ICEV fleet is very low and the effect of the electricity emission factor is not very significant. As the BEV market share increases, the influence of the electricity emission factor in the GHG emission reduc-tion also increases—at 100 % market share, it increases by 4 % per 100 g CO2eq/kWh decrease. All things equal, BEV
introduction in the fleet has the potential to reduce total GHG emissions even if the electricity source is coal. However, as new ICEVs improve, the electricity emission factor becomes key for BEV introduction to be beneficial compared to ICEVs. Up to 780 g CO2eq/kWh (50/50 coal/natural gas mix),
im-proving ICEVs (ICEV improve scenario) is better than intro-ducing BEVs in the fleet, irrespective of the BEV market share. If ICEVs fuel consumption reduces by 80 %, introduc-ing BEVs is only better if the electricity emission factor is lower than 485 g CO2eq/kWh (current mix). A higher
reduc-tion (>15 %) in fleet GHG emissions from the introducreduc-tion of BEVs compared to improving ICEVs only occurs at high BEV market shares (>95 % in 2030, corresponding to a fleet fraction of more than 25 %) and electricity emission factors similar or lower to the current mix.
When a 50 % BEV and 50 % ICEV fleet is reached (100 % BEV market share in 2030), results show that halving the GHG emissions from BEVs by reducing the electricity mix
impacts is more effective than halving ICEVs emissions through reducing fuel consumption (13 % and 9 % reduction in fleet GHG emissions, respectively). This happens because fuel consumption reduction only affects new vehicles entering the fleet and it takes time for these new, higher-efficient vehi-cles to gain fleet share. On the contrary, the electricity emis-sion factor affects all BEVs in the fleet, irrespective of their age. The lag between now and the time high BEV adoption is realized may allow for the decarbonization of the grid neces-sary for BEVs to reach their full potential. On the other hand, a
lower rate of introduction of BEVs in the fleet may allow a quicker diffusion of high-efficient ICEVs, requiring a more aggressive decarbonization of the grid for BEV adoption to have a noticeable effect in overall fleet emissions.
4 Conclusions
We assessed the fleet-wide environmental impacts of displacing ICEVs by EVs across different scenarios and
Fig. 7 Reduction in total fleet GHG emissions in 2030 as a function of the 2030 BEV market share and the electricity emission factor for 80, 50, and 0 % 2010– 2030 diesel ICEV fuel
consumption reduction rates, compared to the Business-as-usual (BAU) scenario. NG natural gas
Fig. 6 Total life-cycle GHG emissions (a) and life-cycle GHG emissions per kilometer (b) in each scenario for the model baseline and assuming a higher vehicle density (upper bound value in Table2)
metrics. The analysis took into account the dynamic behavior of the fleet, including fleet turnover, technology improve-ments (e.g., reduction in fuel consumption of new vehicles, weight reduction), and changes in background processes (e.g., electricity mix, material GHG intensity) and vehicle activity (e.g., annual distance traveled) within the same framework. The analysis spanned 15 years into the past (1995) and 20 years into the future (2030).
We showed that it takes time for BEV share in the fleet to become significant and that only after 2025 does the effect of introducing BEVs in the fleet GHG emissions start to emerge. The reduction in the fleet GHG emissions from displacing ICEVs by BEVs is highly dependent on the BEV market share, new diesel ICEV fuel consumption reduction, and elec-tricity emission factor. Emissions reductions at the end of the assessment period (2030) are between 1 and 47 % when com-pared with a business-as-usual fleet (BAU scenario), and −16 % and 38 % if compared with an ICEV improved fleet that meets EU targets. For BEV introduction in the fleet to be beneficial compared to an increasingly more efficient ICEV fleet, a high BEV market share and electricity emission factor similar or lower to the current mix (485 g CO2eq/kWh) need
to be realized; these conclusions hold for the different condi-tions analyzed. We also found that halving the GHG emissions from BEVs by reducing electricity mix impacts has a larger effect on the overall fleet GHG emission reduction compared to halving GHG emissions from ICEVs by decreasing fuel consumption, but that effect may change depending on how the fleet evolves.
Besides the importance of the fuel consumption reduction rate of new ICEVs and the electricity mix emission factor, results were also sensitive to parameters that affect the fleet dynamic, such as those that change the vehicle stock, the scrappage rate, and the activity level of the fleet (11–19 % variation in total GHG emissions in 2030). The influence of these parameters also varies over time, becoming more impor-tant as time passes. These effects can only be captured by assessing total fleet GHG emissions as opposed to the GHG emissions per kilometer approach.
These results emphasize the importance of taking into ac-count the dynamic evolution of the fleet, technology improve-ments over time, and changes in vehicle operation and back-ground processes during the vehicle service life when assessing the potential benefits of displacing ICEVs by EVs in a fleet. These factors are usually not accounted for in the literature. Therefore, the fleet-based approach presented can provide a more comprehensive assessment of the adoption of an emerging technology, such as EVs, because it enables ex-plicit assessment of improvements and developments over time, and also indirect effects related with the existing system, such as the effects of displacing ICEVs. It can also provide the scale and timing for assessing other indirect impacts not in-cluded in this paper, such as the effects of BEV load in the
power grid. Moreover, this approach avoids fixed assumptions about vehicle service life, since impacts from vehicle produc-tion are accounted in the year the vehicles are produced and are independent from the time the vehicle is scrapped. Assumptions about vehicle service life are often indicated as having a significant influence in the environmental impact results of vehicles (Hawkins et al. 2013; Nordelöf et al. 2014). With this framework it is also possible to assess the effect of other measures to decrease impacts from transporta-tion, such as reducing the fleet size, decreasing the distance traveled by vehicles, and delaying or anticipating scrapping, and how they compare with EV adoption, which we leave for further research.
Acknowledgments This work is framed under the Energy for Sustain-ability Initiative of the University of Coimbra, Portugal, and the MIT-Portugal Program, and funded by FEDER through Programa Operacional Factores de Competitividade—COMPETE, and by Fundação para a Ciência e Tecnologia—FCT through the projects FCOMP-01-0124-FEDER-029055 (PTDC/EMS-ENE/1839/2012), FCOMP-01-0124-FEDER-021495 (PTDC/SEN-TRA/117251/2010), and CENTRO-07-0224-FEDER-002004. Rita Garcia gratefully ac-knowledges financial support from FCT through doctoral grant SFRH/BD/51299/2010. Constructive criticism of two anonymous re-viewers is also gratefully acknowledged.
Compliance with Ethical Standards The authors declare that they have no conflict of interest.
References
ACAP (2011) Estatísticas do Sector Automóvel, Edição de 2010. Lisboa, Portugal
Althaus H-J (2012) Modern individual mobility. Int J Life Cycle Assess 17:267–269
Austin S, Ross M (2001) History of emissions reductions: normal emit-ters in FTP-type driving. Society of Automotive Engineers 2001 Detroit Congress. p 12
Azevedo CL (2007) Métodos de Estimativa de Volumes Anuais de Tráfego Rodoviário– Um Modelo para Portugal. MSc thesis, Instituto Superior Técnico, Lisboa
Azevedo CL, Cardoso J (2009) Estimation of Annual Traffic Volumes: A Model for Portugal. Young Researchers Seminar 2009, Torino Bandivadekar A, Bodek K, Cheah L et al (2008) On the Road in 2035.
Massachusetts Institute of Technology, Cambridge, Massachusetts Baptista PC, Silva CM, Farias TL, Heywood JB (2012) Energy and
environmental impacts of alternative pathways for the Portuguese road transportation sector. Energy Policy 51:802–815
Bastani P, Heywood JB, Hope C (2012a) A forward-looking stochastic fleet assessment model for analyzing the impact of uncertainties on light-duty vehicles fuel use and emissions. SAE Tech Pap 5:452– 468
Bastani P, Heywood JB, Hope C (2012b) The effect of uncertainty on US transport-related GHG emissions and fuel consumption out to 2050. Transp Res A Policy Pract 46:517–548
Bastani P, Heywood JB, Hope C (2012c) U.S. CAFE Standards: Potential for meeting light-duty vehicle fuel economy targets, 2016-2025. Massachusetts Institute of Technology, Cambridge, Massachusetts
Bodek K, Heywood J (2008) Europe’s Evolving Passenger Vehicle Fleet: Fuel Use and GHG Emissions Scenarios through 2035. Massachusetts Institute of Technology, Cambridge, Massachusetts Cáceres CH (2009) Transient environmental effects of light alloy
substi-tutions in transport vehicles. Mater Des 30:2813–2822
Ceuster GD, Herbruggen BV, Ivanova O et al (2007) TREMOVE– Service contract for the further development and application of the transport and environmental. TREMOVE model Lot 1 (Improvement of the data set and model structure), Brussels, Belgium
Cheah L (2010) Cars on a diet: the material and energy impacts of pas-senger vehicle weight reduction in the U.S. PhD thesis, Massachusetts Institute of Technology, Cambridge, Massachusetts Cheah L, Heywood J (2011) Meeting U.S. passenger vehicle fuel
econ-omy standards in 2016 and beyond. Energy Policy 39:454–466 Das S (2000) The life-cycle impacts of aluminum body-in-white
automo-tive material. JOM 52:41–44
Das S (2005) Life cycle energy impacts of automotive liftgate inner. Resour Conserv Recycl 43:375–390
EPRI (2007) Environmental Assessment of Plug-In Hybrid Electric Vehicles - Volume 1. Nationwide Greenhouse Gas Emissions, Palo Alto European Commission (2014) EU Transport in Figures. Statistical
Pocketbook 2014. Publications Office of the European Union, Luxembourg
European Commission (2012) Proposal for a regulation of the European Parliament and of the Council amending Regulation (EC) No 443/ 2009 to define the modalities for reaching the 2020 target to reduce CO2 emissions from new passenger cars - Part I
Field F, Kirchain R, Clark J (2000) Life-cycle assessment and temporal distributions of emissions: developing a fleet-based analysis. J Ind Ecol 4:71–91
Freire F, Marques P (2012) Electric vehicles in Portugal: an integrated energy, greenhouse gas and cost life-cycle analysis. 2012 I.E. Int Symp Sustain Syst Technol (ISSST). doi:10.1109/ISSST.2012. 6227988
Frischknecht R, Flury K (2011) Life cycle assessment of electric mobility: answers and challenges-Zurich, April 6, 2011. Int J Life Cycle Assess 16:691–695
Gao L, Winfield ZC (2012) Life cycle assessment of environmental and economic impacts of advanced vehicles. Energies 5:605–620 Garcia R, Marques P, Freire F (2014) Life-cycle assessment of electricity
in Portugal. Appl Energy 134:563–572
Hawkins TR, Gausen OM, Strømman AH (2012) Environmental impacts of hybrid and electric vehicles—a review. Int J Life Cycle Assess 17: 997–1014
Hawkins TR, Singh B, Majeau-Bettez G, Strømman AH (2013) Comparative environmental life cycle assessment of conventional and electric vehicles. J Ind Ecol 17:53–64
Hillman KM, Sandén B a (2008) Time and scale in life cycle assessment: the case of fuel choice in the transport sector. Int J Altern Propuls 2:1–12 IEA (2013) Global EV Outlook: Understanding the Electric Vehicle
Landscape to 2020
INE (2009) Projecções de População Residente em Portugal 2008-2060. Lisboa, Portugal
IPCC (2007) Climate Change 2007: The Physical Science Basis. Contribution of Working Group I to the Fourth Assessment Report of the Intergovernmental Panel on Climate Change. Cambridge University Press, Cambridge, United Kingdom and New York, NY, USA Jungbluth N (2007) Erdöl. In: Sachbilanzen von energiesystemen:
grundlagen für den ökologischen vergleich von energiesystemen und den einbezug von energiesystemen in ökobilanzen für die schweiz. In: Dones R (ed) ecoinvent report No. 6-IV, Swiss Centre for Life Cycle Inventories, Dubendorf, CH
Keoleian G, Kelly J, MacDonald J et al (2011) Environmental Assessment of Plug-In Hybrid Electric Vehicles in Michigan: Greenhouse Gas Emissions, Criteria Air Pollutants, and Petroleum Displacement. University of Michigan, Ann Arbor, Michigan
Kim HC (2003) Shaping sustainable vehicle fleet conversion policies based on life cycle optimization and risk analysis. PhD thesis, University of Michigan, Ann Arbor, Michigan
Kim HC, Keoleian GA, Horie YA (2006) Optimal household refrigerator replacement policy for life cycle energy, greenhouse gas emissions, and cost. Energy Policy 34:2310–2323
Kim HC, Ross M, Keoleian G a (2004) Optimal fleet conversion policy from a life cycle perspective. Transp Res Part D: Transp Environ 9: 229–249
Kromer M a, Bandivadekar A, Evans C (2010) Long-term greenhouse gas emission and petroleum reduction goals: Evolutionary pathways for the light-duty vehicle sector. Energy 35:387–397
Leduc G, Mongelli I, Uihlein A (2010) How can our cars become less polluting? An assessment of the environmental improvement poten-tial of cars. Transp Policy 17:409–419
Lucas A, Alexandra Silva C, Costa Neto R (2012) Life cycle analysis of energy supply infrastructure for conventional and electric vehicles. Energy Policy 41:537–547
Marques P, Garcia R, Freire F (2013) Life cycle assessment of electric and conventional cars in Portugal. Energy for Sustainability 2013, Sustainable Cities: Designing for People and the Planet, Coimbra McCleese DL, LaPuma PT (2002) Using Monte Carlo simulation in life
cycle assessment for electric and internal combustion vehicles. Int J Life Cycle Assess 7:230–236
Melaina M, Webster K (2011) Role of fuel carbon intensity in achieving 2050 greenhouse gas reduction goals within the light-duty vehicle sector. Environ Sci Technol 45:3865–3871
Messagie M, Boureima F-S, Coosemans T et al (2014) A range-based vehicle life cycle assessment incorporating variability in the envi-ronmental assessment of different vehicle technologies and fuels. Energies 7:1467–1482
Moura F (2009) Car organ transplant—anticipating energy and environ-mental benefits of cleaner technologies. PhD thesis, Instituto Superior Técnico, Lisboa
Nordelöf A, Messagie M, Tillman A-M et al (2014) Environmental im-pacts of hybrid, plug-in hybrid, and battery electric vehicles—what can we learn from life cycle assessment? Int J Life Cycle Assess 19: 1866–1890
Noshadravan A, Cheah L, Roth R et al (2015) Stochastic comparative assessment of life-cycle greenhouse gas emissions from convention-al and electric vehicles. Int J Life Cycle Assess. doi:10.1007/ s11367-015-0866-y
Plotkin S, Singh M (2009) Multi-Path Transportation Futures Study: Vehicle Characterization and Scenario Analyses. Argonne National Laboratory, Argonne, IL, USA
PORDATA (2011) População Residente. In: PORDATA Base dados Port. Contemp.www.pordata.pt. Accessed 20 Feb 2012
Reichmuth DS, Lutz AE, Manley DK, Keller JO (2013) Comparison of the technical potential for hydrogen, battery electric, and conven-tional light-duty vehicles to reduce greenhouse gas emissions and petroleum consumption in the United States. Int J Hydrog Energy 38:1200–1208
Samaras C, Meisterling K (2008) Life cycle assessment of greenhouse gas emissions from plug-in hybrid vehicles: implications for policy. Environ Sci Technol 42:3170–3176
Silva M (2011) Electric vehicle diffusion in the Portuguese automobile market. MSc thesis, Instituto Superior Técnico, Lisboa
Stasinopoulos P, Compston P, Newell B, Jones HM (2011) A system dynamics approach in LCA to account for temporal effects—a con-sequential energy LCI of car body-in-whites. Int J Life Cycle Assess 17:199–207
Yokota K, Matsuno Y, Yamashita M, Adachi Y (2003) Integration of Life Cycle assessment and population balance model for assessing envi-ronmental impacts of product population in a social scale case stud-ies for the global warming potential of air conditioners in Japan. Int J Life Cycle Assess 8:129–136