HAL Id: hal-00317136
https://hal.archives-ouvertes.fr/hal-00317136
Submitted on 1 Jan 2002
HAL is a multi-disciplinary open access
archive for the deposit and dissemination of
sci-entific research documents, whether they are
pub-lished or not. The documents may come from
teaching and research institutions in France or
abroad, or from public or private research centers.
L’archive ouverte pluridisciplinaire HAL, est
destinée au dépôt et à la diffusion de documents
scientifiques de niveau recherche, publiés ou non,
émanant des établissements d’enseignement et de
recherche français ou étrangers, des laboratoires
publics ou privés.
Positive storm effects in the dayside polar ionospheric
F-region observed by EISCAT and ESR during the
magnetic storm of 15 May 1997
S. Y. Ma, H. T. Cai, H. X. Liu, K. Schlegel, G. Lu
To cite this version:
S. Y. Ma, H. T. Cai, H. X. Liu, K. Schlegel, G. Lu. Positive storm effects in the dayside polar
ionospheric F-region observed by EISCAT and ESR during the magnetic storm of 15 May 1997.
Annales Geophysicae, European Geosciences Union, 2002, 20 (9), pp.1377-1384. �hal-00317136�
Annales
Geophysicae
Positive storm effects in the dayside polar ionospheric F-region
observed by EISCAT and ESR during the magnetic storm
of 15 May 1997
S. Y. Ma1, H. T. Cai1, H. X. Liu2, K. Schlegel3, and G. Lu2
1Dept. of Space Physics, College of Electronic Information, Wuhan University, Wuhan 430072, P. R. China
2High Altitude Observatory, National Center for Atmospheric Research, 3450 Mitchell Lane, Boulder, CO 80301, USA 3Max-Planck-Institut f¨ur Aeronomie, D-37191 Katlenburg-Lindau, Germany
Received: 11 October 2001 – Revised: 22 April 2002 – Accepted: 14 May 2002
Abstract. EISCAT/ESR radar data and in situ FAST and PO-LAR satellite observations are coordinately analyzed to in-vestigate positive ionospheric storm effects in the dayside up-per F-region in both the polar cap and the auroral oval during the magnetic storm of 15 May 1997. An ionization enhance-ment, lasting for about 2.5 h, appeared first over the EIS-CAT site around magnetic noon; about one hour later, a sim-ilar ionization enhancement was also seen over ESR. During the concerned time period ion energy spectra measured on board FAST show clearly continuous energy-latitude disper-sion when the satellite passed by over the EISCAT latitude. This implies that EISCAT was located under the polar cusp region which was highly active, and expanded greatly equa-torwards due to magnetopause reconnections during long-lasting southward IMF. Simultaneously, soft particles of the magnetosheath precipitated into the F-region ionosphere and caused the positive storm effects over EISCAT. The coinci-dent increase in electron temperature at EISCAT gives ad-ditional evidence for soft particle precipitation. Consistently, POLAR UV images show strong dayside aurora extending to as low as 62◦N magnetic latitude. The ionization enhance-ment over ESR, however, seems not to be caused by local particle precipitation, evidenced by a lack of enhanced elec-tron temperature. The observed plasma convection velocity and data-fitted convection patterns by AMIE suggested that it is likely to be a polar patch originating from the cusp region and traveling to the ESR site.
Key words. Ionosphere (auroral ionosphere; particle percip-itation). Magnetospheric physics (storms and substorms)
1 Introduction
Ionization enhancements in the ionospheric F-region re-sponding to magnetic storms are usually called positive iono-spheric storms. Morphology and physical mechanisms of
Correspondence to: S. Y. Ma ([email protected])
positive ionospheric storms at mid- and low-latitudes have been investigated extensively in recent decades (e.g. Rish-beth et al., 1987; Fuller-Rowell et al., 1990, 1994; Danilov & Berlik, 1992; Pr¨olss, 1995; Mikhailov et al., 1995; Nam-galadze et al., 2000; and references therein). The physics for this phenomenon involves F-region uplifting towards lower recombination loss regions by an enhanced equatorward neu-tral wind excited in the heated auroral region, the thermo-spheric composition changes of O/N2, and the electric field caused by the disturbance dynamo effect, etc. In contrast, positive storm effects in the polar F-region are often associ-ated with an impact of soft particles precipitating from mag-netospheric source regions. For the magnetic noon sector of the auroral oval, the particles precipitate from four dis-tinct regions: (i) the magnetosheath through active cusp, (ii) the plasma-mantle through the region poleward of the cusp, (iii) the low-latitude boundary layer between the dawn and evening flanks through the so-called cleft, and (iv) the day-side boundary plasma sheet (Newell and Meng, 1988, 1989; Newell et al., 1991; Kennel, 1995; Lyons et al., 1999). Of them, the relation of positive polar ionospheric storm and active cusp is quite acute and has received the attention of scientists for a long time (e.g. Danilov et al., 1987; Danilov, 2001).
On the other hand, it is evident that enhancements in the electron density of the ionospheric F-region created by cusp/cleft particle precipitation at the dayside entry to the polar-cap convection flow play an important role in the for-mation of polar-cap patches (e.g. Valladares et al., 1994; Walker et al., 1999; Smith, et al., 2000). Most of these ob-servations, however, are not related to magnetic storms. Dur-ing the magnetic storm of 15 May 1997, both the EISCAT radar (geog. lat. 69.6◦N, long. 19.2◦E) and the EISCAT-Svalbard radar (ESR, geog. lat. 78.0◦N, long. 16.0◦E) were in operation and caught the storm simultaneously dur-ing its main phase at the dayside sector. In our previous paper (Liu et al., 2000), it was indicated that, according to calcu-lations by means of the T96–01 magnetic field model
(Tsy-1378 S. Y. Ma et al: Positive storm effects in the dayside polar ionospheric F-region 200 300 400 500 600 V /( km s ) sw 3 6 9 12 15 18 21 0 24 -1
WIND Satellite 15 May 1997
-5 0 5 10 15 20 P /n P sw 3 6 9 12 15 18 21 24 0 -30 -20 -10 0 10 20 30 B / nT y 3 6 9 12 15 18 21 0 24 -30 -20 -10 0 10 20 30 B / nT z 3 6 9 12 15 18 21 0 24 0 3 6 9 12 15 18 21 24 UT / h -150 -100 -50 0 50 D / nT May 15, 1997 st Kp 0 2 4 6 8
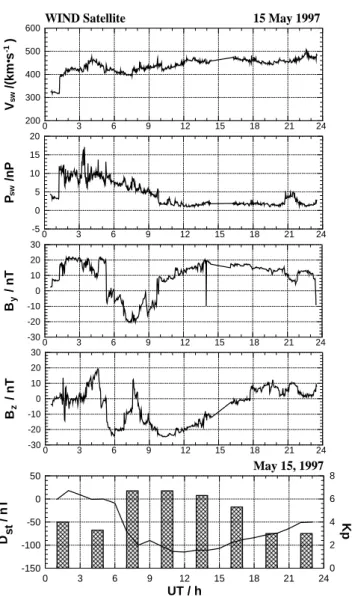
Figure 1. (a) Solar wind speed, (b) Solar wind dynamical pressure, (c) IMF By, (d) IMF Bz, (e) Magnetic indices of Dst and Kp. The solar wind and IMF parameters were recorded on the
WIND satellite on May 15, 1997.
Fig. 1. (a) Solar wind speed, (b) Solar wind dynamical pressure, (c)
IMF By, (d) IMF Bz, (e) Magnetic indices of Dstand Kp. The solar
wind and IMF parameters were recorded on the WIND satellite on 15 May 1997.
ganeko, 1996), ESR was in the dayside polar cap during the main phase and the beginning of the recovery phase of the 15 May 1997 storm, while EISCAT was in the dayside au-roral oval or on its poleward boundary, being in agreement with the UV images taken from the ultraviolet imager (UVI) on board the POLAR satellite. This provides a valuable op-portunity to investigate storm effects in the dayside auroral oval and in the polar cap regions simultaneously. A com-parative study mainly on the negative storm effects observed by EISCAT and ESR radar during this storm has been made in our paper mentioned above. In this contribution, we will focus our attention on a dayside F-region positive storm su-perposed on the long-lasting negative phase of this storm.
2 Observation results
2.1 Interplanetary conditions and geomagnetic indices Figure 1 shows solar wind and IMF data from the WIND spacecraft, together with the Dst and Kp indices for 15 May 1997. WIND observed the passage of an interplan-etary shock at 01:16 UT, followed by several hours of high solar wind dynamic pressure. The IMF turned southward at 04:46 UT, indicating the arrival of the magnetic cloud at the WIND location (Cane et al., 1998). The IMF Bzshows two minima, with the first of −24.3 nT at 05:56 UT and the second of −24.7 nT at 10:23 UT. The IMF Bz experienced reversals from south to north, then back to south between the two minima. WIND was located at Xse = 1.21 × 10⁶km at 12:00 UT and the X component of the solar wind velocity
Vx was −440 km/s, giving a travelling time of 43 min from the position of the WIND spacecraft to the subsolar mag-netopause. The Dst index rose slightly at 01:59 UT, indi-cating a storm sudden commencement (SSC) caused by the interplanetary shock at 01:16 UT (Cane et al., 1998). Af-ter being nearly constant for four hours, it decreased rapidly and reached a minimum of −115 nT. Afterwards it recov-ered gradually to the normal level. The maximum Kpvalue was 7−.
For the period around the maximum of the magnetic storm main phase that is concerned in this paper, the IMF Bz re-mained less than −20 nT, i.e. being very intense and directed southward; while the IMF By underwent an excursion from about −10 nT to 20 nT. The solar wind dynamic pressure stayed at a low level of about 2–4 nPa.
2.2 Positive storm observed by EISCAT
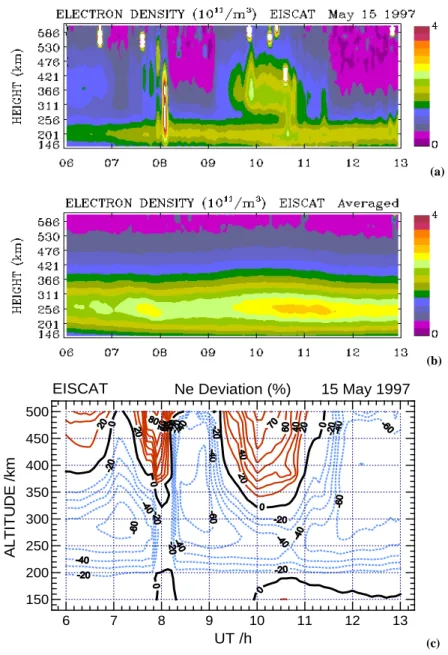
Figure 2a shows a 2-D image of F-region electron den-sity distribution versus UT and height at the EISCAT site during 06:00–13:00 UT. It can be clearly seen that a sta-ble layer of ionization enhancement which peaked at about 350 km height appeared during 09:10–11:30 UT (∼11:05– 13:25 MLT, MLT≈UT+1.9 h) in the upper F-region. For comparison, Fig. 2b gives a reference that is an average of available observations on some quiet days with maximum of
Kpless than 3 during April to June of 1997. Figure 2c shows the percentage deviation of the electron density on 15 May with respect to the reference. Considering the possible day-to-day variations of Neat about 20% or more, only the storm-time deviations with magnitude larger than 20% are referred to as storm effects. Thus, it indicates that strong positive storm effects took place above 340 km, lasting for about 2 h from 09:15–11:00 UT (∼11:10–12:55 MLT), superposed on a negative effect background. The maximum deviation is lo-cated above 450 km with a magnitude larger than 80%.
The very strong, short ionization enhancement around 08:06 UT, which extended from the E-region to the high up-per F-region, is probably a satellite echo.
(a) (b) 6 7 8 9 10 11 12 1 UT /h 3 150 200 250 300 350 400 450 500 A L TI TU D E / k m Ne Deviation (%) 15 May 1997 EISCAT (c) Figure 2. (a) 2-D image of electron density distribution vs. UT and height at EISCAT site on May 15, 1997; (b) The same as figure 2a but for a reference that is resulted from an average of observations on some quiet days in April and June of 1997; (c) Deviation of electron density during the magnetic storm of May 15, 1997 with respect to the quiet reference.
Fig. 2. (a) Two-dimensional image of electron density distribution vs. UT and height at the EISCAT site on 15 May 1997, (b) the same as Fig. 2a but for a reference that is an average of the observations on some quiet days in April and June of 1997, (c) deviation of electron density during the magnetic storm of 15 May 1997 with respect to the quiet reference.
2.3 Positive storm observed at ESR
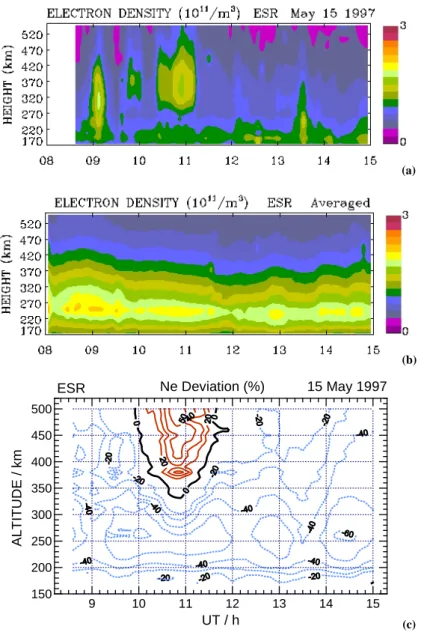
Figure 3a shows a 2-D distribution of electron density ver-sus UT and height observed at the ESR site on 15 May 1997. It is seen that an ionization enhancement which peaked at about 380 km height appeared during 10:20–11:15 UT in the upper F-region. In comparison with the one observed at the EISCAT site, the peak height was about 40 km higher. Fig-ure 3b gives a reference that is an average of the available observations on some quiet days, with maximum of Kpless than 3 during April to June of 1997. Figure 3c represents the percentage deviation of electron density on 15 May with respect to the reference. It shows that strong positive storm effects took place above 370 km, between 10:20–11:30 UT,
superposed on a negative effect background. The deviation is peaked at 380 km and above 470 km with a magnitude of larger than 50%. In comparison with the observations at the EISCAT site, the positive storm effects seem weaker, and ap-peared one hour later, lasting about one hour shorter. Be-sides, we can see from Fig. 3a that F-region ionization en-hancements also occurred around 09:10 UT and 09:50 UT. They were superposed on a negative storm phase, showing no obvious increase in electron density in comparison with the reference (see Fig. 3c). Simultaneous measurements of
Neand Teduring the time periods mentioned above indicated (shown later in Sect. III) that they were associated with local soft particle precipitation. These enhancements of electron densities will not be regarded much in this paper, while we
1380 S. Y. Ma et al: Positive storm effects in the dayside polar ionospheric F-region (a) (b) 9 10 11 12 13 14 1 UT / h 5 150 200 250 300 350 400 450 500 A LT IT U D E / k m Ne Deviation (%) 15 May 1997 ESR (c)
Figure 3. (a) 2-D image of electron density distribution vs. UT and height at E-Svalbard site; (b) The same as figure 3a but for a reference that is resulted from an average of observations on some quiet days in April and June of 1997; (c) Deviation of electron density during the magnetic storm of May 15, 1997 at Svalbard with respect to the quiet reference.
Fig. 3. (a) Two-dimensional image of electron density distribution vs. UT and height at ESR, (b) the same as Fig. 2a but for a reference that is an average of the observations on some quiet days in April and June of 1997, (c) deviation of electron density during the magnetic storm of 15 May 1997 with respect to the quiet reference at ESR.
focus our attention on the positive storm appearing between 10:20–11:30 UT.
3 Discussion
3.1 Particle precipitation as a source of the dayside positive storm at EISCAT
3.1.1 Evidence of association with local soft electron pre-cipitation
Figure 4 shows time variations of electron density Ne and temperature Te at 344 km height observed with the EISCAT radar during the concerned positive storm phase. We can see that Neand Tecoincidently increased at 09:06 UT, jumping
rapidly from 0.57×10¹¹to 1.23×10¹¹el./m3for N
eand from 1890 K to 2600 K for Te, within 10 min. At about 11:30 UT, both recovered to the original level. This implies that the considered upper F-region ionization enhancement at EIS-CAT is related to soft electron precipitation. According to simulation results of Millward et al. (1999), the energies of the precipitating electrons are probably centered at around a few hundred eV, suggesting magnetosheath-like particles. 3.1.2 Association with the active cusp
To confirm that EISCAT was indeed under the cusp region during the concerned time period, particle measurements from the FAST satellite are examined. Between 09:41– 09:56 UT, FAST passed over the northern polar region and
S. Y. Ma et al: Positive storm effects in the dayside polar ionospheric F-region 1381 8 9 10 11 12 13 UT /h 0 1 2 3 4 Ne /( 10 el . m ) 11 -3 Te / K 1000 2000 3000 4000 0 Te Ne EISCAT 15 May 1997 H=344 km
Fig. 4 Ne and Te versus UT at 344 km height observed with EISCAT radar.
Fig. 4. Neand Te versus UT at 344 km height observed with the EISCAT radar.
took a snapshot of energetic particles at heights of 380– 1340 km over the auroral and the polar cap region. In par-ticular, the Time-of-Flight Energy Angle Mass Spectrograph recorded a characteristic ion energy-latitude dispersion of cusp precipitating particles (Shelley et al., 1976; Reiff et al., 1977; Lockwood and Smith, 1994) between 09:41:38– 09:43:40 UT, as shown in Fig. 5. The main ion composi-tion of the precipitacomposi-tion is H+, with energies dispersing from about 10 keV to 30 eV (see top panel of Fig. 5); the ener-gies of precipitating electrons range from 50 eV to 1000 eV (not given here). Ions with higher energy are observed first at lower latitudes. With poleward convection of newly opened force lines, ions with lower energy are then seen at higher latitudes. Within this time interval FAST orbited at 401– 470 km, the geographic latitude of the force line foot-point tracing to FAST ranged from 68.3◦to 75.9◦N, and the local time was between 13:35 and 14:20 LT. It is obvious that the satellite trajectory covered the latitude of the EISCAT site at the equatorward edge of the ion dispersion region. It is evi-dent, therefore, that EISCAT was continually under the cusp region during the concerned interval, and the F-region pos-itive storm effects around magnetic noon can be attributed to clef/cusp/plasma-mantle precipitation due to continuous reconnection at the dayside magnetopause. An exact deter-mination of the specified particle precipitation region is not easy due to a lack of necessary particle data over the EISCAT site.
3.1.3 Evidence of strong dayside aurora near EISCAT by POLAR UVI
An UV image of aurora observed on the POLAR satellite at 09:52 UT (see Fig. 6) gives another evidence that during the considered time interval, EISCAT was probably located under or adjacent to the cusp region, where strong dayside aurora appeared. Thus, the sources of positive storm effects in the upper F-region are likely to be the cleft/cusp/plasma-mantle particle precipitation.
3.2 Source of the positive storm at ESR
Figure 7 shows the electron density and temperature ob-served by the ESR radar during 08:30 UT to 15:00 UT at 380 km height, where the maximum positive storm effect appeared. Since there is a data gap in Te at 380 km, be-tween 09:30–10:00 UT, the relevant variations of Neand Te at the adjacent height of 416 km are also given in this fig-ure. We can see that enhancements in electron density around 09:10 UT and 09:50 UT are accompanied by a remarkable in-crease in electron temperature, suggesting their association with local soft particle precipitation. It has been shown in our previous paper (Liu et al., 2000) that these two electron enhancements are peak-to-peak correlated with a large pulse-like increase in solar wind dynamic pressure by pressure-controlled soft particle precipitation. On the other hand, there is no remarkable increase in electron temperature accompa-nying the “blob” between 10:40 UT to 11:10 UT. This means that local particle precipitation did not cause the concerned “blob”. Long-lasting large ion upflow (Liu et al., 2000) may also be a possible evidence that the positive storm at ESR is probably not attributed to local particle precipitation. These facts lead us to transportation effects due to plasma convec-tion flow and thermospheric circulaconvec-tion for the positive F-region storm at ESR.
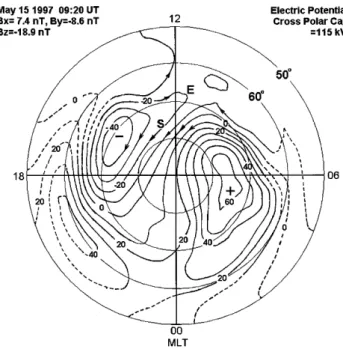
It is shown in Fig. 8 that the northward plasma convection over EISCAT during 09:20–10:20 UT exhibits an average speed of about 250 m/s. The east-west flow velocity of the enhanced plasma cloud travelling out from the EISCAT site around the merging gap region is expected to undergo com-plex changes due to IMF By switching from dawnward to duskward. We checked the polar ionospheric convection pat-terns during 09:20–10:00 UT that were calculated by AMIE (Assimilative Mapping of Ionospheric Electrodynamics) of NCAR (Richmond, 1992). The patterns show that EISCAT was near the merging gap on the dusk convection cell, while ESR was within the polar cap on the same cell. Furthermore, two radar stations were located on the nearly equal or slightly different potential lines (i.e. on nearly the same convection line), as shown in Fig. 9. The speed along the convection line was at a level of about 200–600 m/s by a rough estimate. Therefore, it is very likely that the high density plasma cloud created near EISCAT may travel toward and reach the ESR site in 1 to 1.5 h, although an exact demonstration should be made of tracing the plasma parcel trajectory. So, we suppose that the upper ionospheric ionization enhancement observed by ESR is probably a travelling polar patch originated from around the cusp region and convected to the ESR site.
4 Summary
In this paper, EISCAT/ESR radar data and in situ FAST and POLAR satellite observations have coordinately been ana-lyzed to investigate positive ionospheric storm effects in the dayside upper F-region in both the polar cap and the auroral oval during the magnetic storm of 15 May 1997. We found
1382 S. Y. Ma et al: Positive storm effects in the dayside polar ionospheric F-region
FAST Ion Energy Spectrum 15 May 1997
⇑ UT 09:40 09:42 09:44 09:46 LT 12:55 13:19 14:10 16:28 ILAT 55.4 62.5 68.4 72.5 BLAT 61.5 69.5 77.0 82.5 (° N) ALT 382 382 510 573 (km)
Figure 5. Ion Energy Spectra observed by FAST satellite on May 15, 1997. The arrow blow the figure indicates roughly the location of the equatorward edge of the ion dispersion region.
Fig. 5. Ion Energy Spectrum observed on the FAST satellite on 15 May 1997. The arrow below the picture indicates roughly the location of the equatorward edge of the ion dispersion region.
POLAR UV Image (vs. MLAT/MLT) at 09:52:00 UT on 15 May 1997
Figure 6. UV Image of aurora taken on POLAR satellite at 09:52 UT. The triangle indicates roughly the location of EISCAT and the rectangle is for ESR.
Fig. 6. UV Image of aurora taken on the POLAR satellite at 09:52 UT on 15 May 1997. The triangle indicates the location of EISCAT and the rectangle is for ESR.
S. Y. Ma et al: Positive storm effects in the dayside polar ionospheric F-region 1383 8 9 10 11 12 13 14 15 UT /h 0 1 2 3 4 5 N e /(10 m ) 11 -3 T /K 2000 3000 4000 0 Te Ne E-Svalbard 15 May 1997 H=416km 1000 5000 H=380km e
Figure 7. Time-variations of Ne and Te at 380km and 416 km height observed at Svalbard.
Fig. 7. Time variations of Neand Teat 380 km and 416 km height observed at Svalbard. 8 9 10 11 12 -2500 -1500 -500 500 1500 Io n Dr ift / (m s ) V V EISCAT CP1 15 May 1997 east north -1 H=250km UT / h -20 -10 0 10 20 B / nT x, y 09 08 10 11 12
WIND Satellite 15 May 1997
Bx By
Figure 8. Ion drift velocity perpendicular to magnetic field observed at EISCAT.IMF Bx and By, which affect the ion velocity, are shown at the bottom.
Fig. 8. Ion velocity perpendicular to the magnetic field observed at
EISCAT. IMF Bxand By, which affect the ion velocity, are shown
at the bottom.
that a strong ionization enhancement appeared first over the EISCAT site around magnetic noon. The maximum per-centage enhancement in electron density is as high as 80%, with respect to a quiet reference level, and the positive storm phase lasted for 2 h. About one hour later, a similar ion-ization enhancement was seen over ESR, with weaker en-hancement and shorter duration. During the concerned time period, ion energy spectra measured on board FAST show clearly continuous energy-latitude dispersion when the satel-lite passed by over the EISCAT latitude. Consistently, PO-LAR UV images show strong dayside aurora extended down
Figure 9 Polar ionospheric convection pattern at 09:20 UT on May 15, 1997 produced by means of AMIE. Character E indicates EISCAT and S is for E-Svalbard.
Fig. 9. Polar ionospheric convection pattern at 09:20 UT on 15 May 1997 produced by means of AMIE. Character E indicates EISCAT and S is for E-Svalbard.
to 62◦N magnetic latitude. This implies that EISCAT was located under the polar cusp region and soft particles from the magnetosheath precipitated into the F-region ionosphere, leading to the positive storm effects over EISCAT. The cusp region was highly active and expanded greatly equatorwards due to magnetopause reconnection during long-lasting south-ward IMF. The coincident increase in electron temperature gives additional evidence for soft particle precipitations.
On the other hand, the ionization enhancement over ESR seems not to be caused by local particle precipitation, since no enhanced electron temperature was obviously ob-served. The polar ionospheric convection patterns produced by means of AMIE, as well as plasma convection velocity around the merging gap region under IMF By conditions turning from dawnward (By < 0) to duskward (By > 0), suggests that the positive storm phase seen at ESR was prob-ably a polar patch that originated from the active cusp region and travelled to the ESR site.
Acknowledgements. We are grateful to the director and staff of
EIS-CAT for operating the facility and supplying the data. EISEIS-CAT is supported by Finland (SA), France (CNRS), Germany (MPG), Japan (NIPR), Norway (NAFN), Sweden (NFS), and the United Kingdom (PPARC). Thanks to all the relevant investigators of ISTP (WIND, FAST, POLAR spacecraft) for providing the data through CDAWeb. This study is granted by National Natural Science Foun-dation of China (No. 40074039) and China Ministry of Science and Technology for Major Basic Science Research (G2000 078407).
Topical Editor M. Lester thanks G. Millward and H. Rishbeth for their help in evaluating this paper.
1384 S. Y. Ma et al: Positive storm effects in the dayside polar ionospheric F-region References
Cane, H. V., Richardson, I. G., and St Cyr, O. C.: The interplane-tary events of January-May, 1997 as inferred from energetic par-ticle data, and their relationship with solar events, Geophys. Res., Lett., Vol. 25, 2517–2520, 1998.
Danilov, A. D.: F2-region response to geomagnetic disturbances, J. Atmos. Solar-Terr. Physics, 63, 441–449, 2001.
Danilov, A. D. and Berlik, L. D.: Thermospheric composition and the positive phase of an ionospheric storm, Adv. Space Res., 12, 257–260, 1992.
Danilov, A. D., Morozova, L. D., Dachev, Ts., and Kutiev, I.: Posi-tive phase of ionospheric storms and its connection with the day-side cusp, Adv. Space Res., 7, 81–88, 1987.
Fuller-Rowell, T. J., Codrescu, M. V., Moffett, R. J., and Que-gan, S.:Response of the thermosphere and ionosphere to geomag-netic storms, J. Geophys. Res., 99, 3893–3914, 1994.
Fuller-Rowell, T. J., Rees, D., Tinsley, B. A., Rishbeth, H., and Rodger, A. S.: Modelling the response of the thermosphere and ionosphere to geomagnetic storms – effects of a mid-latitude heat source, Adv. Space Res., 10, 215–223, 1990.
Kennel, C. F.: The reconnecting Magnetosphere, Chapter 5 of “Convection and Substorm – Paradigms of Magnetospheric Phe-nomenology”, Oxford University Press, New York, 1995. Liu, H., Schlegel, K., and Ma, S. Y.: Combined ESR and EISCAT
observations of the dayside polar cap and auroral oval during the May 15, 1997 storm, Ann. Geophys., 18, 1067–1072, 2000. Lockwood, M. and Smith, S. E.: Low and middle altitude cusp
par-ticle signatures for general magnetopause reconnection rate vari-ations. 1: Theory, J. Geophys. Res., 99, 8531–8553, 1994. Lyons, L. R., Koskinen, H. E. J., Blake, J. B., Gaglis, I.,
Lemaire, J. F., Moldwin, M. B., Orsini, S., Thorne, R. M., and Wolfe, R. A.: Processes leading to plasma losses into the high-latitude atmosphere, Space Sci. Rev., 88, 85–135, 1999. Makhailov, A. V., Skoblin, M. G., and Foerster, M.: Daytime F-2
layer positive storm effects at middle and lower latitude, Ann. Geophys., 13, 532–540, 1995.
Millward, G. H., Moffett, R. J., Balmforth, H. F., and Rodger, A. S.: Modeling the ionospheric effects of ion and electron precipita-tion in the cusp, J. Geophys. Res., 104, 24 603–24 612, 1999. Namgaladze, A. A., Forster, M., and Yurik, R. Y.: Analysis of the
positive ionospheric response to a moderate geomagnetic storm using a global numerical model, Ann. Geophys., 18, 461–477, 2000.
Newell, P. T. and Meng, C.-I.: The cusp and the cleft/boundary layer: low-altitude identification and statistical local time varia-tion, J. Geophys. Res., 93, 14 549–14 556, 1988.
Newell, P. T. and Meng, C.-I.: On quantifying the distinctions be-tween the cusp and the cleft/LLBL, in: Electromagnetic Cou-pling in the Polar Cleft and cusp, NATO ASI Sec. C, Vol.278, eds: P. E. Sandholt and A. Egeland, p. 87, Kluwer Academic, Dordrecht, 1989.
Newell, P. T., Burke, W. J., Sanchez, E. R., Meng, C. I., Greenspan, M. E., and Clauer, C. R.,: The low-latitude boundary layer and the boundary plasma sheet at low altitude: pre-noon precipitation regions and convection reversal boundaries, J. Geo-phys. Res., 96, 21 013–21 023, 1991.
Pr¨olss, G. W.: Ionospheric F-region storms, in: Handbook of atmo-spheric Electrodynamics, Vol. 2, ed.: H. Volland, 195–248, CRC press, Boca, Raton, FL, 1995.
Reiff, P. H., Hill, T. W., and Burch, J. L.: Solar wind plasma injec-tion at the dayside magnetospheric cusp, J. Geophys. Res., 82, 479–491, 1977.
Richmond, A. D.: Assimilative Mapping of Ionospheric electrody-namics, Adv. Space Res., 12, 59–68, 1992.
Rishbeth, H., Fuller-Rowell, T. J., and Rodger, A. S.: F-layer storms and thermospheric composition, Special Committee on Solar Terrestrial Physics, Quadrennial International Solar-Terrestrial Physics Symposium, 6th, Toulouse, France, June 23–27, 1986, Physica Scripta, 36, 327–336, 1987.
Shelley, E. G., Sharp, R. D., and Johnson, R. G.: He++and H+
flux measurements in the dayside cusp: Estimates of convection electric field, J. Geophys. Res., 81, 2363–2370, 1976.
Smith, A. M., Pryse, S. E., and Kersley, L.: Polar patches observed by ESR and their possible origin in the cusp region, Annales Geophysicae, 18, 1043–1053, 2000.
Tsyganenko, N. A.: Effects of the solar wind conditions on the global magnetospheric configuration as deduced from data-based field models, in: Proceedings of the ICS-3 Conference on sub-storms, Versailles, France, May 12–17, 1996, ESA SP-389, 181– 185, 1996.
Valladares, C. E., Basu, S., Buchau, J., and Frijs-Christensen, E.: Experimental evidence for the formation and entry of patches into the polar cap, Radio Sci., 29, 167–194, 1994.
Walker, L. K., Moen, J., Kersley, L., and Loretzen, D. A.: On the possible role of cusp/cleft precipitation in the formation of polar-cap patches, Annales Geophysicae, 17, 1298–1305, 1999.