HAL Id: hal-00317959
https://hal.archives-ouvertes.fr/hal-00317959
Submitted on 23 Mar 2006
HAL is a multi-disciplinary open access
archive for the deposit and dissemination of
sci-entific research documents, whether they are
pub-lished or not. The documents may come from
teaching and research institutions in France or
abroad, or from public or private research centers.
L’archive ouverte pluridisciplinaire HAL, est
destinée au dépôt et à la diffusion de documents
scientifiques de niveau recherche, publiés ou non,
émanant des établissements d’enseignement et de
recherche français ou étrangers, des laboratoires
publics ou privés.
Saturation and hysteresis effects in ionospheric
modification experiments observed by the CUTLASS
and EISCAT radars
D. M. Wright, J. A. Davies, T. K. Yeoman, T. R. Robinson, H. Shergill
To cite this version:
D. M. Wright, J. A. Davies, T. K. Yeoman, T. R. Robinson, H. Shergill. Saturation and
hystere-sis effects in ionospheric modification experiments observed by the CUTLASS and EISCAT radars.
Annales Geophysicae, European Geosciences Union, 2006, 24 (2), pp.543-553. �hal-00317959�
Ann. Geophys., 24, 543–553, 2006 www.ann-geophys.net/24/543/2006/ © European Geosciences Union 2006
Annales
Geophysicae
Saturation and hysteresis effects in ionospheric modification
experiments observed by the CUTLASS and EISCAT radars
D. M. Wright1, J. A. Davies2, T. K. Yeoman1, T. R. Robinson1, and H. Shergill11Department of Physics and Astronomy, University of Leicester, University Road, Leicester LE1 7RH, UK
2Space Science and Technology Department, Rutherford Appleton Laboratory, Chilton, Didcot, Oxon, OX11 0QX, UK
Received: 4 February 2005 – Revised: 25 October 2005 – Accepted: 16 January 2005 – Published: 23 March 2006
Abstract. The results of high latitude ionospheric modifi-cation experiments utilising the EISCAT heating facility at Tromsø are presented. As a result of the interaction be-tween the high power pump waves and upper hybrid waves in the ionosphere, field-aligned electron density irregulari-ties are artificially excited. Observations of these structures with the CUTLASS coherent HF radars and the EISCAT in-coherent UHF radar exhibit hysteresis effects as the heater output power is varied. These are explained in terms of the two-stage mechanism which leads to the growth of the irreg-ularities. Experiments which involve preconditioning of the ionosphere also indicate that hysteresis could be exploited to maximise the intensity of the field-aligned irregularities, es-pecially where the available heater power is limited.
In addition, the saturation of the irregularity amplitude is considered. Although, the rate of irregularity growth be-comes less rapid at high heater powers it does not seem to fully saturate, indicating that the amplification would con-tinue beyond the capabilities of the Tromsø heater – currently the most powerful of its kind. It is shown that the CUTLASS radars are sensitive to irregularities produced by very low heater powers (effective radiated powers <4 MW). This fact is discussed from the perspective of a new heating facility, SPEAR, located on Spitzbergen and capable of transmitting high frequency radio waves with an effective radiated power
∼10% of that of the Tromsø heater (28 MW).
Keywords. Ionosphere (Active experiments; Ionospheric ir-regularities) – Radio science (Ionospheric physics)
1 Introduction
Artificial ionospheric modification was first discovered in the 1930s when large broadcasting stations started transmitting high power radio signals. The effect was first noted when the modulation of Radio Luxembourg could be heard in the
Correspondence to: D. M. Wright
background of other radio signals which passed through the region of the ionosphere illuminated by its beam. The Lux-embourg effect, as it was first called, was later explained as cross-modulation between the two radio signals caused by the high-power transmission modifying the radio prop-agation characteristics of the ionosphere for the other ra-dio path (Tellegen, 1933; Bailey and Martyn, 1934). How-ever, the first purpose-built radio frequency (RF) ionospheric “heaters” were not constructed until the early 1970s. These were then employed to perform experiments in the natural plasma laboratory provided by the ionospheric medium.
The first reported ionospheric modification (heating) ex-periments, performed at Platteville, Colorado, revealed that the transmission of a high power pump wave led to the gen-eration of field-aligned electron density irregularities (FAIs; Fialer, 1974; Minkoff et al., 1974). These occur as a result of coupling between the electromagnetic heater wave and up-per hybrid waves at the upup-per hybrid resonance height. Since X-mode polarised radio waves reflect below this height, the irregularities are only generated by O-mode radiation. These structures can then act as intense targets for HF coherent scat-ter radars (Robinson et al., 1997). Detailed discussions of these heater-induced phenomena are given in the reviews by Robinson (1989) and Stubbe (1996). In the F-region, it is the anomalous self absorption of the O-mode heater wave at the upper hybrid altitude that gives rise to the enhancement in the electron temperature that gives it name to heating. Through-out the region of electron temperature enhancement the elec-tron density mainly increases due to the temperature depen-dence of the recombination, although on a longer time-scale than that exhibited by the electron temperature.
A number of theories relating to the stimulation of artifi-cial FAIs by a high power pump beam have been put forward over the years. One invokes the thermal oscillating two-stream instability (TOTSI; e.g. Dysthe et al., 1983) for the creation and rapid growth of the FAIs. More recently, Gure-vich et al. (1995) constructed a stationary theory of striation formation based on resonance instability. The TOTSI most readily explains the radar observations which are presented
544 D. M. Wright et al.: Saturation and hysteresis effects in ionospheric modification experiments at Tromsø
G(Np)
P (dB)
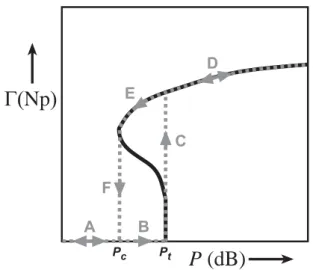
A F E D C B Figure 1 Pt PcFig. 1. A theoretical curve showing the relationship between anomalous absorption and heater power (solid curve). The dashed lines show the different paths that lead to the hysteresis effect.
in this study. In addition, a drawback of the theory of Gure-vich et al. (1995) is that it predicts abnormally high increases in electron temperature caused by the heater despite a rel-atively small electron density perturbation (Borisov et al., 2005). These large enhancements in electron temperature have not so far been detected.
Initially, the TOTSI causes a linear conversion of elec-tromagnetic pump wave energy into upper hybrid waves (Vaskov and Gurevich, 1977; Dysthe et al., 1983; Robin-son, 1988). This coupling requires the presence of plasma density gradients (pre-existing FAIs) and leads to an increase in the FAI amplitude. Once this amplitude exceeds a thresh-old value (typically after a few milliseconds) the interaction becomes nonlinear and the irregularity amplitude increases explosively. One hypothesis suggests that it is the anoma-lous absorption of the pump itself (i.e. the conversion of the electromagnetic pump wave into high frequency electrostatic waves at the upper hybrid height) as a result of the interaction with the heater-induced irregularities, that ultimately limits the growth of the FAIs (e.g. Robinson, 2002). Under these circumstances, the relationship between the pump power, P , and the level of anomalous absorption, 0s is given by
P " e−0/21− (cosh(0/2)−1) (ln a)/π P1 +0e (00−0)/4 00P2 # =1 (1)
where P1and P2, respectively, are the required power thresh-olds for the initial and explosive stages of FAI growth, 00is the level of anomalous absorption before the heater was ac-tivated and a is a factor relating to the field parallel scale length of the FAIs (see Robinson, 1989). The two terms in Eq. (1) represent the initial and explosive instabilities. Since anomalous absorption 0∝n2, where n is the FAI amplitude, then irregularity saturation as governed by Eq. (1) is shown
as the solid curve in Fig. 1 in which 0 is plotted as a function of P .
Grach et al. (1978) first postulated that a thermal para-metric instability such as the TOTSI should be expected to exhibit hysteresis effects. The existence of hysteresis was confirmed by the ionospheric modification experiments re-ported by Erukimov et al. (1978) and subsequently by Stubbe et al. (1982) and Jones et al. (1983). A hysteresis effect oc-curs in the generation of FAI because the threshold power,
Pt, (shown in Fig. 1) required for the onset of FAI growth
is higher than the critical pump power, Pc, at which the FAI
can no longer be sustained and, hence, collapse. The effec-tive threshold power is given by
Pt = P1P2 P1+P2
(2) where Pt is larger than both P1and P2. So, once the heater power P >Pt then the FAI form explosively and saturation
is rapid. This is demonstrated in Fig. 1 by the path ABCD. If the pump power is then steadily reduced, the FAI do not collapse until P <Pc, therefore following path DEFA.
This paper will mainly focus on observations of hystere-sis effects caused by ionospheric modification experiments using the EISCAT Heater at Tromsø during a campaign in 1997, and diagnosed by the CUTLASS high frequency (HF) coherent radars and the EISCAT UHF incoherent scatter radar at Tromsø. The hysteresis effects are known to be related to the generation of FAIs since they do not occur when X-mode polarised heater waves are transmitted which, as noted previously, are not associated with irregularity gen-eration. The CUTLASS data presented here represent direct measurements of the FAI amplitude and are significant for defining the irregularity power thresholds and saturation lev-els associated with backscatter received by the CUTLASS radar. They have provided a way of estimating the expected performance of the new SPEAR (Space Plasma Exploration by Active Radar; Wright et al., 2000) high power heating facility which has just been deployed at the high latitude lo-cation of Spitzbergen in the Svalbard archipelago.
2 Instrumentation
2.1 The EISCAT high power heating facility
The high power HF heating facility located near Tromsø transmits up to 1 MW of power which is radiated through one of three 6×6 phased arrays of rhombically broadened crossed dipole antennas. Different radiated frequencies, within the range 4 to 8 MHz, can be achieved by selection of arrays 2 or 3, providing an effective radiated power of 276 MW (M. Rietveld, private communication). However, all of the data presented in this paper were taken with the heater operating in O-mode at a frequency of 4.544 MHz with its beam pointing along the field line. During the exper-iments in October 1997, specially designed modes permitted
D. M. Wright et al.: Saturation and hysteresis effects in ionospheric modification experiments at Tromsø 545
20°
0°
GEOGRAPHIC60°
80°
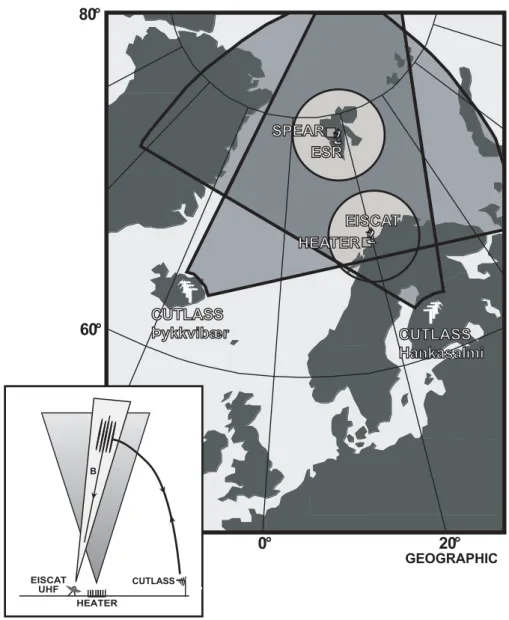
Figure 2 EISCAT EISCAT HEATER HEATER ESR ESR SPEAR SPEAR CUTLASS CUTLASS Hankasalmi Hankasalmi CUTLASS CUTLASS Þykkvibykkvibær HEATER EISCAT UHF B CUTLASSFig. 2. A map illustrating the locations of the various instruments relevant to this study. Inset: a schematic representation of field-aligned
irregularity generation by a high power heater and a half-hop radio path of an HF radar which receives backscatter from these structures.
the slow variation of the heater’s output power in order to test power thresholds, irregularity saturation and ionospheric pre-conditioning. The maximum effective radiated power (ERP) on these occasions was 155 MW (using 10 out of an available 12 transmitters) radiated with a full width at half maximum beam width of 15◦. Further technical information on the EIS-CAT high power HF heating facility can be found in Rietveld et al. (1993).
2.2 The CUTLASS radars
The global SuperDARN radar network (Greenwald et al., 1995) currently consists of 15 HF coherent radars, 9 of which operate in the Northern Hemisphere. Two of the North-ern Hemisphere SuperDARN radars comprise the CUTLASS (Co-operative UK Twin Located Auroral Sounding System)
system. CUTLASS is a frequency agile bistatic HF radar system (e.g. Milan et al., 1997) operating in the range 8– 20 MHz and consisting of stations at Pykkvibær, Iceland and Hankasalmi, Finland. Figure 2 shows the fields of view of these radars, whilst operating in their standard mode, on a ground projection along with the locations of the facilities at Tromsø and on Spitzbergen. The signals returned to the radars have undergone a Bragg-like backscattering process from FAIs in the ionosphere. There is an aspect angle de-pendence for scattering, which requires that the radio wave
k vector is close to orthogonal to the magnetic field. The
experiments described here utilise the EISCAT high power HF Heating facility at Tromsø which can generate artificial field-aligned irregularities as described earlier and thus pro-vide a region of backscatter in the CUTLASS fields of view
546 D. M. Wright et al.: Saturation and hysteresis effects in ionospheric modification experiments at Tromsø 20 25 30 35 40 45 Range gate 20 25 30 35 40 45 Range gate 25 30 35 40 45 50 Range gate 25 30 35 40 45 50 Range gate 0 4 8 12 16 20 24 28 32 36 Power (dB)
SUPERDARN PARAMETER PLOT
Hankasalmi and Þykkvibær (pwr_l) 6 Oct 1997
12:40 13:00 13:20 13:40 14:00 UT 0 20 40 60 80 100 Heater Power (%) Beam 15 12.0 to 13.0 MHz 5 Beam 19.0 to 20.0 MHz Figur e 3
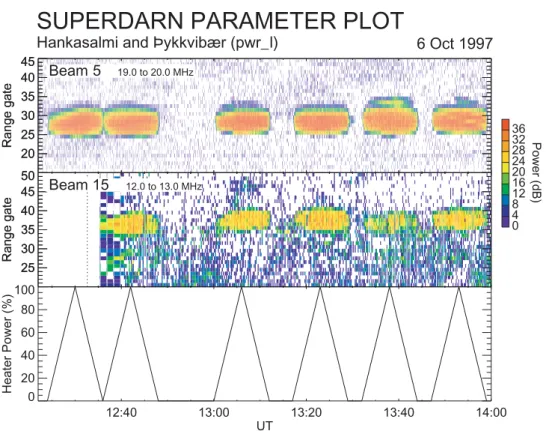
Fig. 3. Backscatter power (pwr l) measurements from the CUTLASS Hankasalmi (upper panel) and Pykkvibær (middle) radars during the
power stepping experiment utilising the Tromsø heater on 6 October 1997. The lower panel shows the output heater power as a function of time during these observations.
(e.g. Robinson et al., 1997) when backscatter may not al-ready be present. This effect is illustrated schematically as the inset in Fig. 2. The detection of artificial backscatter by HF radar then provides a powerful way of diagnosing plasma processes (e.g. Robinson et al., 1997) and observing geo-physical phenomena (e.g. Yeoman et al., 1997).
During the experiments relevant to this paper, the CUT-LASS radars employed a range resolution of 15 km, com-pared to a normal gate length of 45 km. The radars were, as a result, sounding over a reduced field of view compared with that shown in Fig. 2, centred over Tromsø during these exper-iments. The nearest range sounded on the Hankasalmi and Pykkvibær radars were, respectively, 480 km and 1470 km. Tromsø lies at approximately 900 km from the Hankasalmi radar and is twice as remote from Pykkvibær. Typically, the time resolution of the radar data presented varies from 1– 10 s. Only data from beam 5 of the Hankasalmi radar and beam 15 of Pykkvibær have been employed as these beams overlie Tromsø, the location of the EISCAT heater. The high backscatter powers that are characteristic of artificially gen-erated irregularities make it possible to integrate data over such short dwell times since the signal to noise levels are high.
2.3 The EISCAT UHF radar
The European Incoherent Scatter (EISCAT) UHF radar (e.g. Rishbeth and Williams, 1985; Rishbeth and van Eyken, 1993) is often operated in support of artificial modification experiments using the Tromsø heater (see Sect. 2.1). The SP-UK-HEAT experiments in October 1997, included UHF radar operation, with the transmit/receive antenna at Ram-fjordmoen near Tromsø, Norway, aligned approximately along the local magnetic field direction (geographic azimuth: 183.2◦, elevation: 77.2◦). Four pulse schemes were
trans-mitted; long pulse, alternating code and two power profiles; only data from the former is included here. The long pulse scheme provides observations of electron density, ion and electron temperature and line-of-sight ion velocity over 21 range gates along the Tromsø beam, from approximately 140 to 600 km altitude with a gate separation of ∼22 km in alti-tude.
3 Observations
3.1 Radar observations of hysteresis
On 6 October 1997 an experiment was undertaken where the heater output power was, for a number of cycles, increased
D. M. Wright et al.: Saturation and hysteresis effects in ionospheric modification experiments at Tromsø 547 from 0% to 100% output, using 2.5% steps and then
decreas-ing the power again to 0 % in the same fashion. Each step was maintained for 9 s so that the entire cycle took exactly 12 min to complete. The upper and middle panels of Fig. 3 show colour-coded range-time-intensity plots of backscatter power from the Hankasalmi and Pykkvibær radars, respec-tively, with observations from both HF radars revealing the artificial irregularities generated by the heater over the course of the experiment. The data shown in Fig. 3 were mea-sured at a sounding frequency in the range 19.0–20.0 MHz and a time resolution of 1–2 s for the Hankasalmi radar (top panel), whilst Pykkvibær (middle panel) transmitted in the range 12.0–13.0 MHz with a time resolution of 10 s. The lower panel shows the heater output power over the same interval. Five of the total of six full cycles were preceded by extended periods during which the heater was off to re-move the possibility of any ionospheric preconditioning (see Sect. 3.2) being caused by the heater. The Pykkvibær radar was not switched into its high time resolution mode until half way through the second cycle. The intense backscatter from Hankasalmi was centred on range gate 28 (900 km distant) and that from Pykkvibær was centred on range 37 (2025 km from the radar). The latter observations exhibit a range am-biguity from the expected ∼1800 km ground range. This is related to the fact that the range calculation algorithm is less accurate over the 1.5 hop ray path geometry required for Pykkvibær to observe scatter over Tromsø. In contrast, Han-kasalmi acquires scatter over Tromsø over a 0.5 hop path. These observations are commensurate with the findings of Yeoman et al. (2001), who employed artificial backscatter to make a range evaluation for the CUTLASS radars. The extra distance travelled by the Pykkvibær radar signal accounts for the lower backscatter power received by this radar, which are roughly 10–20 dB down on those received by the Hankasalmi radar.
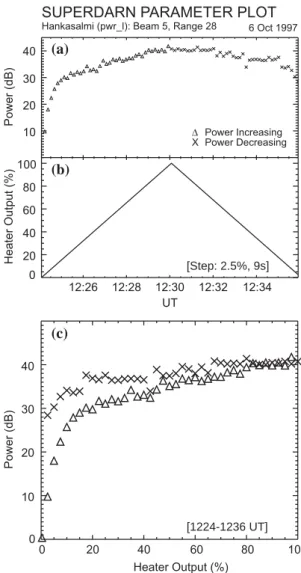
Figure 4 presents the Hankasalmi HF radar data from the first cycle only, from 12.24 to 12.36 UT. Panel (a) shows the time series data of backscatter power from range 28 of beam 5, which is in the middle of the patch of artificial scat-ter. Panel (b) illustrates the power stepping heater cycle at the same time. By plotting the radar backscatter power as a function of heater output for the increasing and decreasing parts of the power cycle (Fig. 4c) a difference in the received radar power is immediately apparent. During the power-increasing part of the heater cycle the backscatter power in-creases rapidly until the heater output reaches 20% and there-after continues to increase more steadily approaching a satu-ration level of about 40 dB. On the way back down the two-stage backscatter power fall-off is less rapid than the equiv-alent steps on the way up to maximum heater output. The result of this is that right down to the lowest power trans-mitted by the heater (2.5%, equivalent to an ERP of only 3.9 MW) the difference in backscatter power caused by the hysteresis, 1Pd−u, is ∼20 dB. Figure 5 shows the
equiva-lent plots to Fig. 4c for all six cycles in the experiment. A
Figure 4 10 20 30 40 Power (dB) Heater Output (%) 0 100 20 40 60 80 12:26 12:28 12:30 12:32 12:34 UT [Step: 2.5%, 9s] [1224-1236 UT] SUPERDARN PARAMETER PLOT
Hankasalmi (pwr_l): Beam 5, Range 28 6 Oct 1997
Power Increasing Power Decreasing D X 10 20 30 40 Heater Output (%) 0 20 0 40 60 80 100 Power (dB) (a) (b) (c)
Fig. 4. (a) The received backscatter power from range 28 of beam
5 of the Hankasalmi radar during one cycle of the power stepping experiment shown in Fig. 3. (b) The power output of the heater during this cycle. Panel (c) shows the measurements in (a) as a function of the heater output (b) with the two halves of the cycle plotted separately to indicate the level of hysteresis between the up-and down-going parts of the cycle.
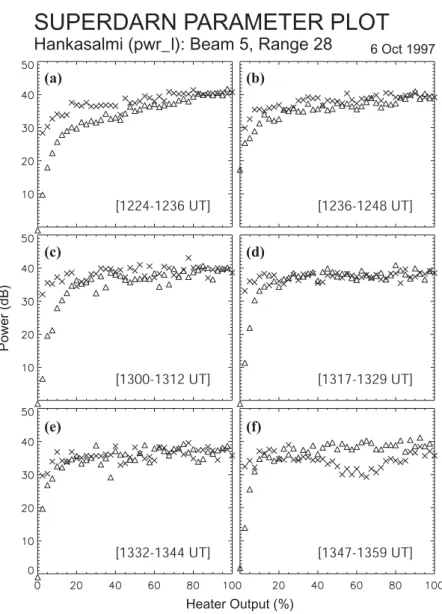
similar hysteresis signature can be seen in all panels a-f al-though there appears to be less distinction between the up-and down-going parts of the cycle at heater powers greater than 20% in panels (b–f). The smallest separation 1Pd−uat
low heater powers is observed to occur for the second cycle (Fig. 5b). However, it is likely that since there was no recov-ery time (i.e. and extended heater off interval) following the first cycle then the second cycle was affected by ionospheric preconditioning. This will be discussed later.
Simultaneous field-aligned EISCAT UHF measurements of the electron temperature (Te)and density (Ne)in the
mod-ified ionosphere are illustrated in Fig. 6 as a function of alti-tude for the UT period that covers all 6 heater cycles. Large
548 D. M. Wright et al.: Saturation and hysteresis effects in ionospheric modification experiments at Tromsø
[1224-1236 UT] [1236-1248 UT]
[1300-1312 UT] [1317-1329 UT]
[1332-1344 UT] [1347-1359 UT]
SUPERDARN PARAMETER PLOT
Hankasalmi (pwr_l): Beam 5, Range 28
Heater Output (%) Power (dB) 6 Oct 1997 Figure 5 (a) (b) (c) (d) (e) (f)
Fig. 5. As for Fig. 4c but for all six cycles (a–f) shown in Fig. 3.
enhancements of the electron temperature correspond to the intervals when the heater was operating and, moreover, the temperature can be seen to increase with the Heater power and lead to changes in the electron temperature 1Te/Te of ∼100% at maximum heater output. The interaction altitude, where the pump wave couples to upper hybrid waves, was derived from the location of “overshoot” effects observed in the ion line measurements made by the UHF radar and was found to vary from 180–200 km for this interval. There is, as has been demonstrated by Jones et al. (1986) and Robin-son (1989), a linear relationship between the electron tem-perature enhancement 1Te of the modified ionosphere and
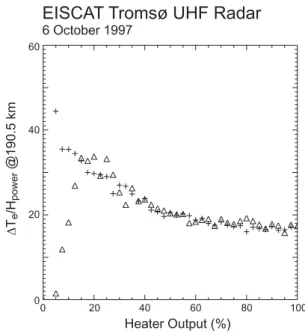
the level of anomalous absorption, 0, and hence irregular-ity amplitude. Figure 7 shows the variation of 1Te
(nor-malised with respect to the heater output power) as a func-tion of heater output for the first cycle in our interval. It should be noted that the response time for changes in Te is
of the same order as the time between steps in the Heater power cycles (Stocker et al., 1992) and as a result a slight time offset in the overall response throughout the heater cy-cle is expected to exist. However, again a hysteresis effect is clearly seen where the electron temperature corresponding to the final steps in the heater cycle is far higher than the value of the temperature during the initial heater steps. There is also some evidence to suggest that hysteresis is exhibited by the electron densities (not shown) where the maximum value of 1Ne/Ne was ∼10%. However, these relatively small
changes are masked by large changes in the ambient elec-tron density. The elecelec-tron temperatures on the up-and down-going parts of the heater cycle only differ significantly for heater powers below 30–40% where CUTLASS backscatter power and irregularity amplitude are changing the fastest.
D. M. Wright et al.: Saturation and hysteresis effects in ionospheric modification experiments at Tromsø 549 200 250 300 350 400 Altitude (km) 200 250 300 350 400 Altitude (km) 0 350 700 1050 1400 1750 2100 2450 2800 3150 Electron Temperature (K) 1240 1300 1320 1340 1400 UT 150 200 250 300 350 400 Altitude (km) 1240 1300 1320 1340 1400 UT 150 200 250 300 350 400 Altitude (km) 1.0 1.2 1.4 1.6 1.8 2.0 2.2 2.4 2.6 2.8 Electron Density (x10 11 m -3 )
EISCAT UHF Radar
6 October 1997Figur
e
6
Fig. 6. Ionospheric electron temperature (upper panel) and electron density (lower panel) measured by the EISCAT UHF radar whilst
pointing field aligned during the interval shown in Fig. 3.
3.2 Ionospheric preconditioning
Once the ionosphere has been modified it may remain in this state for some time after the heater has been turned off. This is most clearly apparent on occasions when the artifi-cial FAI take several minutes to decay. In order for unbiased heating effects to be observed it is often necessary to leave long off periods (several minutes) between intervals of heater on to give the ionosphere time to return to its unmodified state. Changing the ionospheric conditions prior to another type of experiment is known as preconditioning. A study of CUTLASS backscatter from heater-generated irregulari-ties by Bond (1997) demonstrated that the decay time of FAI (and hence the duration of this preconditioning) was depen-dent on the time of day and was observed to vary from ∼50 in the early afternoon to ∼200 s towards dusk.
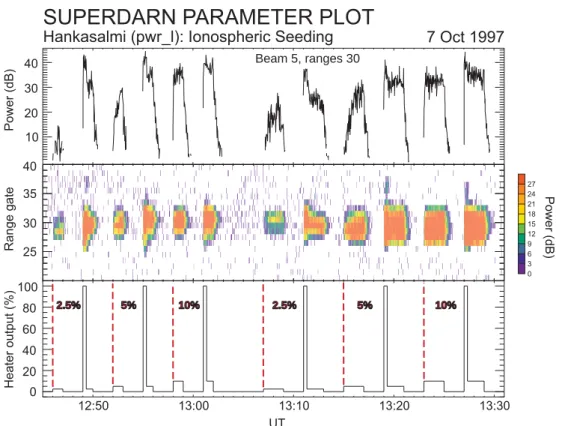
On 7 October 1997, an experiment was performed to in-vestigate the effects of irregularity saturation, by heating the ionosphere at low power levels, and preconditioning by us-ing relatively short-lived high power pulses prior to longer but low power heater cycles. The backscatter power received by the CUTLASS Hankasalmi radar during this experiment is reproduced in the middle panel of figure 8, in which a se-ries of patches of artificial backscatter can be seen. The up-per panel of the figure shows a time series of the backscatter power at range gate 30, located at the centre of the heated
∆Te /Hpower @190.5 km Heater Output (%) 0 20 40 60 80 100 0 20 40 60
EISCAT Tromsø UHF Radar
6 October 1997Figure 7
Fig. 7. The temperature change of the electrons in the modified
ionosphere normalised by and plotted as a function of the heater output power. Again the up- and down-going parts (respectively symbolised by 1 and +) of the same heater cycle as in Fig. 4 are overlaid to illustrate the hysteresis effect.
550 D. M. Wright et al.: Saturation and hysteresis effects in ionospheric modification experiments at Tromsø
SUPERDARN PARAMETER PLOT
Hankasalmi (pwr_l): Ionospheric Seeding 7 Oct 1997
Power (dB) Beam 5, ranges 30 UT 12:50 13:00 13:10 13:20 13:30 20 30 40 Power (dB) Range gate Heater output (%) 25 30 35 40 0 100 20 40 60 80 2.5% 5% 10% 2.5% 5% 10% 10 0 3 6 9 12 15 18 21 24 27 Figur e 8
Fig. 8. The results of the ionospheric seeding experiment of 7 October 1997: The middle panel shows the backscatter power received by the
Hankasalmi radar along beam 5 during heating with the Tromsø facility. Plotted in the upper panel is the backscatter power at range gate 30 along this beam. The lower panel depicts the heater output power throughout this interval.
patch. Indicated in the lower panel is the heater power. From 12:46 to 13:04 UT the underlying cycle was 1 min of heater on followed by 2 min of heater off. These cycles were ar-ranged in pairs with each transmitting the same final output power. However, for the first 20 s of the second cycle in each pair the heater transmitted at full power. This shall hereafter be termed the “seed pulse”. The final output power in each of the three pairs was, in turn, 2.5%, 5% and 10% of full power, as is evident in Fig. 8. The whole process was subse-quently repeated from 13:07 to 13:31 UT but now using an underlying 2 min on, 2 min off heater cycle (see Fig. 8). It is evident from the upper panel of Fig. 8 that the backscatter power observed by the Hankasalmi radar was considerably higher in those cycles with an initial seed pulse. Further-more, in the absence of the seed pulse a larger backscatter power was received during a 2-min heater on than for a 1-min heater on. This implies that at heater powers below 10% irregularity saturation required longer than 60 s in each case. The increase in backscatter power, 1Pseed, obtained by the
use of the seed pulse, compared to that without, is indicated in Fig. 9. The upper panel of the figure corresponds to the 1-min on–1-min off cycles and the lower panel, to the 2-min on–2-min off cycles. For each pair of cycles corresponding to each final heater power (i.e. 2.5, 5 and 10%), the average backscatter power from Hankasalmi is plotted as a cross for
the cycle containing a seed pulse and a plus sign for the cy-cle without. At low heater powers such as those employed in this experiment (0–10%) the effects of using the seed pulse (ionospheric preconditioning) are dramatic and the duration that the heater is active is also significant for the saturation of irregularities created by the heater. 1Pseedwas as large as 25 dB when using a seed pulse followed by the short duration heating interval at 2.5% output.
4 Discussion and conclusion
This paper has presented the results of ionospheric modifi-cation experiments on two consecutive days in October 1997 employing the high power heating facility at Tromsø. The CUTLASS HF coherent radars received backscatter from ir-regularities artificially generated by the heater. These irreg-ularities provide a very coherent and intense target for the radars facilitating high spatial and temporal resolution diag-nosis of the plasma physical processes that lead to their exis-tence.
These experiments provide important insight into the growth and saturation of artificially stimulated FAI. A clear hysteresis effect is observed between the up- and down-going parts of the heater cycle, the difference in radar backscatter
D. M. Wright et al.: Saturation and hysteresis effects in ionospheric modification experiments at Tromsø 551 0 10 20 30 40
Average Backscatter Power (dB)
0 2 4 6 8 10 Heater output (%) 0 10 20 30 40
SUPERDARN PARAMETER PLOT
Hankasalmi (pwr_l): Beam 5, Range 30
Time: 13:07-13:31 UT Cycle: 2 Min on/off Time: 12:46-13:04 UT Cycle: 1 Min on/off
7 Oct 1997
Figure 9
Fig. 9. The difference in average backscatter power received by
the Hankasalmi radar as a function of heater output when the iono-sphere is (x) and is not (+) pre-conditioned by a preceding high power pulse from the heater. The upper (lower) panel shows data from 1 (2)-min on, 1 (2)-min off heater cycles.
powers being most marked at low heater powers, where
1Pd−uis typically 20 dB (or 100 times) more intense on the
down-leg. This is consistent with the theoretical curve shown in Fig. 1. As expected a similar effect is also observed in the EISCAT measurements of electron temperature, which is modified by the heater interaction with the ionospheric plasma. Since the electron temperature is known to be pro-portional to the level of anomalous absorption (and hence re-lated to irregularity amplitude) then the curve in Fig. 1 should also be applicable to the EISCAT observations. The growth of the irregularities indicated by the CUTLASS measure-ments (see Fig. 4) occurs in two stages. For heater powers less than ∼20% there is a very rapid increase in backscatter power and as the heater power is increased further the irreg-ularity amplitude grows more steadily looking as though it is approaching a saturation value. However, in the observations presented here, the CUTLASS backscatter power never ap-pears to quite saturate fully and presumably would continue to rise if the heater power could be increased further. It has been hypothesised that the extinction (self absorption) of the heater itself by interaction with its own FAI would limit the amplitude of the FAI, and therefore the backscatter powers observed by the radars.
14:36 14:38 UT 0 10 20 30 40 Power (dB) 0 25 50 75 100 Heater Output (%) 5% SUPERDARN PARAMETER PLOT
Þykkvibær: pwr_l (Beam 15, Range 37) 21 Oct 1999
Figure 10
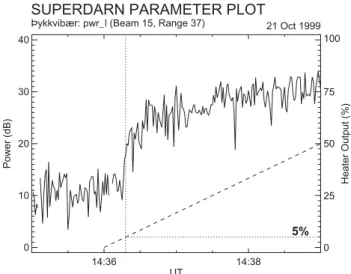
Fig. 10. Backscatter power received from the heated volume by the
Pykkvibær radar (beam 5, range 37) during the up-going part of a similar heater cycle to that shown in Fig. 4. The dashed line shows the heater output power during this interval, given by the scale on the right hand side of the plot.
The hysteresis effects observed are the result of a form of preconditioning. This is borne out by the ionospheric seed-ing experiments, the results of which are shown in Figs. 8 and 9. Again, it is consistently observed that after a short high-power pulse much higher backscatter powers can be achieved for a given heater output level. This is particularly pronounced for low heater powers where the backscatter ob-served is as much as 20 dB more intense than for simply transmitting heater radiation at low powers. This indicates that, although a power threshold, Pt, has to be exceeded for
FAI growth to occur (see Fig.1), once the irregularities exist they can be maintained with much lower heater powers, as long as this remains greater than Pc. This might be
impor-tant where available heater power is limited.
One important motivation for these experiments was to evaluate the expected performance of the new heating facil-ity, SPEAR, which is located almost 10◦ further north than Tromsø in Svalbard (78◦N geographic). Currently, the max-imum power output of SPEAR is only 10% of that of the Tromsø heater. In addition, SPEAR is located ∼2000 km from each of the CUTLASS radars (1800 km from Han-kasalmi and 2000 km from Pykkvibær). This is similar to the separation of the Pykkvibær radar from Tromsø (about twice the distance of the Hankasalmi-Tromsø path). Hence observations of Tromsø artificial scatter from Pykkvibær can provide an initial estimate of the levels of backscatter power that might be provided using SPEAR. As is evident from Fig. 3, the Pykkvibær radar certainly receives strong backscatter from artificial FAI over Tromsø, however this is some 10–20 dB weaker than that observed by the Han-kasalmi radar. This can be accounted for by the extra signal
552 D. M. Wright et al.: Saturation and hysteresis effects in ionospheric modification experiments at Tromsø loss over the longer (1.5 hop) radio path. But, how
sensi-tive is the Pykkvibær radar to irregularities generated by the Tromsø heater at lower powers? This question can be ad-dressed by examination of Fig. 10, which shows the time se-ries of backscatter power received by Pykkvibær from the centre of the heated ionospheric volume. In this case the data were recorded from 14.35 to 14.39 UT on 21 October 1999, another example of low power heating. This interval was selected since the radar data had a time resolution of 1 s which is higher than those shown in Fig. 3. The dashed sloping line overlaid on this figure indicates the power out-put of the heater, given by the scale on the right-hand side of the plot. Figure 10 demonstrates that the Pykkvibær radar detected artificial irregularities certainly for a heater output of 5% and also possibly at even lower powers. Since the Tromsø heater’s experimental configuration on this date was such that maximum ERP was 199 MW, this implies that the CUTLASS radars should be sensitive to irregularities gener-ated with heater ERPs of 10 MW or less. The current con-figuration of the SPEAR high power facility enables an ERP of ∼28 MW of RF radiation to be transmitted. A proposed future developmental phase would see this increased to about 68 MW.
Although the radar observations indicate that the irregu-larity amplitude was still not fully saturated at the maximum power of the Tromsø heater – currently the most powerful fa-cility of this type – they also show that FAI can also be gener-ated and sustained for much weaker heater powers (less than 10 MW ERP). This is therefore very promising for future ex-periments employing the SPEAR radar in its unique location on Svalbard.
Acknowledgements. The authors would like to thank the EISCAT
Scientific Association for providing the EISCAT data and M. Ri-etveld for Tromsø heater operations throughout these experiments. Also, thanks are due to the EISCAT group at the Rutherford-Appleton Laboratory for campaign assistance and for maintenance of the analysis software.
Topical Editor M. Pinnock thanks M. Kosch and another referee for their help in evaluating this paper.
References
Bailey, V. A. and Martyn, D. F.: Influence of electric waves in the ionosphere, Phil. Mag., 23, 369–386, 1934.
Bond, G. E.: The interaction of radio waves with the auroral iono-sphere, Ph. D. thesis, University of Leicester, 1997.
Borisov, N., Senior, A., and Honary, F.: Stationary state and relaxation of artificial irregularities excited in iono-spheric heating experiments, J. Plas. Phys., 71, 315, doi:10.1017/S002237780400296X, 2005.
Dysthe, K. B., Mjølhus, E., P´ecseli, H. L., and Rypdal, K.: A ther-mal oscillating two-stream instability, Phys. Fluids, 26, 146–157, 1983.
Erukimov, L. M., Metelev, S. A., Mityakov, N. A., and Frolov, V. L.: Hysteresis effect in the artificial excitation of inhomogeneities in
the ionospheric plasma, Radiophysics and Quantum Electronic (Engl. Trans. of Radiofizika), 21, 1738–1740, 1978.
Fialer, P. A.: Field-aligned scattering from a heated region of the ionosphere: observations at HF and VHF, Radio Sci., 9, 923– 940, 1974.
Grach, S. M., Karashtin, A. N., Mityakov, N. A., Rapoport, V. O., and Trakhtengerts, V. Y.: Thermal parametric instability in an inhomogeneous plasma (nonlinear theory), Sov. J. Plasma Phys. (Engl. Transl.), 4, 742–746, 1978.
Greenwald, R. A., Baker, K. B., Dudeney, J. R., Pinnock, M., Jones, T. B., Thomas, E. C., Villain, J.-P., Cerisier, J.-C., Se-nior, C., Hanuise, C., Hunsucker, R. D., Sofko, G., Koehler, J., Nielsen, E., Pellinen, R., Walker, D. M., Sato, N., and Yamag-ishi, H.: DARN/SuperDARN: a global view of the dynamics of high-latitude convection, Space Sci. Rev., 71, 761–796, 1995. Gurevich, A. V., Zybin, K. P., and Lukyanov, A. V.: Stationary
stria-tions developed in the ionospheric modification, Phys. Rev. Lett., 75, 2622–2625, 1995.
Jones, T. B., Robinson, T., Stubbe, P., and Kopka, H.: A hysteresis effect in the generation of field-aligned irregularities by a high-power radio wave, Radio Sci., 18, 835–839, 1983.
Jones, T. B., Robinson, T. R., Stubbe, P., and Kopka, H.: EISCAT observations of the heated ionosphere, J. Atmos. Terr. Phys., 48, 1027–1035, 1986.
Milan, S. E., Yeoman, T. K., Lester, M., Thomas, E. C., and Jones, T. B.: Initial backscatter occurrence statistics from the CUT-LASS HF radars, Ann. Geophys., 15, 703–718, 1997.
Minkoff, J., Kugelman, P., and Weissman, I.: Radio frequency scat-tering from a heated ionospheric volume, 1, VHF/UHF field-aligned and plasma line backscatter measurements, Radio Sci., 9, 941–955, 1974.
Rietveld, M. T., Kohl, H., Kopka, H., and Stubbe, P.: Introduction to ionospheric heating at Tromsø – I. Experimental overview, J. Atmos. Terr. Phys., 55, 577–599, 1993.
Rishbeth, H. and Williams, P. J. S.: The EISCAT ionospheric radar: the system and its early results, Q. J. R. Astr. Soc., 26, 478–512, 1985.
Rishbeth, H. and van Eyken, A. P.: EISCAT: early history and the first ten years of operation, J. Atmos. Terr. Phys., 55, 525–542, 1993.
Robinson, T. R.: The excitation of plasma waves and irregulari-ties in the ionosphere by means of high power radio waves, Plas. Phys. Contr. Fusion, 30, 45–56, 1988.
Robinson, T. R.: The heating of the high latitude ionosphere by high power radio waves, Phys. Rep., 179, 79–209, 1989.
Robinson, T. R., Stocker, A. J., Bond, G. E., Eglitis, P., Wright, D. M., and Jones, T. B.: O- and X-mode heating effects observed simultaneously with the CUTLASS and EISCAT radars and low power HF diagnostics at Tromsø, Ann. Geophys., 15, 134–136, 1997.
Robinson, T. R.: Effects of multiple scatter on the propagation and absorption of electromagnetic waves in a field-aligned-striated cold magneto-plasma: implications for ionospheric modification experiments, Ann. Geophys., 20, 41–55, 2002.
Stocker, A. J., Honary, F., Robinson, T. R., Jones, T. B., Stubbe, P., and Kopka, H.: EISCAT observations of large scale electron temperature and electron density perturbations caused by high power HF radio waves, J. Atmos. Terres. Phys., 54, 1555–1572, 1992.
D. M. Wright et al.: Saturation and hysteresis effects in ionospheric modification experiments at Tromsø 553 Stubbe, P., Kopka, H., Lauche, H., Rietveld, M. T., Brekke, A.,
Holt, O., Jones, T. B., Robinson, T., Hedberg, A., Thide, B., Cro-chet, M., and Lotz, H. J.: Ionospheric modification experiments in northern Scandinavia, J. Atmos. Terr. Phys., 44, 1025–1041, 1982.
Stubbe, P.: Review of ionospheric modification experiments at Tromsø, J. Atmos. Terr. Phys., 58, 349–367, 1996.
Tellegen, B. D. H.: Interaction between radio waves?, Nature, 131, 840–843, 1933.
Vaskov, V. V. and Gurevich, A. V.: Resonance instability of small-scale plasma perturbations, Sov. Phys. – JETP, 46, 487–491, 1977.
Wright, D. M., Davies, J. A., Robinson, T. R., Chapman, P. J., Yeo-man, T. K., Thomas, E. C., Lester, M., Cowley, S. W. H., Stocker, A. J., Horne, R. B., and Honary, F.: Space Plasma Exploration by Active Radar (SPEAR): an overview of a future radar facility, Ann. Geophys., 18, 1248–1255, 2000.
Yeoman, T. K., Wright, D. M., Robinson, T. R., Davies, J. A., and Rietveld, M. T.: High spatial and temporal resolution observa-tions of an impulse-driven field line resonance in radar backscat-ter artificially generated with the Tromsø heabackscat-ter, Ann. Geophys., 15, 634–644, 1997.
Yeoman, T. K., Wright, D. M., Stocker, A. J., and Jones, T. B.: An evaluation of range accuracy in the SuperDARN over-the-horizon radar systems, Radio Sci., 36, 801–813, 2001.