C
OMPACT LASER SOURCES FROM THE
EXTREME ULTRAVIOLET TO THE MID
-INFRARED SPECTRAL RANGE
Thesis presented to the Faculty of Science for the degree of
Doctor of Science
Loïc P. J. M. Merceron
M. Sc. In Physics
submitted on 23.04.2019 to the jury:
Prof. Thomas Südmeyer
Director
Prof. Bojan Resan
Examiner
Dr. Stéphane Schilt
Examiner
Dr. Valentin J. Wittwer
Examiner
Tél : + 41 (0)32 718 21 00 E-mail : secretariat.sciences@unine.ch
IMPRIMATUR POUR THESE DE DOCTORAT
La Faculté des sciences de l'Université de Neuchâtel autorise l'impression de la présente thèse soutenue par
Monsieur Loïc P.J.M. MERCERON
Titre:
“Compact laser sources from the extreme
ultraviolet to the mid-infrared
spectral range”
sur le rapport des membres du jury composé comme suit:
• Prof. Thomas Südmeyer, directeur de thèse, Université de Neuchâtel, Suisse
• Dr Stéphane Schilt, Université de Neuchâtel, Suisse
• Dr Valentin Wittwer, Université de Neuchâtel, Suisse
• Prof. Bojan Resan, Fachhochschule Nordwestschweiz, Windisch, Suisse
Keywords – Mots-clés
Keywords
Thin-disk laser (TDL), difference frequency generation (DFG), high-harmonic generation (HHG), modelocked laser, ultrafast laser, high-power laser, diode-pumped solid-state laser (DPSSL), femtosecond, optical frequency comb, optical fiber amplifier, frequency noise, phase noise, near infrared (near-IR), mid-infrared (mid-IR), extreme ultra-violet (XUV).
Mots-clés
Laser à disque fin (TDL), génération de différence de fréquence (DFG), génération d’harmoniques d’ordre élevé (HHG), laser à verrouillage de mode, laser ultra-rapide, laser à haute puissance, laser à corps solide pompé par diode (DPSSL), femto-seconde, peigne de fréquence optique, amplificateur optique à fibre, bruit de fréquence, bruit de phase, proche infrarouge, infrarouge moyen, extrême ultraviolet (EUV).
Abstract
Lasers have revolutionized the way we live and work in so many ways and have become a major part of our lives. We use them in telecommunications, medical care, material processing, data storage and printing, just to name a few. Lasers have proved to be important tools and are a major subject of research in science, continuously developed further and finding new uses. Pushed by the need to characterize absorption lines of molecules in gas phase, laser radiation in the mid-infrared (mid-IR) have become very desirable. On the other hand, the intense electric fields created by lasers revealed new aspects of nature’s behavior and extreme non-linear processes like high-harmonic generation (HHG) could be demonstrated. They gave us access to new sources of coherent radiation in the extreme ultra-violet. This thesis presents the development of compact laser sources in the mid-infrared by difference frequency generation (DFG) inside an enhancement cavity driven by high power fiber amplifiers on one side, and in the extreme ultraviolet (XUV) by high harmonic generation inside a modelocked thin-disk laser oscillator on the other side.
In the first part of this work, the implementation of a narrow linewidth and high-power 3-µm source based on DFG between 1-µm and 1.5-µm radiations inside an enhancement cavity supplied by two high-power fiber amplifiers is presented. Up to 120 mW of 3-µm radiation is measured, corresponding to a conversion efficiency of 1.4 mW·W-2·cm-1 for
the overall system and 98.5 µW·W-2·cm-1 for the intracavity conversion
efficiency (equivalent to single-pass). The 3-µm frequency noise is estimated by measuring the noise of the semiconductor laser diodes that seed the system as well as the additive noise from the rest of the setup. This latter noise characterization is achieved by analyzing the beat note between the high-power continuous-wave cavity-enhanced DFG radiation and a single-pass DFG source seeded by two fiber amplifiers operating at the same wavelength. As the two systems are seeded by the same laser diodes, the additive frequency noise of the fiber amplifiers, the crystals and the cavity is characterized. It is shown that only the frequency noise of the laser diodes
effort on MHz systems. High repetition rates can strongly reduce measurement time, improve signal-to-noise ratio, and enable XUV frequency comb metrology. However, current MHz HHG sources have a high degree of complexity. In the last part of this thesis, a compact XUV source that generates high harmonics directly inside the cavity of a modelocked thin-disk laser (TDL) oscillator is presented. The laser is directly diode-pumped at a power of only 51 W and operates at a wavelength of 1034 nm and 17.4 MHz repetition rate. HHG is driven in a high-pressure xenon gas jet with an intracavity peak intensity of 2.8×10¹³ W/cm2 and 320 W of intracavity average power. Despite the
high-pressure gas jet, the laser operates at high stability. Harmonics up to the 17th
order (60.8 nm, 20.4 eV) are observed and a flux of 2.6×10⁸ photons/s for
the 11th harmonic (94 nm, 13.2 eV) is estimated. Due to the power-scalability
of the thin disk concept, it is highly expected that this new class of compact XUV sources will become a versatile tool for areas such as structural analysis of matter, attosecond science, XUV spectroscopy, and high-resolution imaging.
Résumé
Les lasers ont révolutionné notre manière de vivre et de travailler à bien des égards, à tel point qu’ils sont devenus un élément essentiel de nos vies. Nous les utilisons dans les domaines des télécommunications, des soins médicaux, du traitement des matériaux, du stockage de données ainsi que dans l’imprimerie, pour ne pas tous les nommer. Depuis leur invention, les lasers n’ont cessé d’être développés et leur utilisation s’étend continument vers de nouveaux domaines. Ils sont devenus des outils essentiels et représentent un sujet majeur de recherche scientifique. Poussé par la nécessité de caractériser les raies d’absorption de molécules en phase gazeuse, les lasers émettant dans la gamme de l’infrarouge sont devenus très désirables. D’autre part, les champs électriques intenses créés par rayonnement laser ont révélé de nouveaux aspects des lois naturelles comme les processus extrêmement non linéaires de conversion de photon telle la génération d’harmonique d’ordre élevée. Ce phénomène nous a donné accès à de nouvelles sources cohérentes de radiations pouvant s’étendre jusqu’à l’extrême ultraviolet. Cette thèse présente, d’une part, le développement de sources lasers compactes émettant dans l’infrarouge moyen par différence de fréquence dans une cavité résonante, et d’autre part dans l’extrême ultraviolet par génération d’harmoniques d’ordre élevé dans un oscillateur laser à disque fin à verrouillage de modes.
La première partie de ce mémoire présente l’implémentation d’une source à 3 µm basée sur la différence de fréquence entre des rayonnements à 1064 nm et 1560 nm à l’intérieur d’une cavité Fabry-Pérot alimentée par deux amplificateurs à fibres de haute-puissance. Jusqu’à 120 mW de puissance à 3 µm ont été mesurés, correspondant à une efficacité de conversion de 1.4 mW·W-2·cm-1 pour l’ensemble du système et à
98.5 µW·W-2·cm-1 pour l’efficacité de conversion intra-cavité. Le bruit de
fréquence du rayonnement généré à 3 µm est estimé en mesurant le bruit provenant des diodes sources à semi-conducteurs (à 1 µm et 1.5 µm) ainsi que le bruit additif provenant du reste du montage expérimental. Cette dernière caractérisation de bruit est faite en mesurant le battement entre le
seul le bruit provenant des lasers sources contribue effectivement à la largeur de raie du rayonnement à 3 µm, évaluée dans ce cas à 1.1 MHz.
Les sources de lumière cohérentes dans l’extrême ultraviolet (EUV) ouvrent de nombreuses voies et opportunités pour la science et la technologie. La génération d’harmoniques d’ordre élevé dans les gaz par des sources lasers femto-secondes est la méthode la plus courante pour obtenir une source de rayonnement EUV compacte (à la différence de grandes installations telles les synchrotrons). Alors qu’initialement la génération d’harmoniques était limitée à de faibles taux de répétition, les dernières années ont été témoin d’un grand effort de la part de nombreux groupes de recherche pour développer des systèmes opérant dans les MHz. En effet, de hauts taux de répétition réduisent fortement les temps de mesures, améliorent grandement le rapport signal-à-bruit et rendent possible la génération de peignes de fréquence allant jusque dans l’EUV. Néanmoins, les sources actuelles d’harmoniques au MHz possèdent un haut degré de complexité. La deuxième partie de cette thèse traite d’une source compacte de rayonnement EUV générant de hautes harmoniques directement à l’intérieur de la cavité d’un oscillateur laser à disque fin à modes verrouillés. Le laser est directement pompé par diode à une puissance de 51 W et opère à une longueur d’onde de 1034 nm avec un taux de répétition de 17.4 MHz. Les hautes harmoniques sont générées dans un jet de Xénon à haute pression avec une intensité pic intra-cavité de 2.8×10¹³ W/cm2 et 320 W de puissance moyenne intra-cavité. Malgré le jet
de gaz à haute pression, le laser fonctionne avec une grande stabilité. Des harmoniques jusqu’au 17ème ordre (60.8 nm, 20.4 eV) ont été observées avec
un flux de photon estimé à 2.6×10⁸ photons/s pour la 11ème harmonique
(94 nm, 13.2 eV). Grâce à la puissance évolutive du concept des lasers à disques fins, cette nouvelle classe de source EUV est en passe de devenir un outil versatile dans de nombreux domaines, tels que l’analyse structurelle de matière, l’attoscience, la spectroscopie EUV et l’imagerie de haute résolution.
Contents
Keywords – Mots-clés ... i Abstract ... iii Résumé ... v Contents ... vi Introduction ... 1Continuous-wave difference frequency generation inside an enhancement cavity ... 7
Introduction ... 7
Overview of mid-IR sources ... 8
2.1 High power fiber amplifiers ... 11
2.1.1 Basics of fiber amplifiers ... 11
2.1.2 Design and experiment ... 16
2.2 Difference frequency generation in a PPLN ... 28
2.2.1 Theoretical background ... 28
2.2.2 Single-pass difference frequency generation experiment ... 33
2.3 Difference frequency generation inside an enhancement cavity ... 42
2.3.1 Enhancement of the 1.5-µm signal in a resonant cavity ... 42
2.3.2 3-µm DFG inside a resonant cavity ... 48
2.4 Noise characterization of the intracavity DFG source ... 55
2.4.1 Choice of linewidth determination method ... 55
2.4.2 Setup of the second source of 3-µm ... 57
2.4.3 Noise analysis ... 61
High harmonic generation in an ultrafast thin-disk laser oscillator ... 68
Introduction ... 68
3.1 Modelocked thin-disk lasers ... 71
3.2 Thin-disk modelocking for intracavity HHG ... 82
3.2.1 CALGO-based thin-disk laser ... 82
3.2.2 LuO thin-disk modelocked oscillator in air ... 87
3.2.3 LuO thin-disk modelocked oscillator in vacuum ... 93
3.3 High harmonics generation ... 98
Conclusion ... 103
Conclusion and outlook ... 106
Bibliography ... 108
Curriculum vitae ... 115
Introduction
Since their invention by Theodore Maiman at Hughes Research Laboratories in 1960 [1], LASERs (light amplification by stimulated emission of radiation) have found numerous applications not only in our daily life but also in industry and in science, seeding greatly their popularity and the research effort for their development. Far from the previsions of the newspapers at the time of its invention, speaking of “killing rays”, the laser has been one of the main actors of the technological revolution of the late century and has invaded our lives through many devices such as smartphones, computers, flat screens, optical mouse, printers or DVD and Blu-rays for data writing, storage and processing. The latest advances in telecommunications also greatly rely on the laser technology with optical fibers, allowing terabits of data transfer all around the world, changing profoundly communication habits of the society.
Laser welding, cutting and polishing processes opened a large panel of possibilities for the industry. Metal processing industries can benefit from extreme high accuracy and precision by processing pieces down to the micrometer level using laser radiation. Injection nozzles for the automobile industry, turbine blades for the aviation industry or medical implants like stents can be produced at high accuracy thanks to laser micro-machining. Lasers find also an increasing number of applications in medicine where
creation of strong electric fields enabling the study of nature’s laws under new conditions. On the other hand, the high specificity of the absorption of light in a propagation medium makes lasers a versatile and powerful tool for chemical species detection, but also for pumping atoms and probing their transitions. Some of the fundamental scientific questions were answered with the help of lasers, as proven by the recent Nobel Prize for Gravitational waves detection [2] inside the Laser Interferometer Gravitational-Waves Observatory (LIGO), which constitutes basically a large-scale laser interferometer measurement setup.
Lasers are thus considered as a polyvalent tool which has revolutionized modern technology. Laser physics is still a hot and exciting research topic in which any advance has a possible repercussion for a large panel of applications.
Lasers can operate in two temporal regimes: the continuous-wave (cw) operation, where the laser intensity is constant in time and the pulsed operation, where the temporal intensity is shaped as a train of pulses with a duration ranging from microseconds down to a few femtoseconds.
In the cw regime, the electric field amplitude as well as the intensity are constant over time. In the case of single-frequency lasers, only one line is emitted in the frequency domain. This frequency can be tuned, e.g. by changing the operating temperature for semiconductor lasers. With their tunable frequency, cw lasers are highly important for precision spectroscopy. For many applications, a high spectral purity, or in other terms a very small width of their spectral line, is essential.
The laser linewidth originates from both quantum noise arising from inherent spontaneous emission and additional technical noise resulting from e.g. vibrations of mechanical components or a noisy power supply. The laser linewidth is usually characterized by its full width at half maximum (FWHM) and for most cases cannot be directly measured on an optical spectrometer. To measure it, one commonly used technic consists in detecting a heterodyne beat between the laser under study and a reference laser with significantly lower frequency noise. The characterization of the beat frequency noise directly leads to the frequency noise of the laser under study and, from it, its linewidth can be estimated. In [3] Di Domenico et al. propose a simple approximation allowing to estimate the laser linewidth from the its frequency noise power spectral density (FN-PSD).
Figure 1.1: Illustration of the 𝛽-separation line approximation. A typical FN-PSD composed of 1/f noise at low Fourier frequencies and of white noise at high Fourier frequencies. The red dashed-line separates the spectrum into two regions whose contributions to the laser line shape is very different: the light blue area contributes to the linewidth, whereas the white area contributes only to the wings of the line shape. Figure taken from [3].
As depicted in Figure 1.1, the approximation of the 𝛽-separation line consists in dividing the frequency noise PSD into two regions delimited by the so-called 𝛽-separation line, which contribute differently to the shape of the laser spectrum: the region where the frequency noise is lower than the 𝛽-separation line does not contribute to the FWHM linewidth, while the region where the frequency noise exceeds the 𝛽-separation line does contribute to the laser linewidth. The FWHM linewidth can be approximated from the surface A below the FN-PSD for Fourier frequencies for which the noise is higher than the 𝛽-separation line (in light blue in Figure 1.1:
𝐹𝑊𝐻𝑀 = √8 ln 2 𝐴.
However, one has to keep in mind that in terms of noise characterization, the linewidth only gives access to a limited information concerning the laser frequency noise. One important research direction is
term refers to the phase locking of the resonant modes of the laser cavity. This method has the striking advantage to generate stable ultrashort pulses with pulse durations that can reach the femtosecond range [4]. This confinement of the optical energy in the time domain allows generating high peak power levels. When tightly focused in space, fs-pulses with sufficient energy achieve high intensities that allow reaching electric field strengths comparable to the bonding field of electrons with nuclei. Ultrafast modelocked lasers, thus, enable the study of the interaction of matter with strong electric fields. This enables important scientific tools such as high harmonic generation (HHG).
HHG typically occurs when an ultra-short laser pulse is focused inside a gas, reaching an intensity in the order of 1014 W/cm2. The gas reacts to the
incoming laser by emitting a coherent radiation consisting in odd harmonics of the laser frequency. Starting from a modelocked laser in the near-infrared (near-IR) region (typically a Ti:sapphire modelocked laser with a central wavelength of 780 nm) the harmonic spectrum extends to the vacuum ultraviolet (VUV) or even the extreme ultraviolet region (XUV). The emitted radiation is coherent, has a limited divergence angle (usually between 2 mrad to 12 mrad) and a defined polarization state. Figure 1.2 depicts a typical spectrum produced by HHG in a gas, where three regions can be identified. The intensity of the first harmonics is quickly decreasing in the perturbative regime, harmonics have a constant intensity in the plateau regime until the cut-off regime is met, where the intensity of the higher order harmonics decreases dramatically.
Figure 1.2: Illustration of the typical structure of the HHG spectrum generated in a gas. Only odd harmonics are generated, which are separated by two times the fundamental frequency of the laser (𝜔/). .
The HHG process can be understood simply from a basic semi-classical model: the three-step model (see Figure 1.3) [5,6].
Perturbative regime
Plateau
Frequency
Intensity
Figure 1.3: The three-step model of HHG (picture from [7]).
Starting from an electron in the fundamental state, where it is trapped in the Coulomb potential, the intense electric field of the laser pulse lowers the potential down enough to allow the electron crossing it by the tunnel effect. The electron is then accelerated in the laser electric field and, once the sign of the electric field is inverted, it comes back to its parent ion. During recombination, the atom releases the acquired kinetic energy in the form of an emitted XUV photon.
From this model, a few interesting remarks can be made: the strength of the electric field needed to lower the Coulomb potential depends on the ionization potential 𝐼1 which depends on the chemical species used as
generation medium. Xenon has one of the lowest ionization potentials among gases and can thus produce HHG more easily.
XUV light produced by HHG finds numerous applications, in particular in spectroscopy. Indeed, it is possible to extract structural and dynamical information of the emitting medium directly from the properties of the harmonic radiations. By decoding the XUV spectrum emitted by HHG, the molecular orbital of nitrogen was imaged for the first time in [8]. The rearrangement dynamics of electrons during ionization was also studied through the phase of the HHG radiation [9]. The polarization state of the HHG radiation also contains important information concerning molecular alignment and structure [10]. Thus, many advances as well as fundamental questions were answered using HHG-based XUV light. However, due to the need for high intensities, initial HHG sources only operated at low repetition rates in the kHz regime. In order to reduce the
Electron in
The work carried out in this thesis addresses two main research areas: narrow linewidth mid-IR laser sources for spectroscopy and the development of ultrafast solid-state lasers for HHG at MHz repetition rates.
The content of this thesis is organized as follows:
Chapter 2 describes the different steps toward the implementation of a narrow linewidth and high-power 3-µm source based on difference frequency generation inside an enhancement cavity driven by two cw lasers amplified in high-power fiber amplifiers. The frequency noise of the generated 3-µm radiation is estimated by measuring the noise of the semiconductor laser diodes that seed the system as well as the additive noise of the remaining part of the setup.
Chapter 3 presents the first realization of HHG inside a modelocked thin-disk laser. Different gain materials and cavities have been tested for high intracavity peak powers inside modelocked thin-disk oscillators. The laser cavity is placed inside a vacuum chamber and, with the creation of a tight focus extension of the cavity, the optical intensity is high enough to generate high harmonics.
Chapter 4 concludes the thesis and provides an outlook on future improvements, developments and applications of the presented experiments.
Continuous-wave difference
frequency generation inside an
enhancement cavity
Introduction
The mid-infrared (mid-IR) spectrum (wavelengths from 3 µm to 20 µm) is commonly called “the molecular fingerprint” region as numerous molecules have their strong fundamental ro-vibrational transitions in this spectral range. A large variety of applications of mid-IR sources are dedicated to spectroscopy in fields like environmental monitoring of atmospheric gases and pollutants, industrial process control (e.g., in the semiconductor industry) [11,12] or medical diagnosis with exhaled breath monitoring [13–16]. Mid-IR sources also find applications in the security and military fields with explosives detection or optical countermeasures [17] or for the ablation of polymers [18–20] in industry.
resonant cavity for the 1.5-µm light. While this experiment was limited by the coating losses of the crystal and the thermal effects in the crystal, the concept of combining an enhancement cavity with a bulk periodically-poled lithium niobate (PPLN) crystal should allow for output power in the 1 - 10 W regime. This approach is in principle comparable to a cw-seeded optical parametric oscillator (OPO), however it is not required that the generated 1.5-µm power is higher than the introduced losses. Compared to OPO, no significant increase in the linewidth is expected. Compared to direct single-pass DFG in PPLN waveguides, this approach should enable higher output power levels.
The excess frequency noise introduced by the different parts of the experimental setup, i.e., by the fiber amplifiers, the 1.5-µm resonant cavity, etc. is studied in detail. The overall excess frequency noise of the generated 3-µm DFG radiation was assessed by building a second DFG source seeded by the same laser diodes, but operated in a single-pass configuration and with the use of independent fiber amplifiers, and by implementing a beat note between the two DFG radiations.
This chapter presents the different parts and steps towards the implementation and characterization of the 3-µm DFG-based source. In Section 2.1, the high-power fiber amplifiers are presented and studied. They deliver enough power to seed the DFG setup. Section 2.2 focuses on the DFG process inside a non-linear crystal and a single-pass DFG experiment is presented. Section 2.3 deals with the enhancement cavity built around the non-linear crystal, resonating at 1.5 µm, and with the performance of the setup generating powerful 3-µm radiation. In Section 2.4, the additive frequency noise of the setup is evaluated with the use of a second DFG-based mid-IR source allowing an estimation of the noise properties of the generated 3-µm light.
Overview of mid-IR sources
The large range of previously mentioned applications sets a large panel of requirements for the considered mid-IR sources. Depending on the application, the laser sources need to be narrow linewidth, continuously tunable, powerful enough, compact, robust, and preferably to operate at room temperature. In this section, continuous-wave mid-IR sources are reviewed.
Many mid-IR laser sources have been developed to address most of those requirements. But each technology displays advantages and drawbacks. For example, color center lasers operate between 2 and 3.5 µm
with watt power levels and MHz linewidth in continuous-wave operation [21]. But cryogenic cooling is required for stable operation, which strongly limits the robustness and the compactness of those lasers. CO and CO2 lasers emit in the range of 5 - 6 µm and 9 - 11 µm, respectively, with
high output powers (several watts). However, their tunability is intrinsically limited by the discrete gas emission lines, which can be partially overcome with high gas pressure operation. Those lasers are still commonly used for gas sensing applications, especially in industry (diagnosis of gases in semiconductor industry [22]), but within the range of the limited tunability. Semiconductor lasers like quantum cascade lasers (QCLs) [23,24] or interband cascade lasers (ICLs) [25] can emit power levels of a few hundreds of mW up to watts. The main advantage of such devices is that they can be designed to emit in a range of 3 - 25 µm and 2 - 6 µm, respectively, in continuous-wave operation, needing, nevertheless, an additional external cavity or DFB grating to operate in longitudinal single mode. Those lasers are compact, robust and the years of development made them work now at room temperature. QCLs are now a reference device for sensing applications [26].
Taking advantage of the development of lasers in the near-infrared region, mid-IR sources based on frequency conversion processes can fulfil most of the previously cited requirements. The most common frequency conversion processes used for mid-IR sources for high-resolution spectroscopy are based on OPO and DFG. Both processes are based on frequency conversion inside a nonlinear crystal using the exact same energy level scheme. Hence, their tunability is fundamentally the same. OPOs demonstrated several tens of watts of output power and a large tunability (typically from 2.4 µm to 4.3 µm for the idler wavelength) [27–31]. Sub-kilohertz linewidth of an OPO was achieved through pump frequency stabilization over the comparison of the idler signal with a narrow absorption line from a gas cell [32,33]. If OPOs display a quite large number of advantages, they can show a high degree of complexity due to the required active cavity stabilization. DFG, on the other hand, can work with a single pass scheme that reduces the complexity of the experimental setup. DFG works within a large range of wavelength (2 µm – 15 µm), with the capability of continuous tuning. Narrow linewidth sources are commonly used for high precision spectroscopy. However, the poor efficiency of cw
Compared to visible or near-infrared (NIR) lasers, mid-IR sources are generally less advanced in terms of low-noise and narrow linewidth operation, even though a QCL with Hz-level linewidth has been demonstrated by phase-locking to an ultra-stable NIR laser using a sum-frequency generation process with a femtosecond sum-frequency comb [26]. Consequently, characterization tools and instrumentation to assess the laser frequency noise and linewidth properties are also less developed in the IR. A commonly used method to measure the frequency noise of mid-IR laser sources and to retrieve their corresponding full-width at half maximum (FWHM) linewidth involves an optical frequency discriminator that converts the frequency fluctuations of the laser into intensity fluctuations that are measured by a photodiode. The discriminators can be a narrow molecular transition [35] or a resonance of a Fabry-Perot cavity [36]. These methods circumvent the need for a lower noise and more stable reference laser for comparison by heterodyne beating that is frequently used in the NIR, where such sources are more common.
2.1 High power fiber amplifiers
2.1.1 Basics of fiber amplifiers
Difference frequency generation in bulk crystals is a low-efficiency nonlinear process with a typical conversion efficiency of several hundreds of µW·W-2·cm-1 in continuous-wave operation (𝜂 = 528.9 µW·W-2·cm-1
reported in [34] as one of the highest single-pass efficiencies). For most applications, a few mW of 3-µm power level is highly desirable, which implies a few watts of power from both 1560 nm (signal) and 1030 nm (pump) sources. At each wavelength, erbium- or ytterbium-doped fiber-based amplifiers can provide a few watts of output power from milliwatt-level seed sources. Erbium- and ytterbium-doped fiber amplifiers are commonly used already for a few decades [37], they display typical advantages from a proven technology such as a relative low-cost and the accessibility of their components. Moreover, connectorized amplifiers feature the possibility to easily exchange the seed source which proves, in practice, to be very convenient.
2.1.1.1 Erbium-doped fiber amplifiers
Optical telecommunications have pushed the development of fiber technologies. For pure silica single-mode fibers, the lowest attenuation is located at 1.55 µm, which led to the early development of material and sources in this wavelength range. Since its ions display an atomic transition at 1.55 µm, erbium is a dopant of first interest for the emission and amplification of telecom signals. Erbium-doped fibers have benefited from decades of development, resulting in erbium-doped fiber amplifiers being the most commonly used type of optical amplifier.
The erbium ion Er3+ displays convenient energetic transitions for
stimulated emission at 1.55 µm (see Figure 2.1) with possible pumping wavelengths of 980 nm and 1480 nm. Thanks to the availability of efficient and reliable pump diodes, the pumping transition at 980 nm is more often used.
Figure 2.1: Energy levels of the erbium ion in silicate glass.
The erbium ions are placed into a glass host (phosphate glass can be used for a better transmission level) and manufactured as an active doped fiber. When placed in an amorphous silica host, Er3+ displays a large gain
bandwidth (see Figure 2.2). The typical doping concentration is about 14.6∙1024 ions/m3 for erbium-doped fibers which constitute the gain
medium in fiber lasers as well as in fiber amplifiers. In this work, erbium-doped fiber amplifiers (EDFAs) are pumped with 980-nm semiconductor laser diodes. In single-cladding fiber geometry, the pump is single-mode (transverse), and co-propagates with the 1550-nm signal through the fiber core for an efficient absorption in the gain medium.
Figure 2.2: Gain spectrum of erbium (Er3+) ions in phosphate glass for
excitation levels ranging from 0 to 100% in steps of 20%, from RP Photonic website [38]. 4I 15/2 4I 13/2 4I 11/2 4I 9/2 4F 9/2 4S 3/2 2P 3/2 1.45 µm 1.55 µm 2.9 µm 0.55 µm 980 nm
In the classical scheme, depicted in Figure 2.3, an EDFA (single-clad polarization-maintaining (PM) fiber) is composed of the following elements: the signal (also called the seed, 𝜆 = 1550 nm) is sent through a passive fiber, passes by a fiber-coupled optical isolator and a combiner before being amplified into the erbium-doped single-clad fiber. The amplifier ends with another fiber-coupled isolator, as well as a pump coupler (not used in this work). The role of the isolators is to prevent any backward propagating light to get out of the amplifier towards the seed laser (input isolator) and to prevent any back reflections, from after the amplifier, to reach the doped fiber (output isolator). Indeed, optical fiber amplifiers are sensitive to back-reflections. In the case of small back reflections reaching the end of the doped fiber, the backward small signal would be amplified, depleting the gain and then perturbing the amplification of the original signal. If the seed diode is not protected by an isolator, this backward amplified signal can severely damage the diode. The combiner, a wavelength-division multiplexer (WDM), mixes the pump and the signal into one fiber, to which the erbium-doped fiber is spliced. A large number of doped fibers with various doping concentrations, core diameters, etc. are available from different manufacturers and a suitable one is chosen according to the needs of the experiment (e.g., transverse single-mode propagation at signal wavelength, PM fiber and signal mode-field diameters matching between the different elements of the EDFA).
Figure 2.3: Typical setup of an EDFA. ISO: isolator.
2.1.1.2 Ytterbium-doped fiber amplifier
The difference between EDFAs and ytterbium-doped fiber amplifiers
pump diode
ISO ISO
1550 nm
seed amplified signal1550 nm
dichroic pump coupler
Er3+
bandwidth, ytterbium-doped gain media have a long track of use in free-space lasers and in fibers lasers and amplifiers [39], thus benefiting from a long and proven technology development. High quality crystals are now commercially available as well as high quality doped fibers.
Figure 2.4: Energy levels of ytterbium ions in YAG host.
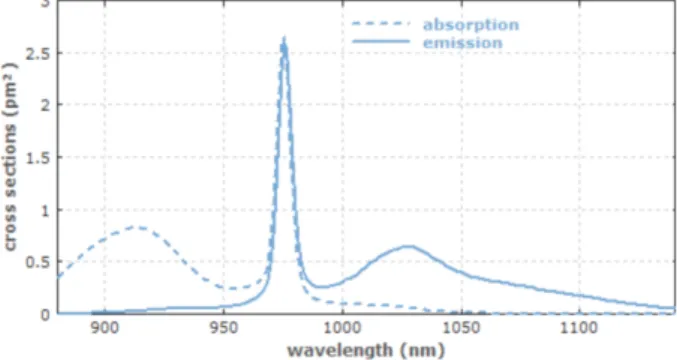
Because of its quasi three-level behavior (see Figure 2.4), the ytterbium-doped gain medium requires high pump intensity for population inversion. Pumping can be achieved at 910 nm (see Figure 2.5) as well as at 975 nm. The zero-phonon line (at 975 nm) requires narrow linewidth pumping and the reachable excitation level is mitigated by the stimulated emission. The maximum of the emission cross section is located at 1030 nm, but laser emission can occur up to 1080 nm. Therefore, switching from 1030 nm to 1064 nm seed source has small effect on the YDFA performance.
Figure 2.5: Absorption and emission spectra of ytterbium-doped germanosilicate glass (typically composing ytterbium doped-fiber core). Figure from RP photonic website [40].
The classical scheme of YDFAs is, in all point, the same as for EDFAs, except for the doped fiber.
2F 7/2 2F 5/2 1030 nm 1050 nm 975 nm
2.1.1.3 High power fiber amplifiers
The amplifiers described before are restricted to single-clad geometry and are thus limited in terms of achievable pump level. Indeed, with the pump traveling into the fiber core, a transverse single-mode pump is required for a good overlap with the seed signal. The pump can reach high intensities in the fiber core and is thus limited by the fiber damage threshold. In addition, high-power single-mode pump diodes are challenging to produce and thus expensive in comparison with multimode pump diodes. To overcome those limitations, a fiber with an additional cladding in which the pump is traveling is used. The cladding usually supports higher-order mode propagation while the core remains a single-mode fiber. The outer cladding is often made of polymers (cheaper than glass and less sensitive to shocks). If double-clad (DC) fibers allow high pump power levels thanks to a larger area for mode propagation, the overlap with the seed signal is reduced compared to single-clad doped fibers. Nevertheless, the length of the fiber combined with high pump power levels allows for high power amplification. Already more than 1 kW has been reached at 1080 nm with an M2 value of 1.4 [41] using a double-clad fiber amplifier. In our case,
high-power amplifiers based on double-clad fibers are placed after the single-mode fiber amplifiers to reach the watt level.
Figure 2.6: High power amplifier pumped by multimode pump diodes coupled into the double-clad fiber through the multimode pump combiner.
The scheme of high-power fiber amplifiers is close to the single-mode fiber amplifiers as depicted in Figure 2.6. The multimode pumps are
In this work, high power fiber amplifiers constitute the last stage of amplification for both 1-µm and 1.5-µm amplification lines. For the amplification at 1.5 µm, a co-doped erbium-ytterbium double-clad fiber is used. The pump at 980 nm is more easily absorbed by the ytterbium ions, which transfer their energy to the erbium ions, thus enhancing the pumping efficiency.
2.1.2 Design and experiment
In fiber amplification, many physical processes occur either participating to the amplification of the signal or degrading it. Two important examples of those processes are the amplified spontaneous emission (ASE) and the stimulated Brillouin scattering (SBS).
Spontaneous emission is, in most cases, an undesirable effect that occurs in gain media. Atoms (or ions) of the gain medium are pumped to a higher energy level and, depending on their lifetime, spontaneously return to a lower level by emitting a photon. This luminescence is usually considered as noise. In a pumped doped fiber, photons from spontaneous emission propagate along the fiber and are amplified by stimulated emission and, in the two directions, forward and backward. This phenomenon is called Amplified Spontaneous Emission (ASE) in fibers. In a fiber amplifier, ASE is unavoidable and takes the form of parasitic light emission in both directions contributing to the noise of the amplifier. To keep its level as low as possible, many solutions are available: the first one consists of an optimized design of the amplifier, depending on the input seed level and on the pumping level to reduce the generation of ASE. Enclosing the fiber amplifier by two isolators increases the signal-to-ASE power ratio of the out-coupled light. Finally, inserting an optical filter tuned to the seed wavelength at the the amplifier output confines most of the ASE inside the amplifier as its spectral bandwidth is much larger than the amplified signal linewidth.
Stimulated Brillouin scattering (SBS) originates from Brillouin scattering where a backscattered optical wave and an oscillation of the medium with an acoustic frequency (a phonon) are created during the propagation of light in a medium. This nonlinear effect is particularly visible in fibers as its efficiency depends on the light intensity. The backscattered wave has its frequency downshifted (by 10 – 20 GHz) compared to the propagating light (Stokes wave). Owing to a physical effect called electrostriction, Brillouin scattering is further amplified. Indeed, due to the interference pattern created by the forward and backward
propagating light, the medium density is periodically modified, creating a Bragg grating, enhancing the reflected Stokes wave, resulting in stronger interferences [42]. This effect is called SBS, it is particularly present for narrow linewidth continuous-wave radiation with its high-power spectral density at the laser frequency. In fiber amplifiers, high levels of SBS can lead to strong pump depletion and chaotic power fluctuations thus limiting the achievable amplified power. SBS effects can be prevented with a suitable fiber amplifier design: long fibers tend to favour SBS, thus for a given pump and signal powers, the fiber length is optimized such that the SBS power remains low.
In order to make a proper design of the fiber amplifiers, the commercially available software RP Fiber Power (RP Photonics) was used. It proposes an efficient power propagation as well as a numerical beam propagation. The other physical effects that limit the amplification, such as SBS and ASE, are also evaluated.
2.1.2.1 1.5-µm amplification
The laser source is a fiber-coupled 14-pins butterfly semiconductor diode (Eblana-photonics EP1560-0-NLW). The diode mount (LM14S2 Thorlabs) allows temperature control and current adjustment of the chip combined with a temperature controller (TED200C Thorlabs) and a low-noise current driver (Koheron DRV 200). When stabilized at 35 °C and supplied with 300 mA the diode delivers 9 mW at 1560 nm. Using the elements presented in subsection 2.1.1, an amplifier system composed of multiple stages was designed. Aiming for tens of watts of output power at 1560 nm, the amplifier design started with the last stage of amplification using a double-clad doped fiber. The pump power available from multimode semiconductor diodes at 980 nm is about 50 W. Double-clad fibers with Er- and Yb-co-doped core supporting single-mode propagation at 1560 nm are not numerous on the market. For its high doping concentration and the long record of quality fibers produced by the supplier, the DCF-EY-10/128-PM fiber from Coractive was chosen. The fiber specifications given by the supplier and summarized in Table 2.1 were used in the simulations.
The goal of the simulations was to evaluate the optimal fiber length for a given input seed power while checking that the ASE and SBS powers
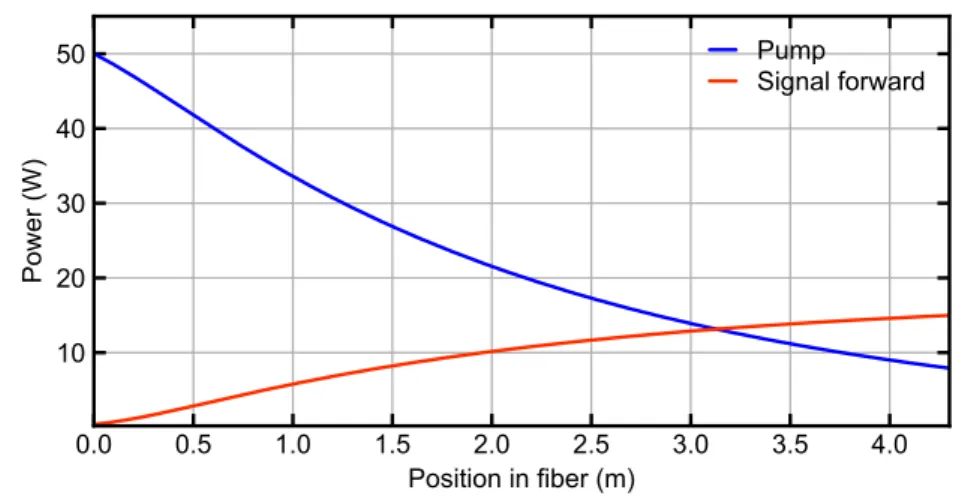
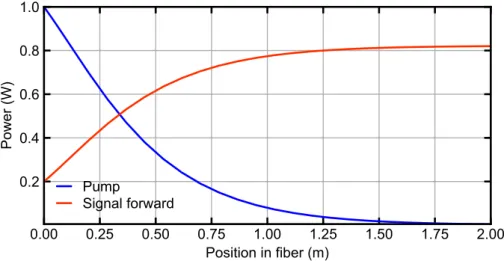
Figure 2.7: Evolution of the pump (at 980 nm, in blue) and signal (at 1560 nm, in red) powers along the double-clad fiber. The fiber length is set to 4.3 m.
Up to 15 W of amplified signal power are predicted directly out of the DC fiber, as well as 7.9 W of unabsorbed pump.
The SBS and the forward and backward ASE total powers were calculated in the script but are not shown on the graphics. In this case, 1.3 W of SBS is predicted. The ASE in backward and forward direction was simulated as well but the script showed difficulties in handling it properly, most probably because of the co-doped core. The given values are 50 µW for forward ASE and 276 µW of backward ASE power.
Increasing the fiber length would allow achieving higher signal power with less pump power out of the DC fiber. However, the SBS power would increase dramatically resulting in a high risk of damaging components before the amplifier (e.g., the isolator). For example, a fiber length of 4.5 m would lead to 10 W of SBS power instead of 1.3 W.
Decreasing the input seed power would slightly release the constraint for the amplification stage before the DC fiber, but would result in a strong increase of the ASE: with 100 mW of input seed power, 1.5 mW of backward ASE power is predicted instead of 276 µW (although the values are not reliable, the trend can be trusted).
To couple around 400 mW of signal power into the last stage amplifier from a 9-mW laser seed diode, another amplifier was designed and set in between. This amplification stage is referred to as the pre-amplification stage (or the pre-amplifier). Considering the involved power levels, a single-clad doped fiber is enough for an efficient amplification and an Er35-7PM fiber from Coractive was chosen. In contrast to the previously described DC fiber, the supplier did not provide all specifications of this
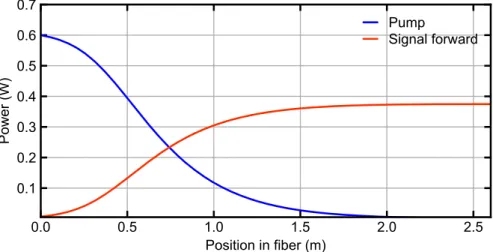
active fiber and assumptions concerning many parameters like the doping concentration or the upper-state lifetime were made as listed in Table 2.1. Using a 600-mW pump diode and 7 mW of input power (an isolator is placed between the seed diode and the Er-doped fiber) simulations predict that with a fiber length of 2.6 m, up to 375 mW of signal can be obtained with only 1 mW of remaining pump power (see Figure 2.8).
Figure 2.8: Signal (in blue) and pump (in red) powers along the fiber length for 2.6 m of Er-doped single-clad fiber with an input power of 7 mW.
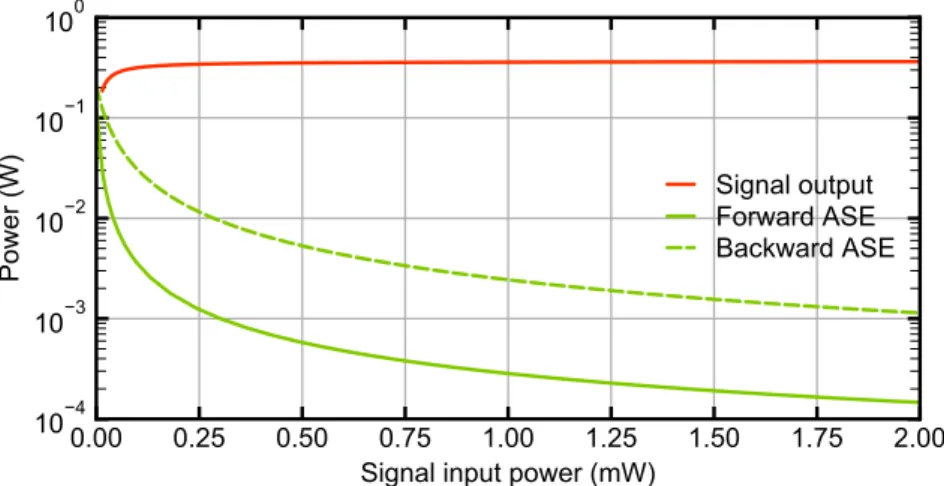
The SBS is not significant for such power levels, with 14 pW of predicted power. The ASE displays a relatively flat spectrum (see Figure 2.9) and a low level in both directions: 377 µW of backward power and 54 µW of forward power. During the experiments, the seed diode might be changed, or optical elements might be inserted (like an acousto-optic modulators AOM) before the active doped fiber, reducing the input signal power coupled to the amplifier. Figure 2.10 shows the evolution of the output signal power level and the ASE powers (in both directions) for different input power levels. The input power could be, in principle, reduced to 1 mW, while the system performances would remain quite similar: a low level of ASE and an output power level of approximatively 370 mW.
Figure 2.9: ASE power spectral density around the signal wavelength (1560 nm) for 2.6 m of Er-doped single-clad fiber, pumped by 600 mW at 980 nm and emiting 375 mW of signal at 1560 nm with an input power of 7 mW.
Figure 2.10: ASE powers (in both directions, in green) and signal output power (in red) for different input power levels for 2.6 m of Er-doped single-clad fiber, pumped by 600 mW at 980 nm and emiting 375 mW of signal at 1560 nm.
The power level calculated from these simulations is enough to seed the last stage amplifier. However, in the experiment, the pre-amplifier power level is measured to be only 200 mW instead of the simulated 375 mW of signal. Most likely, this difference is due to higher losses of the
isolators and the WDM than assumed in the simulations, or to differences in the used fiber parameters.
To counterbalance the low power, a second pre-amplifier has been built after the first one. The design is essentially the same, except for the fiber length which is reduced to 2 m thanks to the high input seed signal power, using the same doped fiber but to reach higher signal power, a 1-W pump diode is used.
Figure 2.11: Signal (in red) and pump (in blue) powers along the fiber length for 2 m of Er-doped single-clad fiber with an input power of 200 mW.
Up to 820 mW of signal power is predicted with an input power of 200 mW, with 4 mW of pump remaining at the end of the doped-fiber (see Figure 2.11). The SBS remains at a negligible power level: 30 pW of power as well as the ASE in both directions: 12 µW of forward power and 26 µW of backward power.
In the experiment, like for the previous comparison with simulations, the power level is lower than the predicted value: up to 500 mW is measured directly out of the active fiber. Again, the difference might originate from non-accurate parameters for losses or describing the fiber.
Table 2.1: Fiber parameters for 1-µm and 1.5-µm fiber amplifier simulations. Data from fiber specifications provided by the supplier.
Nevertheless, the goal of 400 mW at the entrance of the last stage amplifier is reached in this configuration. The next paragraph sums up the entire amplification system and focuses on the last stage fiber amplifier design and performances as well as the trouble-shooting of the encountered problems.
The overall amplification system is shown in Figure 2.12. The seed signal originates from a 9-mW semiconductor diode emitting at a wavelength of 1560 nm in single-mode operation. It is then amplified in two stages of SC Er-doped fiber (Coractive Er35-7 PM) with gain segments of 2.6 m and 2 m, respectively. Using two single-mode fiber Bragg grating 1-µm amplifier 1.5-µm amplifier Pre-amplification stage 1st part /2nd part
Fiber denomination Yb401-PM Er35-7-PM Fiber length (m) 0.64 2.6 / 2 Core diameter (µm) 5 5
Ion doping Yb Er Doping concentration (assumption)
(ion/m3)
8×1025 24.6×1024
Absorption (dB/m) 7.7 @1200nm 37.9 @1530nm Last amplification stage
Fiber denomination 10/125DC-PM Yb1200- DC-EY-10/128-PM Fiber length (m) 1.9 4.3
Core diameter (µm) 10 10 Cladding diameter (µm) 125 128
Ion doping Yb Er / Yb Doping concentration (assumption)
(ion/m3)
9×1025 43×1024 (Er)
2.2×1024 (Yb)
(FBG) stabilized pump diodes with a respective maximum power of 600 mW and 1 W at 980 nm, the signal is first amplified up to 400 mW. Then it passes through a 1550-nm/1030-nm WDM, to extract the backward propagating ASE at 1030 nm, generated in the following Er-Yb amplification stage. The last amplification stage consists of 4.3 m of DC Er-Yb co-doped fiber (Coractive DCF-EY-10/128-PM, 10 µm core diameter) and is pumped up to a power of 15 W at 976 nm. A 5-cm long 10 degrees angle-cleaved SC fiber (PM 1550) is spliced to the DC gain fiber for transverse mode cleaning. The outcoupled beam is collimated using an aspheric lens with a focal length of 8 mm and passes through a half waveplate and a high-power isolator. After isolation, 4 W of amplified power are measured at 1560 nm.
Figure 2.12: Scheme of the amplification stages at 1560 nm. LD: laser diode, ISO: isolator, WDM: filter-based wavelength-division multiplexer used in reflection, HP ISO: high power isolator, MPC: multimode pump combiner.
Since high-power fiber lasers can reach the kilowatt level in single mode operation, the thermal management of DC fibers has been well studied [43]. In a first configuration, the fiber was rolled around a home-designed aluminum rod with grooves maintaining the fiber and assuring (a priori) a proper heat extraction. But with around 15 W of pump power and 5.5 W of signal power, the fiber was damaged. For a better heat management, the Er-Yb double-clad fiber was placed in a water tank. Indeed, water offers a uniform thermal heat removal with a high thermal capacity. In this configuration, no fiber damage was observed, the pump power could be increased up to 14.6 W and 4.7 W of cw radiation at 1560 nm was obtained (see Figure 2.13). When the power was further increased, the
LD 1560 nm ISO ISO HP ISO Water tank WDM WDM Pump 600 mW Pump 1 W 2 x Pumps 2 x 25 W Er35-7 PM 2.6 m Er35-7 PM2 m Backscattered ASE 1030 nm Amplified signal 1560 nm DC-EY-10/128 4.34 m WDM MPC DILAS DILAS
With a thermal camera, a very high and unusual temperature of the high-power isolator was observed. Suspecting some backward ASE, a WDM was spliced to extract the backward radiation around 1 µm. For 3 W of amplified signal at 1560 nm, up to 500 mW of ASE at 1030 nm was shining on the isolator, heating it up and thus reducing its transmission.
Directly out of the DC fiber, once the remaining pump is removed (removal of the fiber second cladding and coated with high index glue), some higher order modes were still present in the beam. In a first design for pump extraction at the end of the DC fiber, the polymer coating was removed, and the uncoated part of the fiber was directly glued onto a metallic piece (aluminum in this case) covered with a thin graphite sheet used as heat sink (design used for the single-pass DFG experiment, with results reported in subsection 2.2.2.4). The junction between the coated and uncoated fiber parts was set with low index glue at the center of the heat sink for maximum heat removal. But occasionally, the junction ignited, setting fire to the polymer coating of the DC fiber. To solve those two problems, a 5-cm long PM 1550 fiber was spliced at the end of the DC fiber (and angle-cleaved on the other side) to filter-out the higher order modes.
The splicing point as well as the coated/uncoated junction of the DC fiber were glued onto a water-cooled copper-based graphite-covered heat sink. The water-cooled piece of metal was home-designed and manufactured at the university workshop. No more fiber ignition was observed since then and the output transverse mode was clean and single-mode.
Figure 2.13: Power slope of the last fiber amplifier stage at 1560 nm. Initial input power: 400 mW. The slope efficiency is 𝜂 = 32%.
2.1.2.2 1-µm amplification
The design of the 1-µm amplification system was achieved using a similar scheme and script as for the 1.5-µm amplifier. Simulations match quite well the measurements for Yb-doped fiber and the ASE and SBS levels are predicted low.
At 1 µm, the amplifier is also seeded by a fiber coupled 14-pins butterfly distributed feedback (DFB) semiconductor diode (QDLaser QLD1061-3030). The chip is mounted in an all-included laser driver module (OptoSci LDR1500E) including temperature controller and current driver that are computer-controlled. When stabilized at 25 °C, the diode delivers 55 mW of 1030-nm light at a current of 200 mA. It was initially amplified to 400 mW, using 1 W of pump light, in a 64-cm long single clad (SC) Yb-doped fiber (Coractive Yb 401-PM) amplifier. Fiber coupled isolators were placed between the seed source and the following amplification stages. The pre-amplified signal was power-amplified in a 1.9-m long double clad (DC) fiber (Liekki Yb 1200-10/125DC-PM, 10 µm core diameter) that was pumped by volume Bragg grating (VBG) stabilized fiber-coupled laser diodes at 976 nm with a total power up to 45 W. The fiber length was optimized to minimize SBS while maximizing the amplification factor. The end tip of the gain fiber was spliced to a 20-cm long SC fiber (PM980) to filter out higher-order modes and clean the transverse mode of the laser radiation. As for the 1.5-µm amplifier, the splice point was glued onto a water-cooled copper block using a high-index epoxy to extract and prevent the excess pump from reaching the fiber tip and causing thermal issues. The fiber tip was cleaved at an angle of 10 degrees and glued onto an aluminum block. The output beam is collimated using an aspheric lens with a focal length of 11 mm. LD 1030 nm ISO HP ISO WDM Pump 1 W 2 x Pumps 2 x 25 W Yb 401 PM Amplified signal 1030 nm MPC DILAS
As for the 1.5-µm amplifier, problems of coating ignition and higher-order modes appeared and were solved in the same way. However, no thermal management problems along the fiber appeared, and the first design with a home-made aluminum cylinder with grooves was kept for the following experiments. As a result of the high ytterbium absorption at 980 nm only a short fiber length is enough to reach high power.
As no problems of ASE were observed, the full pump power capacity could be used, and up to 29.6 W of amplified signal at 1030 nm was measured with 45 W of pump power (see Figure 2.15).
Figure 2.15: 1030-nm fiber amplifier power slope. Input power: 330 mW; doped-fiber length: 1.9 m. The slope efficiency is 𝜂 = 62%.
In conclusion to this section, two high-power fiber amplifiers delivering respectively up to 4 W at 1560 nm and 30 W at 1030 nm have been presented. Some issues like thermal management of the pump out-coupling and a remaining multimode operation as well as backward ASE were solved with design modifications. However, after passing through a half wave plate and an optical high-power isolator, the optical power at both wavelengths was unstable over time (variation of about 10 % at the highest power operation). This power instability seemed, among other reasons, to originate from polarization instabilities. For both lines, all the fibers of the amplifiers are PM, thus the linear polarization of the light out of the seed laser diodes should be preserved [44]. However, the birefringence of PM fibers could be modified with mechanical stress or with temperature variation, and in the case of high-power fiber amplifier where
thermal management is possibly an issue, precise polarization control is very challenging. In the 1.5-µm fiber amplifier where some residual mode mixing was observed, polarization instabilities were the strongest. Thus, for difference frequency inside the enhancement cavity, the pump power was limited to 5-6 W resulting in an output power of 2.3 W at 1560 nm.
2.2 Difference frequency generation in a
PPLN
2.2.1 Theoretical background
In this subsection, a short review of the basic principles of nonlinear optics and DFG is presented. It is followed by the description of a single-pass DFG experiment, its results in comparison to the theoretical expectations and a discussion of the encountered limitations.
2.2.1.1 Difference frequency generation
DFG is a three-wave nonlinear interaction that occurs when light is coupled into a material lacking inversion symmetry. The medium exhibits a 𝜒7
nonlinearity. When two light beams of different frequency and sufficiently high intensity are coupled into the crystal, difference frequency generation can occur. By convention (from the OPO community), 𝜔8, 𝜔9 and 𝜔: are the
pump, signal and idler frequencies, respectively, which are linked by the energy conservation relation (see Figure 2.18):
𝜔8− 𝜔9 = 𝜔:.
Difference frequency generation has been theoretically studied by Armstrong et al. [45] and formalized by Boyd and Kleinman [46] in the case of two focused gaussian beams.
Nonlinear processes strongly depend on the intensity of the incoming radiations. However, another fundamental parameter is phase matching. Indeed, to participate efficiently to the nonlinear process, the involved waves have to interact together with a defined phase relationship all along their propagation inside the nonlinear crystal. In other words, the phase mismatch between the different waves has to be as close as possible to zero. For a three-wave interaction (pump, signal and idler), the phase mismatch is given by:
∆𝑘 = 𝑘8− 𝑘9− 𝑘:
where 𝑘9 and 𝑘: represent the wave numbers of the signal and idler,
Figure 2.16: Scheme of principle of the phase-matching condition.
Inside the nonlinear crystal, the different waves experience normal dispersion (the refractive index increases with frequency), which makes the phase matching impossible to achieve without any additional process.
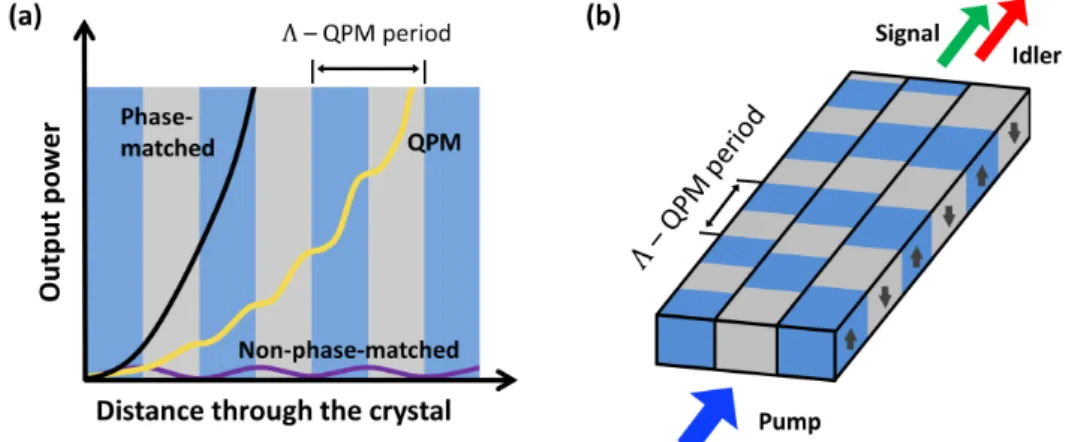
Figure 2.17: (a) Comparison between the output power of a fully phase-matched process, quasi-phase-phase-matched (QPM) process and a non-phase-matched process as function of the position inside the crystal. Λ represents the QPM period. (b) Scheme of a periodically-poled crystal with different channels corresponding to different poling periods.
In the frame of this thesis, quasi-phase-matching is used to efficiently generate DFG. The crystal used for quasi-phase matching is no longer homogeneous but periodically “poled”, meaning that one of the crystal axes is periodically inverted with a spatial poling period Λ. The inversion of the crystal axis changes the sign of the effective nonlinear coefficient, which then compensates for the nonzero phase mismatch coefficient. If the poling period is correctly chosen, the induced electrical field at this point contributes positively to the total amplitude of the induced electric field
and in the case of lithium niobate, the quasi-phase matching term is several times larger than the birefringent phase matching, leading to higher conversion efficiency. In this work, the crystal used for nonlinear conversion is a periodic-poled lithium niobate (PPLN).
The optical power produced in the DFG process is defined as: 𝑃:BCDE = 𝜂𝑃9:FGHC𝑃8IJ8𝐿LLMN
with 𝑃:BCDE, 𝑃9:FGHC and 𝑃8IJ8 are the optical powers of the idler, signal and
pump, respectively and 𝐿LLMN the length of the PPLN. The key parameter is
𝜂, the efficiency of the DFG process. In [47], it is defined as follows: 𝜂 = (2𝜔:𝑑DQQ)7 𝑛8𝑛9𝑛:𝑐U𝜋𝜖 /× ℎ(𝜇, 𝜉) 1 𝑘8+𝑘19
Figure 2.18: a) Energy diagram of the difference frequency generation process. b) Basic scheme of the DFG process with 𝐿]]^_ being the PPLN length.
with 𝑛8,9,: the refractive index of the pump, signal and idler, respectively, 𝑐
the speed of light, 𝜖/ the permittivity of vacuum and 𝑘8,9 the wavenumber
of the pump and signal.
An important part results from the imaging function ℎ(𝜇, 𝜉) that is precisely described in [48], and [47] sets as follows:
ℎ(𝜇, 𝜉) = 1 2𝜉× ` 1 + 𝜏b𝜏bb (1 + 𝜏b𝜏bb)7+ 14 d1 + 𝜇 1 − 𝜇 +1 − 𝜇1 + 𝜇e 7 (𝜏b− 𝜏bb)7 𝑑𝜏b𝑑𝜏bb ff /gf
with 𝜇 = hi
hj the degeneracy parameter, 𝜏 =
7k
l where 𝑧 is the optical distance
from the focal point, 𝑏 the confocal range of a Gaussian beam: 𝑏 = 2𝑧o with
𝑧o the Rayleigh range and 𝜉 =^ppqr
l is the focusing parameter.
The imaging function accounts for the spatial distribution of the light intensity at the focus inside the crystal assuming Gaussian pump and signal beam profiles. Note that here a perfect overlap between pump and signal beams is assumed.
As previously seen in the expression of the DFG efficiency, the refractive indices have an important influence. The wavelength and temperature dependency of the extraordinary refractive index in Mg-PPLN are described by the Sellmeier equation [49]:
𝑛s7 = 𝑎 u+ 𝑏u𝑓 + 𝑎7+ 𝑏7𝑓 𝜆7− (𝑎 U+ 𝑏U𝑓)7+ 𝑎w+ 𝑏w𝑓 𝜆7− 𝑎 x7 − 𝑎y𝜆7
with the temperature-dependent parameter 𝑓 = (𝑇 − 24.5)(𝑇 + 570.82) and 𝑇 the temperature of the material in °C. Note that 𝜆 is expressed directly in µm in this equation. All coefficients 𝑎• and 𝑏•, where 𝑗 is an integer, are
relative to the material, they are known as the Sellmeier coefficients. For a 5 % Mg-doped lithium niobate crystal, the Sellmeier coefficients are given in Table 2.2.
Table 2.2 : Determined Sellmeier coefficients for 5% MgO-doped congruent LiNbO3, data from [50].
𝜆: = 𝜆9𝜆8 𝜆9− 𝜆8
In this thesis, with a pump wavelength of 1030 nm and a signal at 1560 nm, the idler wavelength corresponds to 𝜆• = 3070.2 nm (wavelength in
vacuum). The phase mismatch wavevector is defined as: 𝛥𝑘 = 𝑘8− 𝑘9− 𝑘:−7ƒ„.
The optimum phase-matching corresponds to 𝛥𝑘 = 0, which gives the following condition when introducing the wavelength 𝜆8,9,:=
7ƒ …j,i,†(‡) hj,i,† . 𝑘8− 𝑘9− 𝑘:−2𝜋 𝛬 = 0 1 𝛬= 𝑛8(𝑇) 𝜆8 − 𝑛9(𝑇) 𝜆9 − 𝑛:(𝑇) 𝜆:
For a given temperature 𝑇, the phase matching condition defines a unique value of the poling period 𝛬. In the experiment of this thesis, the selected PPLN crystal has the following set of polling periods: 28.5, 29, 29.5, 30, 30.5, 31, and 31.7 µm. For pump and signal wavelengths of 1030 nm and 1560 nm, the phase matching condition can be fulfilled for a groove with a poling period of 30 µm at a crystal temperature of 124 °C (see Figure 2.19).
Figure 2.19: Phase matching conditions fulfilled for a given poling period and temperature with 𝜆8= 1030 nm, 𝜆9 = 1560 nm and 𝜆:= 3070 nm in vacuum.
2.2.2 Single-pass difference frequency generation
experiment
The final experimental goal was to generate a powerful radiation in the mid-IR by DFG by recycling the 1.5-µm beam inside an enhancement cavity. However, a simpler experiment was initially realized in a single-pass configuration to optimize different parameters, such as the beam collimation for an optimum focusing into the crystal as well as the detection of the generated 3-µm radiation.
2.2.2.1 Optimal radius for DFG and collimation line
For a given crystal (5 % MgO-doped PPLN, 5-cm long) and a defined power and wavelength of the pump and signal, only the imaging function can be varied and affects the DFG efficiency. Assuming Gaussian beams, the Rayleigh distance is defined as 𝑧o =ƒ‹Œ
•
Ž with 𝑟/ the beam radius at the focal
point and 𝜆 the wavelength of the focused light. The confocal parameter is simply defined as 𝑏 = 2𝑧o. Figure 2.20 shows the calculated variation of the
3-µm idler power for 6 W of 1030-nm pump and 3.7 W of 1560-nm signal (typical values obtained out of the fiber amplifiers).
For an optimized overlap of the pump and signal beams, the waist at the focal point must be the same at both wavelengths. The maximum calculated value of the idler power is 19.8 mW, which is reached for a beam radius of 77.2 µm at the focal point.
To experimentally reach this value, a collimation line has been set for each wavelength with a selected set of lenses.
Figure 2.21 and Figure 2.22 show the respective collimation setup. A ray propagation script implemented under Python and based on the ABCD-matrix formalism was used to simulate the beam propagation out of the fiber amplifiers.
Figure 2.21: 1.5-µm beamline for focus creation inside the PPLN. Top: the beam path scheme with optical components out of the DCF-EY-10/128-PM fiber creating a focus inside the crystal. NA: numerical aperture. Bottom: the beam propagation along the z-axis from simulations.
In order to minimize spherical and coma aberrations, a short focal length (f = 11 mm) aspheric lens (Thorlabs C220TMD-C) was chosen to collimate the beam at the output of the fiber. The second lens (Thorlabs AC254-150-C-ML) is achromatic and focuses the 1560-nm beam inside the crystal with a calculated radius of 78 µm (at 1/e2) at focus. In the 1030-nm
beam line, the collimation follows a fairly similar path, excepted for the numerical aperture (NA) of the output fiber, resulting in a smaller beam divergence. 0 200 400 600 800 Position (mm) 0 200 400 600 800 1000 1200 Beam radius 1/e² (µm) f = 11 mm f = 150 mm PPLN f = 11 mm f = 150 mm PPLN 0.5 m Fiber NA = 0.201
Figure 2.22: 1-µm beamline for focus creation inside the PPLN. Top: the beam path scheme with optical components out of the Yb 1200-10/125DC-PM fiber creating a focus inside the crystal. Bottom: the beam propagation along the z-axis from simulations.
Only a f = 25 mm lens (Thorlabs AC1270-25-B-ML) is needed out of the fiber to collimate the beam. The 1-µm beam is then focused by a f = 250 mm achromatic lens (Thorlabs AC254-250-C-ML) into the crystal with a 76-µm radius (calculated) at focus.
The simulation method presented here will prove to be very convenient later for collimation and efficient coupling of the beams inside the enhancement cavity (see subsection 2.3.1).
As previously mentioned, the end-tip of both fiber amplifiers are angle-cleaved and followed by the first collimation lens. For both beamlines, the first lens is followed by a half-wave plate and a high-power free-space isolator, which protects the fiber amplifier from any back reflexion from the following components. The high-power isolators also
0 200 400 600 800 1000 Position (mm) 0 200 400 600 800 1000 1200 Beam radius 1/e² (µm) f = 25 mm f = 25 mm f = 250 mm f = 250 mm PPLN PPLN 0.5 m Fiber NA = 0.08