HAL Id: hal-00296874
https://hal.archives-ouvertes.fr/hal-00296874
Submitted on 20 Feb 2006
HAL is a multi-disciplinary open access
archive for the deposit and dissemination of
sci-entific research documents, whether they are
pub-lished or not. The documents may come from
teaching and research institutions in France or
abroad, or from public or private research centers.
L’archive ouverte pluridisciplinaire HAL, est
destinée au dépôt et à la diffusion de documents
scientifiques de niveau recherche, publiés ou non,
émanant des établissements d’enseignement et de
recherche français ou étrangers, des laboratoires
publics ou privés.
Heavy precipitation episodes and cosmic rays variation
A. Mavrakis, S. Lykoudis
To cite this version:
A. Mavrakis, S. Lykoudis. Heavy precipitation episodes and cosmic rays variation. Advances in
Geosciences, European Geosciences Union, 2006, 7, pp.157-161. �hal-00296874�
Advances in Geosciences, 7, 157–161, 2006 SRef-ID: 1680-7359/adgeo/2006-7-157 European Geosciences Union
© 2006 Author(s). This work is licensed under a Creative Commons License.
Advances in
Geosciences
Heavy precipitation episodes and cosmic rays variation
A. Mavrakis1and S. Lykoudis2
1Department of Economic & Regional Development, Panteion University, Athens, Greece
2Institute of Environmental Research & Sustainable Development, National Observatory of Athens, Greece
Received: 7 October 2005 – Revised: 18 January 2006 – Accepted: 23 January 2006 – Published: 20 February 2006
Abstract. In this paper an attempt is made to investigate the
possible temporal correlation between heavy precipitation episodes and cosmic rays’ activity, on various time scales. Cosmic rays measurements are sparse and cover less ex-tended periods than those of precipitation. Precipitation is largely influenced by local climatic and even physiographic conditions, while cosmic rays’ distribution is far more uni-form over an area. Thus, in an effort to cover a larger range of climatic characteristics, each cosmic rays station was corre-lated with several nearby precipitation stations. Selected sta-tistical methods were employed for the data processing. The analysis was preformed on annual, seasonal, monthly and daily basis whenever possible. Wet and dry regions and/or seasons seem to present a different response of precipitation to cosmic rays variations. Also Forbush decreases in most cases will not lead to heavy precipitation, yet this might be sensitive to precipitable water availability.
1 Introduction
Cosmic rays are energetic particles originating from both so-lar and non-soso-lar sources. The latter are called galactic cos-mic rays (GCR) and come mainly from outside the solar sys-tem. The number of GCRs that reach the surface of the Earth is influenced by solar activity, latitude, altitude, diurnal cycle, and Earth weather. Emissions of matter and electromagnetic fields from the Sun, namely solar wind, increase during high solar activity, making it harder for GCRs to penetrate the in-ner solar system and reach the Earth. Thus, the GCR inten-sity is lower when solar activity is high and vice-versa. The phenomenon presents an approximately 11 year periodicity (Manuel et al., 2002). Irregular decreases of GCR intensity at short time scales are of special interest. These anomalies are known as Forbush decreases (FDs), and are associated with magneto-hydrodynamic disturbances following solar coronal
Correspondence to: A. Mavrakis
mass ejections (Pall´e Bag´o and Butler, 2000; Manuel et al., 2002).
Changes in local weather can also influence GCR fluxes. Strong atmospheric electric fields associated with thunder-storms have an effect on the propagation of GCR particles. Besides that, GCR intensity is dependent on altitude. The exact mechanism remains unknown, but increased cloudiness could be a plausible suggestion.
GCRs, on the other hand, may directly influence cloud for-mation through the production of cloud condensation and/or ice nuclei via GCR induced ionisation. Indirect mechanisms include modulation of the atmospheric electrical conductiv-ity within the “global electric circuit” by GCR ionisation and subsequent effects on cloud microphysics through the pro-cess of electro-scavenging (Raspopov et al., 1998; Pall´e et al., 2004). Furthermore, GCRs by triggering cloud forma-tion might also be changing precipitaforma-tion and variaforma-tions in precipitation, potentially caused by changes in the GCR flux, thus having implications for the understanding of cloud and water vapour feedbacks.
Various possible effects of ionisation by either GCRs or solar activity itself on cloud formation and precipita-tion processes have been explored by several researchers. There is a long history of solar-climate studies, many of which have shown significant correlations between atmo-spheric parameters and solar variability (Marsh and Svens-mark, 2000; Kniveton and Todd, 2001; Todd and Knive-ton, 2001; Tsiropoula, 2003; KniveKnive-ton, 2004). Svensmark (1998), on the other hand, concludes that climate seems to be influenced by solar activity via the connection between GCRs and clouds, while heavy precipitation episodes, con-sidered to be associated with GCRs variations, were found to result in greater radiative effects than solar output itself (Zhao et al., 2004).
158 A. Mavrakis and S. Lykoudis: Heavy precipitation episodes and cosmic rays variation
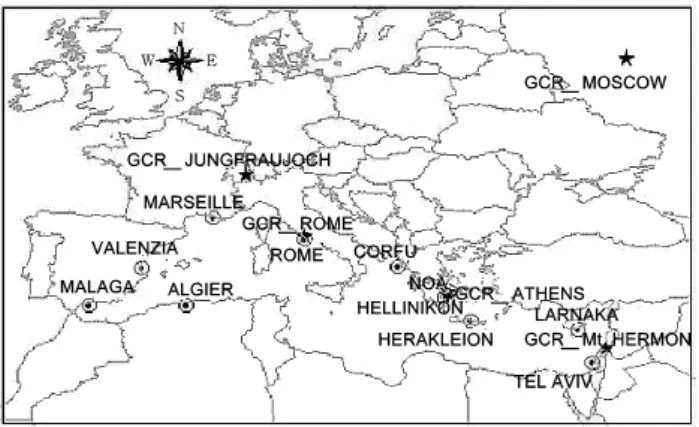
Fig. 1. Mediterranean GCR and precipitation stations.
Criticism (Jorgensen and Hansen, 2000; Sun and Bradley, 2002) and second thoughts on the relation between solar and GCRs variation and climate (Yu and Turco, 2001; Kniveton, 2004; Zhao et al., 2004), have focused on the lack of physical explanation on how very low energy fluxes, implicit in solar irradiance variations, are able to cause the observed climate variability that involves much higher energy fluxes. Even the long-term stability of the observed relationships has not been adequately explained yet. In this context there is a clear need for observational studies to assess the evidence for the op-eration of such mechanisms at climatic spatial and temporal scales.
The aim of this study is to examine the correlation be-tween heavy precipitation episodes and GCR variations on an annual, seasonal and monthly basis, and to quantify the probability of a concurrency between FDs and heavy precip-itation episodes, over the Mediterranean Region, considering several meteorological and GCR stations, across the area, for the period of 1958–2005.
2 Data and methodology
GCR data are recorded by ground-based neutron monitors measuring the low-energy part of the primary GCR spec-trum. Although absolute GCR values present significant spatial variability, the normalized GCR variation, for dif-ferent stations, remains quite similar (Svensmark and Friis-Christensen, 1997). For the purpose of this study we ob-tained the GCRs datasets (10–20 GeV, pressure corrected) from all stations located around the Mediterranean and avail-able online. The stations used are Rome, Jungfraujoch, Mt Hermon, and Athens plus Izmiran Moscow that served as a second reference – the first being Rome – due to its long-term uniform dataset. Daily precipitation data were obtained from the European Climate Assessment archive (Klein Tank et al., 2002), and from the National Observatory of Athens (NOA). Stations were selected so as to cover the whole extent of the Mediterranean (Fig. 1) while, at the same time, having data series covering a period matching the GCR dataset from Izmiran and Rome (1958–2005).
The precipitation stations can be sorted into two groups: one between the 30th and 40th parallel (Malaga, Valenzia, Algier – Dar El Beida, Athens – NOA and Hellinikon, Her-akleion, Larnaka and Tel Aviv) and a second between the 40th and 50th parallels (Marseille, Rome – Ciampino and marginally Corfu), thus following the zonal GCR distribu-tion.
The relative variation of the GCRs counted at each station was examined using normalized counts. Typical normaliza-tion by subtracting the long-term mean and dividing by the corresponding standard deviation was used in order to avoid the problem of different scales between the stations. Possi-ble relationships between heavy precipitation episodes and GCR variation were investigated using monthly frequencies of precipitation episodes exceeding 10 mm and 20 mm calcu-lated from daily data. Normalized episode frequencies were correlated to the respective normalized GCR time series from Rome, the Mediterranean station with the longest dataset.
In order to investigate whether it is an FD that triggers a heavy precipitation episode or the other way around, we calculated the probability of having a heavy precipitation episode before or after an FD. Three precipitation thresholds were used, namely 10, 20 and 40 mm, and seven time lags ranging from −3 to +3 days from the FD incident. A GCR count decrease was considered to be an FD when the differ-ence between the daily count and the 45-day running mean exceeded a certain threshold. A decrease threshold of 3.5% provided comparable numbers of FD events for Izmiran and Rome – about 350 for the whole period- and was also appro-priate for Athens.
Finally, for each time lag, two-way contingency tables were created giving the probability at which an FD would co-incide with a precipitation episode. Izmiran GCR was paired against all stations, since its daily data set was considered to be more uniform than that of Rome. Also, Athens GCR data were paired against the two precipitation stations of Athens.
3 Results
Normalized GCR counts from Izmiran and Rome are almost identical throughout the examined period (1958–2005) with a Pearson correlation coefficient 0.95, thus supporting the possibility of, alternatively, using either data set. All other stations present similar variation patterns even though with different degrees of variability. Mt. Hermon and Athens are much more variable than the rest of the stations during the most recent years (2000–2005) (Fig. 2).
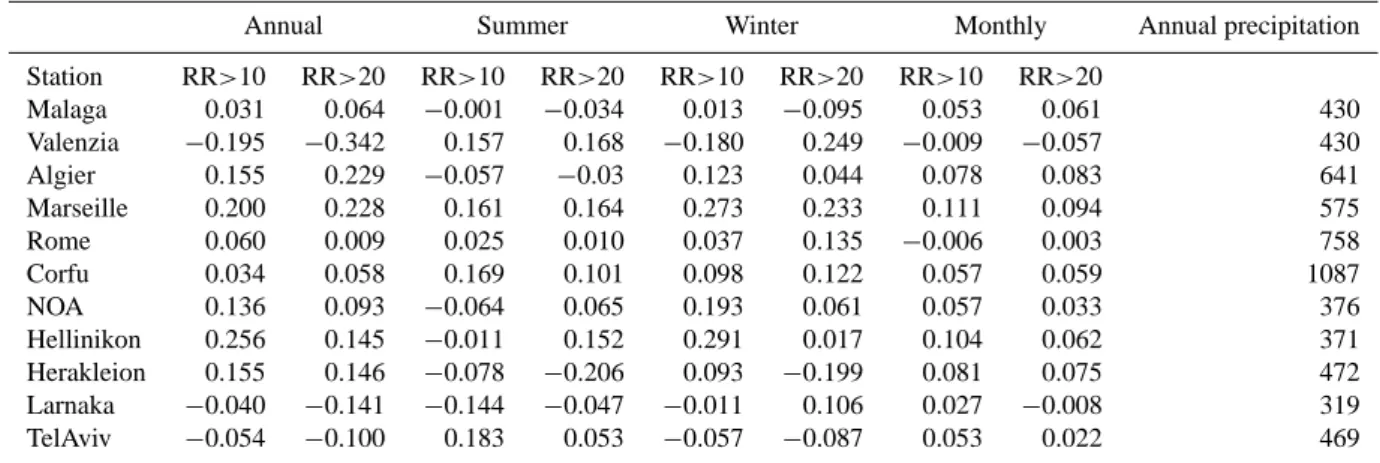
Furthermore, Pearson correlation coefficients between normalized precipitation episode frequencies (RR>10 mm and RR>20 mm) for each precipitation station and normal-ized GCR counts for Rome were calculated using annual, seasonal (winter-summer) and monthly data for the period 1958–2005. The coefficients are listed in Table 1 and se-lected graphs are presented in Fig. 3. It is evident that the response of heavy precipitation incidences to the GCR vari-ations across the examined area is far from being uniform.
A. Mavrakis and S. Lykoudis: Heavy precipitation episodes and cosmic rays variation 159
Table 1. Pearson correlation coefficients between normalized precipitation episodes and normalized GCR counts for Rome for the period 1958–2005.
Annual Summer Winter Monthly Annual precipitation
Station RR>10 RR>20 RR>10 RR>20 RR>10 RR>20 RR>10 RR>20 Malaga 0.031 0.064 −0.001 −0.034 0.013 −0.095 0.053 0.061 430 Valenzia −0.195 −0.342 0.157 0.168 −0.180 0.249 −0.009 −0.057 430 Algier 0.155 0.229 −0.057 −0.03 0.123 0.044 0.078 0.083 641 Marseille 0.200 0.228 0.161 0.164 0.273 0.233 0.111 0.094 575 Rome 0.060 0.009 0.025 0.010 0.037 0.135 −0.006 0.003 758 Corfu 0.034 0.058 0.169 0.101 0.098 0.122 0.057 0.059 1087 NOA 0.136 0.093 −0.064 0.065 0.193 0.061 0.057 0.033 376 Hellinikon 0.256 0.145 −0.011 0.152 0.291 0.017 0.104 0.062 371 Herakleion 0.155 0.146 −0.078 −0.206 0.093 −0.199 0.081 0.075 472 Larnaka −0.040 −0.141 −0.144 −0.047 −0.011 0.106 0.027 −0.008 319 TelAviv −0.054 −0.100 0.183 0.053 −0.057 −0.087 0.053 0.022 469 12 -3 -2 -1 0 1 2 3 1955 1960 1965 1970 1975 1980 1985 1990 1995 2000 2005 Moscow Jungfraujoch Athens Mt.Hermon Rome
Figure 2. Annual normalized GCR data for all stations.
Fig. 2. Annual normalized GCR data for all stations.
The correlation between precipitation episodes and GCR varies both spatially and in terms of the examined time scale, in accordance to previous findings (Trimble et al., 1997). An-nual data present higher correlations, ranging from +25% to
−34%) compared to seasonal (+27% to −20%) or monthly (+11% to −6%). This decline in correlation coefficients with increasing temporal resolution is due to the fact that precipi-tation has a marked interannual variation which is not present in GCR flux. Drier stations tend to present negative correla-tions and the same applies to summer periods. Under moder-ate to low precipitable wmoder-ater availability, GCR activity reduc-tion leads to reduced condensareduc-tion nuclei availability, thus to less competition between those and raindrops. This allows the later to grow and precipitate. On the other hand, under abundant precipitable water conditions the condensation nu-clei produced by the GCR do not hinder raindrop growth, eventually becoming raindrops themselves.
Since FDs are of special interest we investigated the prob-ability of having a precipitation episode within the period zero to three days after an FD incident. A high probabil-ity would suggest that FDs cause or at least favor precipita-tion episodes. On the other hand, we have also investigated
13 -3 -2 -1 0 1 2 3 1955 1960 1965 1970 1975 1980 1985 1990 1995 2000 2005 Rome Marseille_RR>10 Marseille_RR>20
Figure 3a: Normalized annual GCR counts from Rome and normalized precipitation episode frequency (RR>10 – square and RR>20 – circle) in Marseille Fig. 3a. Normalized annual GCR counts from Rome and
normal-ized precipitation episode frequency (RR>10 – square and RR>20 – circle) in Marseille 14 -3 -2 -1 0 1 2 3 1955 1960 1965 1970 1975 1980 1985 1990 1995 2000 2005 Rome Herakleion_RR>10 Herakleion_RR>20
Figure 3b: Normalized annual GCR counts from Rome and normalized precipitation episode frequency (RR>10 – square and RR>20 – circle) in Herakleion.
Fig. 3b. Normalized annual GCR counts from Rome and normal-ized precipitation episode frequency (RR>10 – square and RR>20 – circle) in Herakleion.
the probability of having an episode up to three days before the FD. Such an instance would indicate that the FD was the result of the precipitation episode even though this could only apply to data from neighboring GCR and precipitation
160 A. Mavrakis and S. Lykoudis: Heavy precipitation episodes and cosmic rays variation 15 0.00 0.01 0.02 0.03 0.04 0.05 0.06
Day (-3) Day (-2) Day (-1) Day 0 Day 1 Day 2 Day 3
Malaga Valenzia
Algiers Marseile
Rome
(a)
Figure 4a. Coincidence probabilities between Izmiran FDs and summer mild episodes (RR>10mm) for Western Mediterranean
Fig. 4a. Coincidence probabilities between Izmiran FDs and sum-mer mild episodes (RR>10 mm) for Western Mediterranean.
16 0.00 0.01 0.02 0.03 0.04 0.05 0.06
Day (-3) Day (-2) Day (-1) Day 0 Day 1 Day 2 Day 3
Corfu NOA
Hellinikon Herakleion
Larnaka TelAviv
(b)
Figure 4b. Coincidence probabilities between Izmiran FDs and winter episodes (RR>20mm) for Eastern Mediterranean
Fig. 4b. Coincidence probabilities between Izmiran FDs and winter episodes (RR>20 mm) for Eastern Mediterranean.
stations, due to the local character of precipitation episodes. Winter probabilities are quite different from that of summer, both in terms of distribution shape and magnitude. In several cases some of the distributions are practically non-existent. As expected, annual probabilities lay somewhere in between of the seasonal ones, so only the latter will be discussed herein. Overall the observed probabilities, when using the Izmiran GCR station, are rather small – up to 9%, rendering any remarks indicative only.
For mild episodes (RR>10), during summer, most of the Eastern Mediterranean stations present higher probabilities for a precipitation episode 1 day after an FD as compared to the days 0 and −1 in accordance to other works (Knive-ton, 2004). Western Mediterranean stations present the op-posite behavior (Fig. 4). More intense episodes (RR>20), during winter, are more frequent 1 and 2 days after the FD for the drier Eastern stations (NOA, Hellinikon, Tel Aviv) while the rest of the Eastern Mediterranean stations present higher probabilities during the FD day (Day 0). Western stations again have a different, almost invariant, behavior (Fig. 4). Severe episodes (R>40 mm) and FDs interaction is even less clear due to the relative scarceness of such episodes.
The examination of precipitation episode and FD coin-cidence on a local scale also provides some interesting
re-17 0.02 0.07 0.12 0.17 0.22 0.27
Day (-3) Day (-2) Day (-1) Day 0 Day 1 Day 2 Day 3
Hellinikon 10mm NOA 10mm
Hellinikon 20mm NOA 20mm
Hellinikon 40mm NOA 40mm
Figure 5. Winter coincidence probabilities between Athens FDs and precipitation episodes in NOA and Hellinikon
Fig. 5. Winter coincidence probabilities between Athens FDs and precipitation episodes in NOA and Hellinikon.
sults. Figure 5 illustrates that the probability of an episode occurrence 1–2 days after an FD increases along with the considered episode threshold. Also, a possible effect of lo-cal weather on the GCRs count could only be suggested for the mild episodes (RR>10 mm). This, however, might be a misreading of the figure, since one could argue that the figure actually shows a drop in probability after the FD day rather than an increase before. This, of course, would im-ply the existence of a background probability of coincidence. This explanation is consistent with the previous remark ac-cording to which when there is limited precipitable water the competition between ionization-produced condensation nuclei and raindrops limits the probability of a precipita-tion episode, or its intensity. On the contrary when there is enough precipitable water, as is often the case in winter, the aforementioned competition has no effect, thus allow-ing the ionization-produced condensation nuclei to grow and produce significant, heavy precipitation episodes.
4 Conclusions
In this paper an attempt was made to obtain some obser-vational inferences on the possible relationship between the variation of GCR flux, depending mainly on magnetic lat-itude, and precipitation. Instead of considering all precip-itation episodes, this work focused on heavy precipprecip-itation episodes that are more sensitive to factors, like condensation nuclei abundance, possibly related to GCR flux variations.
The analysis presented above supports a distinction be-tween wet and dry regions and/or seasons regarding the re-sponse of precipitation to GCR variations. Condensation nu-clei and their competition with raindrops over the available moisture in the air could be the key to this differentiation, yet supporting this inference would require a far more detailed analysis than the one attempted herein.
Finally, even though it seems that an FD in most cases will not lead to a precipitation episode, one should consider that if we could distinguish those cases with an adequate amount of available precipitable water the results might have been different.
A. Mavrakis and S. Lykoudis: Heavy precipitation episodes and cosmic rays variation 161
Acknowledgements. The authors would like to thank the Cosmic Ray Groups of: Nuclear and Particle Physics Section, Physics De-partment, University of Athens, Greece; Cosmic Ray Department of Solar-Terrestrial Division of Izmiran-Moscow, Russia; Universita degli Studi “Roma Tre”, Dipartimento di Fisica “Edoardo Amaldi”, Italy; Physikalisches Institut, University of Bern, Switzerland; Israel Space Weather and Cosmic Ray Centre & “Emilio Segre” Israel-Italy Observatory; for providing the GCR data. Also special thanks are due to the European Climate Assessment Group at KNMI, Netherlands for providing the precipitation data.
Edited by: V. Kotroni and K. Lagouvardos Reviewed by: anonymous referee
References
Jorgensen, T. S. and Hansen, A. W.: Comments on “Variation of cosmic ray flux and global cloud coverage – a missing link in solar-climate relationships” by Henrik Svensmark and Eigil Friis-Christensen (J. Atmos. Solar-Terr. Phys., 59, 1225–1232, 1997), J. Atmos. Solar-Terr. Phys., 62, 73–77, 2000.
Klein Tank, A. M. G., Wijngaard, J. B., Konnen, G. P., Bohm, R., Demaree, G., Gocheva, A., Mileta, M., Pashiardis, S., Hejkr-lik, L., Kern-Hansen, C., Heino, R., Bessemoulin, P., Muller-Westermeier, G., Tzanakou, M., Szalai, S., Palsdottir, T., Fitzger-ald, D., Rubin, S., Capaldo, M., Maugeri, M., Leitass, A., Bukan-tis, A., Aberfeld, R., Van Engelen, A. F. V., Forland, E., Mietus, M., Coelho, F., Mares, C., Razuvaev, V., Nieplova, E., Cegnar, T., Lopez, J. A., Dahlstrom, B., Moberg, A., Kirchhofer, W., Cey-lan, A., Pachaliuk, O., Alexander, L. V., and Petrovic, P.: Daily dataset of 20th-century surface air temperature and precipitation series for the European Climate Assessment, Int. J. Climatol., 22, 1441–1453, data and metadata available at: http://eca.knmi.nl, 2002.
Kniveton, D. R. and Todd, M. V.: On the relationship of cosmic rays flux and precipitation, Geophys. Res. Lett., 28, 1527–1530, 2001.
Kniveton, D. R.: Precipitation, cloud cover and Forbush decreases in galactic cosmic rays, J. Atmos. Solar-Terr. Phys., 66, 1135– 1142, 2004.
Manuel, K. O., Ninham, W. B., and Friberg, E. S.: Super fluidity in the solar interior: Implications for solar eruptions and climate, J. Fusion Energy, 21, 3–4, 2002.
Marsh, D. N. and Svensmark, H.: Low cloud properties influenced by cosmic rays, Phys. Rev. Lett., 85, 5004–5007, 2000. Pall´e Bag´o, E. and Butler, C. J.: The influence of cosmic rays on
terrestrial clouds and global warming, Astron. Geophys., 41, 4, 18–22, 2000.
Pall´e, E., Butler, C. J., and Brien, K. O.: The possible connection between ionization in the atmosphere by cosmic rays and low level clouds, J. Atmos. Solar-Terr. Phys., 66, 1779–1790, 2004. Raspopov, O.M., Shumilov, O.I., Kasatkina, E.A.: Cosmic rays as
the main factor of influence of solar variability on climatic and atmospheric parameters. Biophysics, 43, 5, 858 – 863, 1998. Sun, B. and Bradley, R.: Solar influences on cosmic rays and cloud
formation: A reassessment, J. Geophys. Res., 107(D14), 4211– 4223, 2002.
Svensmark, H. and Friis-Christensen, E.: Variation of cosmic ray flux and global cloud coverage – A missing link in solar-climate relationship, J. Atmos. Solar-Terr. Phys., 59, 1225–1232, 1997. Svensmark, H.: Influence of cosmic rays on Earths climate, Phys.
Rev. Lett., 81, 5027–5030, 1998.
Todd, M. C. and Kniveton, D. R.: Changes in cloud cover associated with Forbush decreases of galactic cosmic rays, J. Geophys. Res., 106(D23), 32 031–32 041, 2001.
Trimble, P. J., Santee, E. R., and Neidrau, C. J.: Including the effects of solar activity for more efficient water management: An ap-plication of neural networks, Second International Workshop on Artificial Intelligence Applications in Solar-Terrestrial Physics, Sweden, July 1997.
Tsiropoula, G.: Signatures of solar activity in meteorological pa-rameters, J. Atmos. and Solar-Terr. Phys., 65, 469–482, 2003. Yu, F. and Turco, R. P.: Ultrafine aerosol formation via
ion-mediated nucleation, Geophys. Res. Lett., 27, 883–887, 2000. Zhao, J., Han Y.-B., and Li, Z.-A.: The effect of solar activity on
the annual precipitation in the Beijing area, Chin. J. Astron. As-trophys., 4, 2, 189–197, 2004.