HAL Id: hal-01137896
https://hal.archives-ouvertes.fr/hal-01137896
Submitted on 31 Mar 2015
HAL is a multi-disciplinary open access
archive for the deposit and dissemination of
sci-entific research documents, whether they are
pub-lished or not. The documents may come from
teaching and research institutions in France or
abroad, or from public or private research centers.
L’archive ouverte pluridisciplinaire HAL, est
destinée au dépôt et à la diffusion de documents
scientifiques de niveau recherche, publiés ou non,
émanant des établissements d’enseignement et de
recherche français ou étrangers, des laboratoires
publics ou privés.
prostate brachytherapy seeds in CT images.
Huu-Giao Nguyen, Celine Fouard, Jocelyne Troccaz
To cite this version:
Huu-Giao Nguyen, Celine Fouard, Jocelyne Troccaz. Segmentation, separation and pose estimation of
prostate brachytherapy seeds in CT images.. IEEE Transactions on Biomedical Engineering, Institute
of Electrical and Electronics Engineers, 2015, 62 (8), pp.2012-2024. �hal-01137896�
Abstract— In this paper, we address the development of an
automatic approach for the computation of pose information (position + orientation) of prostate brachytherapy loose seeds from 3D CT images. From an initial detection of a set of seed candidates in CT images using a threshold and connected component method, the orientation of each individual seed is estimated by using the principal components analysis (PCA) method. The main originality of this approach is the ability to classify the detected objects based on a priori intensity and volume information and to separate groups of closely spaced seeds using three competing clustering methods: the standard and a modified k-means method and a Gaussian mixture model with an Expectation-Maximization algorithm. Experiments were carried out on a series of CT images of two phantoms and patients. The fourteen patients correspond to a total of 1063 implanted seeds. Detections are compared to manual segmentation and to related work in terms of detection performance and calculation time. As demonstrated by the results, this automatic method has proved to be accurate and fast including the ability to separate groups of seeds in a reliable way and to determine the orientation of each seed. Such a method is mandatory to be able to compute precisely the real dose delivered to the patient post-operatively instead of assuming the alignment of seeds along the theoretical insertion direction of the brachytherapy needles.
Index Terms— Prostate brachytherapy, radioactive seed, CT
image, biomedical image segmentation, 3D object location and orientation estimation, mixture model.
I. INTRODUCTION
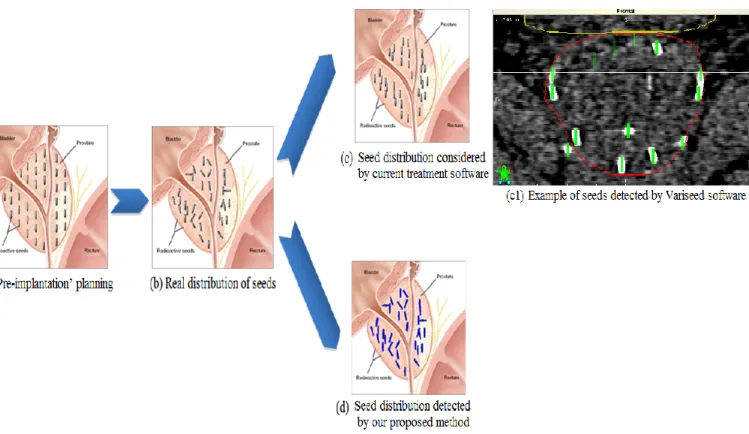
ROSTATE cancer is one of the leading cancers in men worldwide with 152 new cases and 23 deaths per 100,000 men reported worldwide per year from 2006-2010 (based on SEER Cancer Statistics Review) [1]. Low-risk prostate brachytherapy treatment that uses low dose rate radioactive seeds, has emerged as a common and highly effective method to manage localized prostate cancer. The typical implantation procedure is summarized as follows (see Figure 1): based on dose planning, lines of seeds (stranded or loose) are implanted through parallel needles. These needles are inserted into the prostate through the skin of the perineum using continuous transrectal ultrasound (US) guidance and following a pre-implantation planning. Once accurate needle placement has been confirmed, the seeds are released through the needles. This process is continued until all seeds have been implanted. In practice, the number of seeds implanted in the prostate commonly ranges from 40 to 100. The goal of a successful operation is to position the seeds in order to get the proper
1 The authors are with TIMC-IMAG laboratory, UJF-Grenoble 1 / CNRS /
TIMC-IMAG UMR 5525, Grenoble, F-38041, France. Email:
first_name.last_name@imag.fr
dose coverage throughout the prostate while limiting the risk for the neighboring organs.
In theory, the seeds are aligned in the needle insertion direction. Figure 2.a illustrates such a planning scheme. However, in practice the seed implantation depends on many biomechanical factors as well as human experience. The seeds may lose their intended position in spite of any special care or effort used when placing the needles and delivering the seeds (Figure 2.b). The examination of images (CT, X-ray, US or MRI) often shows that the seeds are not aligned in the implantation direction especially when using loose seeds. In this later case, the implantation may also result in groups of closely spaced seeds. In this paper, we name such a group a union-seed. Figure 3 shows an example of seed organization in a single CT slice (including one union-seed). In addition, some seeds can migrate out of the prostate as reported in Gao et al. [2].
Figure 1. Prostate brachytherapy implant technique (source http://www.prostatespecialist.co.uk)
For treatment quality assessment, fluoroscopic images can be acquired immediately after seed implantation. But generally CT data are also acquired one month after the intervention and a CT-based post-implant dosimetry is performed. The delay is such that any inflammatory modification of the prostate has disappeared and the dose computed from the seed positions can be considered as the real delivered dose. Most existing commercial treatment planning software (e.g. VariSeed, Interplant or PSID Brachytherapy software [4]) work under the assumption that all seeds are aligned with the CT axis (as shown in Figure 2.c). However, the American Association of Physicists in Medicine recommends to determine the 3D dose distribution of brachytherapy seeds based on real seed positions and orientations [3]. A related clinical question is: “Does taking into account real seed orientation induce significant differences in dose distribution of brachytherapy treatment?”. The Dorgipro project we participate in aims to answer this question by comparing the distributed dose calculated using
Segmentation, separation and pose estimation of
prostate brachytherapy seeds in CT images
Huu-Giao Nguyen, Celine Fouard, and Jocelyne Troccaz
1standard brachytherapy software (which assumes that the orientation is the planned orientation) to dose distribution obtained when considering the 3D real seed orientation. This paper focuses on the imaging aspects of this research project. The medical physics aspects are described in a companion paper and will be briefly summarized in section V of this paper.
This paper presents the image processing method used to extract the seed positions and orientations, i.e. five parameters (due to the cylindrical shape of the seeds). Our objective is thus to develop a fully automatic software that is able to detect seeds, separate groups of seeds – this stage is also referred to
as declustering in the literature – and accurately determine the 5D pose of seeds. In this study, we exploit the high intensity appearance of radioactive seeds in CT images for a solution based on threshold and connected component segmentation [5]; we also consider volume information for outlier removal and computation of the number of seeds in a union-seed. Three declustering methods are considered for union-seed separation: the k-means based method [7] and a modified version of it and the Gaussian mixture model (GMM) with an Expectation-Maximization (EM) algorithm [8]. Finally, the PCA method [6] for orientation estimation is applied. Reference data coming from the manual segmentation of seeds are used to validate the proposed method.
This paper is organized as follows. We begin by examining the state-of-the-art in prostate brachytherapy seed detection in medical images in Section II. In Section III, we present the proposed solution for seed segmentation (in III.A), union-seed separation (in III.B) and orientation estimation (in III.C) of the prostate brachytherapy seeds in CT images. Experiments and evaluation are reported for datasets generated from phantoms and 14 anonymous patients in Section IV. We then discuss the main contributions and potential extensions of the proposed approach in Section V.
II. RELATED WORK
The accurate localization and orientation estimation of brachytherapy seeds, including the ability to separate union-seeds, is a major challenge and active research field.
Figure 2. Seed distribution in prostate brachytherapy: (a) Seeds aligned with the insertion direction as defined in the planning (from http://cancer.uc.edu/cancerinfo/TypesOfCancer/ProstateCancer/InterstitialBrachtherapy.aspx); (b) Real distribution of seeds one month after the implantation; (c) and (c1) Seed distribution as handled by existing commercial software; (d) Seed distribution detected by the proposed method.
Figure 3. Example of implanted seeds as visible in a single slice of a CT image.
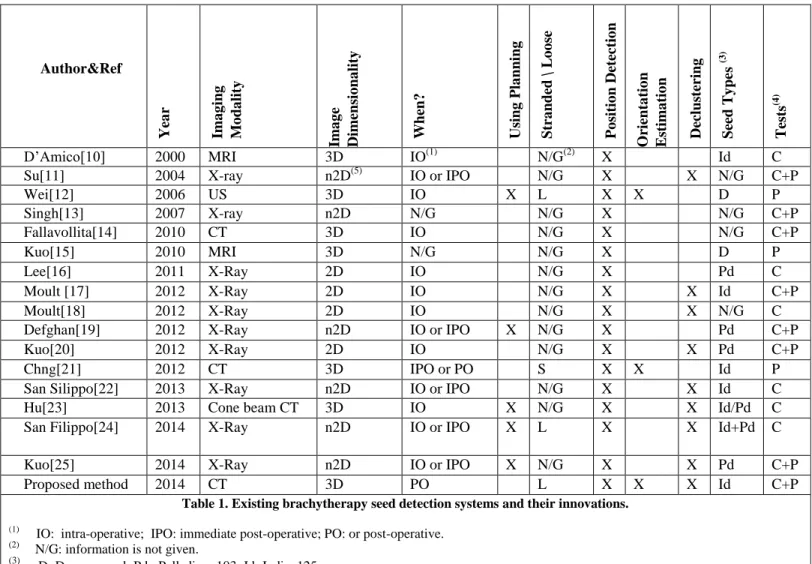
Numerous studies [9-25] have been published based on different prostate image modalities, including magnetic resonance (MR), ultrasound (US), X-ray and computed tomography (CT) images. As previously mentioned, determining seed positions is useful at different stages of the clinical protocol: during the implantation US and/or X-ray images are necessary for simply monitoring seed deposition or for intra-operative dynamic dosimetry [12,22,23,24] and iterative correction in case of inaccurate delivery; X-ray images are also used immediately after the implantation for recording purpose; finally, CT data is most often used after one month for dose evaluation. MRI can also be used post-operatively alone or in combination with CT. These modalities have different advantages and drawbacks: US is a non radiating modality as compared to X-ray but seeds are more difficult to detect in US due to resolution, noise and reflection artifacts. Whilst MRI is non radiating, CT is more often used for dosimetric planning and evaluation since it provides useful information about tissue radiological density. X-ray based modalities enhance seed visibility while US or MRI improve the visibility of the prostate and other soft tissue. Clusters of seeds visible in the images may arise either from an inaccurate delivery of loose seeds or from an
occlusion of stranded seeds in X-ray projections. These specificities have given birth to a very large collection of methods. Whilst our approach is for the detection of loose seeds in CT post-operative images we give a brief overview of some of the developed methods, with a summary in Table 1. They are classified according to different properties:
- the three required abilities: segmentation, 3D orientation estimation and declustering,
- the imaging modalities and dimensionality,
- when they are used (intra-operative IO, immediate post-operative IPO or post-operative PO),
- whether or not they use the planning information, - the type of seeds (stranded or loose – Palladium or
Iodine)
- and how they were evaluated (phantom study, clinical study).
Note that Table 1 does not contain data about commercial software as there is very little information available, they effectively work as „black boxes‟. To the best of our knowledge no commerical software provides capabilities similar to the one described in this paper.
Recent advances in X-ray images have been reported for position detection and declustering of prostate seeds: for
Author&Ref Yea r Ima g ing M o da lity Ima g e Dimen sio na lity When? Usi ng P la nn ing Str a nd ed \ L o o se P o sit io n Det ec tio n O rient a tio n E st ima tio n Dec lus ter ing Seed T y pe s (3) T ests (4) D‟Amico[10] 2000 MRI 3D IO(1) N/G(2) X Id C
Su[11] 2004 X-ray n2D(5) IO or IPO N/G X X N/G C+P
Wei[12] 2006 US 3D IO X L X X D P Singh[13] 2007 X-ray n2D N/G N/G X N/G C+P Fallavollita[14] 2010 CT 3D IO N/G X N/G C+P Kuo[15] 2010 MRI 3D N/G N/G X D P Lee[16] 2011 X-Ray 2D IO N/G X Pd C Moult [17] 2012 X-Ray 2D IO N/G X X Id C+P Moult[18] 2012 X-Ray 2D IO N/G X X N/G C
Defghan[19] 2012 X-Ray n2D IO or IPO X N/G X Pd C+P
Kuo[20] 2012 X-Ray 2D IO N/G X X Pd C+P
Chng[21] 2012 CT 3D IPO or PO S X X Id P
San Silippo[22] 2013 X-Ray n2D IO or IPO N/G X X Id C
Hu[23] 2013 Cone beam CT 3D IO X N/G X X Id/Pd C
San Filippo[24] 2014 X-Ray n2D IO or IPO X L X X Id+Pd C
Kuo[25] 2014 X-Ray n2D IO or IPO X N/G X X Pd C+P
Proposed method 2014 CT 3D PO L X X X Id C+P
Table 1. Existing brachytherapy seed detection systems and their innovations. (1)
IO: intra-operative; IPO: immediate post-operative; PO: or post-operative.
(2)
N/G: information is not given.
(3)
D: Dummy seed; Pd : Palladium 103; Id: Iodine125.
(4)
P: Phantom; C: Clinical data. (5)
example, the partition division on multiple projections of C-arm fluoroscopic images [11,16], the region-based segmentation implicit active contour model [17,18], the geometric analysis from the graph matching problem [13] or the mathematical morphology analysis [20]. However, these methods may require a sophisticated object-matching algorithm and/or calibration to deal with the substantial distortion of seeds in fluoroscopic images; moreover the orientation of seeds was not considered.
The other modalities, US and MRI, have also received a lot of attention in the last decade. For example, the appropriate location estimation of seeds in a target volume of real-time MR imaging [10] or in IRON images (Inversion-Recovery with On-Resonant Water Suppression) using the Laplacian of a Gaussian technique for blob detection [15] was considered. Wei et al.[12] segmented the seeds from the subtraction map between the background and post-implant US images and then applied a PCA method for orientation detection. Again, these methods do not manage union-seeds and the orientation of the seeds and their detection results are limited by the poor visualization of seeds in US and MR images.
Other approaches are based on the coregistration of different image modalities. For instance, a series of methods [14,19,22,24,25] propose a volume-to-volume and point-to-volume registration scheme of US images with the implants reconstructed from fluoroscopy. Recently, Hu et al. [23] considered the prior knowledge of the US-to-CT transformation via registration and the planning seed position to define an atlas of regions of interest for seed detection. Union-seed separation was considered, however there was no explicit mention concerning the management of seed orientations in these approaches.
Many papers consider stranded seeds whose real orientation is generally quite similar to the planned orientation, making it possible to search for lines of seeds close to the planned orientation. For instance, Chng et al. [21] estimated the seed orientations from the tangent vector to the curve of a seed strand identified in post-implant CT images at each seed position.
Because loose seeds enable the clinician to sculpt the dose to the precise treatment constraints, our objective was to develop a method allowing the use of these loose seeds. Thus, this study addresses the development of an automatic image processing solution for the segmentation, localization and orientation estimation of prostate seeds. Figure 2.d shows an
illustration of the expected result of the proposed method for the detection of seed poses in the prostate from the analysis of CT scanner images.
III. METHODS
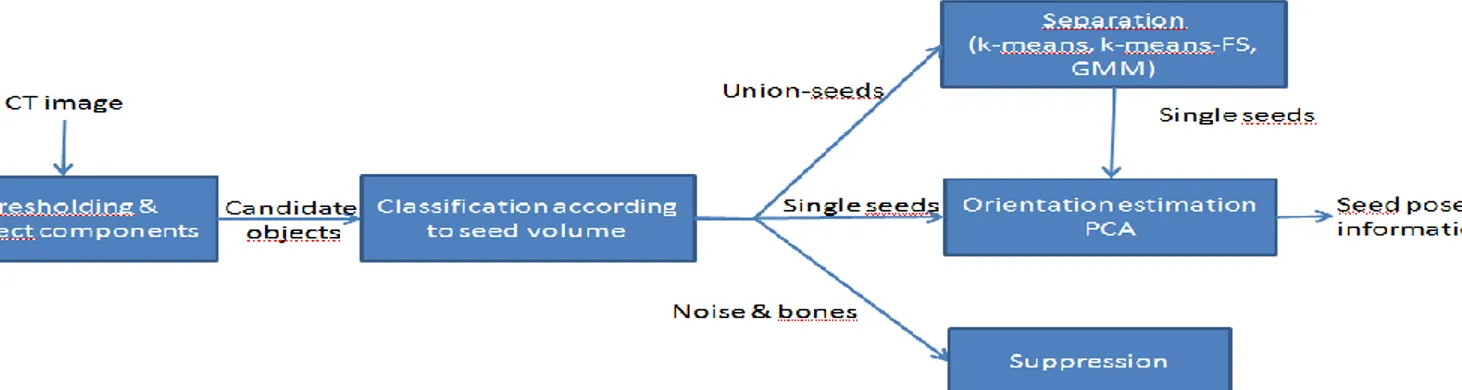
Figure 4 shows a sketch of the proposed approach. The different steps of this method are further detailed in the following sections, including:
3D object segmentation and classification for the detection of a set of seeds (single and union-seeds) in section A.
Union-seeds separation in section B.
3D orientation estimation in section C.
A. Seed segmentation using the connected object labeling method and seed classification using the k-means method
This sub-section details the detection of a set of seed candidates and their classification into three groups (outliers, single seeds and union-seeds) – see Figure 5. Brachytherapy seeds are small metallic cylinders (typically about 1mm diameter for 5mm length) and appear as high intensity objects. They may produce local artifacts obscuring neighboring tissues. Numerous methods have been developed to segment such small objects in a gray level image including some region-based methods such as watershed transformation [26, 27] and level sets [28, 29]. However these methods require user input by positioning initial seeds or shapes. We choose to use a priori knowledge about Hounsfield values in CT images [30], as well as volume information about the seeds in order to limit user interaction.
For instance, the voxel intensities of each type of material in the CT images processed in this study are [min, 400] for phantom material and for patient soft tissues, [0, 1350] for bones and [500, max] for seeds. Here, a threshold-based segmentation method, namely connected component labeling [5] with only an intensity threshold parameter t, is considered to exploit this information for the detection of individual objects in the images. We first threshold the original volume with the threshold parameter t, then each connected component (using 26-connectivity) is assigned a label i and ordered by its size. The location of each component is determined as its center of mass ci.
Figure 5. The detail of seed segmentation and classification step.
It is evident that the choice of the intensity threshold t is a key issue. It can be heuristically set based on the image characteristics and on the physical characteristics of the X-ray absorption of the seeds (see section IV). Moreover, the proposed method minimizes its influence on the results. Indeed, as the choice of the threshold affects the volume of the obtained connected component, no absolute volume is used, but the relative volumes of the components are compared to each other. Figure 6 shows an example of connected components detected in the CT image of a patient, for a given threshold. The detected objects in CT images of patients are divided into 4 types, including: single seeds, union-seeds, bones and noise.
Comparing the volumes of the detected components to the real volume of the seeds allows the first coarse classification of the objects detected in the images. Let us denote by Vreal=r2l the real volume of a radioactive seed, where r is the
radius and l the length of seed. The next step aims at suppressing large and small objects as compared to Vreal. In
practice, the pelvic bones are very large components (with volumes more than 100 times larger than the real volume Vreal). Conversely, noise is composed of tiny components
(with volumes smaller than a third of Vreal). The other
components are kept as candidate seeds with two types: single seeds and union-seeds. In practice up to 4 or 5 seeds can be included in a union-seed; however generally only two seeds
are grouped. Determining the number of seeds in a union-seed requires an estimation of the seed volume observed in the CT exam; this volume clearly depends on the threshold t.
Without loss of generality, we can assume that single seeds outnumber union-seeds in the remaining candidates (connected components). Indeed, even if union-seeds often appear in loose seed insertions, despite care taken by the clinician, they remain exceptions and most seeds are placed with a reasonable distance between them. We thus investigated the use of an unsupervised partitioning method, k-means clustering [7] to separate the candidate seeds into k groups based on volume analysis. As mentioned, most detected components correspond to the cluster of single seeds; we therefore decided to add two other clusters for smaller (if any) and larger objects (in particular including unions seeds); thus, we set k=3. Figure 7 shows an example of k-means clustering on the volume of seed candidates detected in the CT image of a real patient with 85 radioactive seeds implanted.
Figure 7: Example of the result of the k-means method applied to the volume histogram of connected components detected in CT13 image (see section III). 66 components are assigned to 3 clusters (represented by blue, green, red circle points). The red square points correspond to the mean volume of each cluster. Here, the largest cluster with 54 members is considered as the cluster of single seeds.
Figure 6. Example of connected component detection in a 3D CT image with 190 objects obtained using an intensity threshold of 700.
The detail of the general k-means method is as follows: we first randomly select k points as the initial cluster centroids. Then, each candidate is assigned to the closest centroid of k clusters based on volume information. We iterate this process until stability is reached. The k-means algorithm shows its computational simplicity in many classification applications. However, the resulting clusters strongly depend on the selection of the initial centroids. To improve the classification of seeds, the three initial centroids of clusters are defined as: the minimum, mean and maximum volume of the detected candidate components. At the end of the process, the largest cluster is selected as the set of single seeds with average volume Vmean computed from the cluster. This value of Vmean
is considered as the observed volume of a seed in the image given by the threshold t. This is a very important element to make the method more robust with respect to the choice of t. The final classification of the components is based on the comparison of their volume to Vmean. The number of seeds
corresponding to each candidate is calculated (rounded to the nearest integer value) as follows:
ns = Vcomponent / Vmean (1)
where Vcomponent is the volume of the candidate component.
At the end of this process, components are classified as follows:
- ns=0: the component is considered as an outlier and
removed;
- ns=1: the component is considered as a single seed;
- ns>1: the component is considered as a union-seed
composed of ns seeds.
Declustering the union-seeds will be necessary before pose determination; it will be presented in the next section.
B. Union-seed separation
Figure 8. The detail of union-seed separation step.
Considering the set of voxels of each union-seed detected by the connected component labeling and the number of
seeds ns grouped in this union-seed (Equation 1), this second
step aims at separating union-seeds using three unsupervised learning procedures : a means, a modified version named k-means-FS and a Gaussian mixture model method. Figure 8 shows the detail of this step. These three methods enable handling cases that none alone can treat properly. The k-means clustering method is again used for the voxel locations of each union-seed to separate it. Here, k is given for each union-seed by the computed number ns (in Equation 1) and
the method groups voxels based on their proximity in terms of position. However, the resulting seed clusters of k-means also depend on the selection of the initial centroids and on the size and shape differences between the regions shared in the clusters. In practice, the separation of a straight union-seed (see Figure 9.a) is easily achieved by this classical k-mean method. In contrast, the inaccuracies of this method occur when trying to separate groups of parallel seeds (see Figure 9.b) or groups of 4 or 5 seeds that are closely spaced (see Figure 9.c). Hence, we introduce two other methods to improve the separation of union-seeds. The first method consists in choosing the initial cluster of the k-means algorithm by exploiting the orientation information given by the PCA method (denoted k-means-For-Seeds); it is intended to more robustly separate groups of parallel seeds. The second method makes use of the Gaussian mixture model with the EM algorithm [8] for better processing of complex groups of seeds.
1) Introducing the k-means-For-Seeds method
We define the k-means-For-Seeds (k-means-FS) method as follows: first, two main directions {v1,v2} of the union-seeds
are estimated using the PCA method (see in IIIC). Then, (ns-1)
Figure 9. Seed separation. A case where the standard k-means algorithm works well (a) and two more difficult cases: (b) k-means-For-Seeds method with the choice of the initial centroid to improve the clustering performance of k-means, where the red point are the centroids of the k partitions, x is the centroid of the union-seed, the dotted-lines are used to determine the k-1 parallel planes w.r.t. the distance d= λ2/k. (c) Separation result obtained using the GMM with
parallel planes are defined by the main direction v1 of the
union-seeds and the distance d=λ2/ns between them (Figure
9.b), where λ2 is the second eigenvalue of the covariance
matrix C of the union-seed. These parallel planes divide the union-seed space into ns partitions. Finally, we apply the
k-means clustering algorithm with the initial cluster centers that are the centroids of these ns partitions. In practice, this method
presents its strength in solving the problem of parallel seeds. Figure 10 shows an example of the application of the basic k-means and k-k-means-FS for a parallel union-seed separation. Note that the seeds displayed in Figure 10 and Figure 11 are the results with their pose information estimated using thePCA method.
2) Using the Gaussian mixture model and the EM algorithm In some cases, the k-means-FS method does not give optimal results; thus we also consider a Gaussian mixture model (GMM) in order to improve the clustering of complicated union-seeds containing 4 or 5 seeds (Figure 9.c). Each cluster of the GMM is generated by initially choosing a cluster and then drawing from that cluster‟s Gaussian distribution (with means μ and covariance C ). The probability given in a mixture of k Gaussians is given by:
𝑝 𝑥 = 𝑘𝑖=1𝑤𝑖 𝑁(𝑥|𝜇𝑖, 𝐶𝑖) (2)
where w is the prior probability (weight) of the ith Gaussian, 𝑤𝑖
𝑘
𝑖=1 = 1 and 0 ≤ 𝑤𝑖 ≤ 1. The parameters θ={wi,μi,Ci} of
the ith Gaussian component are learned by the maximum likelihood estimation. The log likelihood function takes the form:
ln 𝑝 𝑋 𝑤, 𝜇, 𝐶 = 𝑁𝑗 =1ln 𝑘𝑖=1𝑤𝑖 𝑁 𝑥𝑗 𝜇𝑖, 𝐶𝑖 = 𝐿(𝜃|𝑋) (3)
In this maximum likelihood problem, we try to find a set of parameters θ that maximizes L(θ|X) using the standard Expectation-Maximization (EM) algorithm [8]. This algorithm works as follows: we initialize an estimation of a set of Gaussian parameters θ. Here, the means μi are obtained
by the k-means algorithm, the covariance matrices Ci are
calculated from the distance to the nearest cluster of k-means and all Gaussian weights wi are equally likely. At each
iteration of the EM algorithm, we compute the expected values of the unknown data given the observed data and the current model parameters in the expectation (E) step. The maximization (M) step involves optimizing and updating the parameters to be those with maximum likelihood. It can be
shown that the log-likelihood was improved at each such iteration. This process is stopped if a local maximum has been reached or some stopping criterion is met, e.g. the default number of iterations. Figure 11 shows an example of the seed separation improvement using the GMM method compared to the k-mean based method when applied to a complex union-seed with 4 closely spaced union-seeds.
3) Selection of the best separation method
In order to achieve robustness, for each union-seed, we run each of the three methods: the classical k-mean method with different random selections of the initial centroid clusters, the k-means-For-Seeds method and the GMM with EM algorithm. For each of the methods, the cylindrical shapes corresponding to the model of the seeds are positioned as computed. For each solution, the sum of the number of voxels common between these cylindrical shapes and the union-seed detected in the image is calculated. The solution with the largest common volume is selected as the best one.
In our clinical experiments reported in Table 4 of section IV.C, 116 union-seeds in 14 patients were achieved. Among them the best solution was found for 30 cases (25,9%) using the k-means-For-Seeds method, 18 cases (15,5%) using the GMM method and 68 other cases (58,6%) using the classical k-means method.
The obtained single seeds are then processed in order to compute their orientation as described in section III.C. C. Orientation estimation using the PCA method
In this third step, we aim to estimate the orientation of each 3D object detected by the connected component labeling or union-seeds declustering. Numerous approaches have been proposed to estimate the 3D object orientation in point clouds. Among the most popular, the 3D Hough transform [31-33] focuses on the definition of the 3-dimensional Hough Space of each point (see Figure 12.a). The computational complexity is a major drawback of the Hough transform approximated by O(sp-1n), where n is the number of points, p is the number of parameters and s is the number of samples along one Hough
Figure 10. Example of the separation result for a parallel union-seed (detected voxels visualized in blue) with two methods: classical k-means (yellow cylinders) and k-k-means-FS (cyan cylinders). In this case, the best solution is achieved using k-means-FS.
Figure 11. Separation result of a union-seed with 4 closely spaced seeds using 2 methods: k-mean-FS (yellow cylinders) and GMM with the EM algorithm (cyan cylinders). The original detected union-seed voxels are visualized in red. In this case, the best solution is given by the GMM and EM algorithm.
dimension. Another category of 3D orientation estimation is based on finding minimal enclosing boxes [34,35]. Approximate minimum-volume bounding box methods (see Figure 12.b) were shown to be particularly efficient with a complexity of O(n+1/ε4.5) compared to the Hough transform approaches, where ε is the approximation parameter. Such minimum bounding box models are however not well-suited to our problem because they require a heuristic parameter ε for grid search of the bounding box. This parameter ε has no physical meaning related to the CT image acquisition.
In this work, we focused on a solution for 3D orientation estimation that would improve both aspects, by investigating the Principal Components Analysis (PCA) method [6]. The PCA method is the simplest and most robust mathematical procedure for compressing and extracting the description of a set of correlated observations by rejecting low variance features. Considering p-dimensional feature vectors (in our case, 3D), the PCA method is the projection of this data onto q principal components. The first principal component v1 is
the feature space along which projections have the largest eigenvalue λ1 of the covariance matrix C of the point cloud.
This is chosen as the orientation of the object (Figure 12.c). The second principal component v2 is the direction which
maximizes the variance among all directions orthogonal to the first one. The second direction v2 is exploited for the
separation step of union-seeds.
Figure 12: Different approaches for 3D orientation estimation of a 3D cloud of points: (a) Hough transform (image is taken from [33]). (b) Minimal bounding box. (c) Principal Components Analysis.
III. EXPERIMENTS AND EVALUATION
A. Experimental setup
As mentioned in Section II, various methods have been developed for different types of seeds. In Europe, the most
frequently used isotope for permanent prostate seed implantation is iodine-125 (see the edition 2011 of Radiotherapy in Practice –Brachytherapy [36]). That is why we focused on such type of seeds. The validation of the proposed method, described in this section, was done using CT images of brachytherapy seeds implanted into: 1) two specially created phantoms and 2) data from 14 real patients provided by the Grenoble University Hospital.
1) Radioactive iodine-125 seed.
The clinical team of the Grenoble University Hospital uses BEBIG IsoSeed®I-125 seeds. A seed is made of a cylindrical-shaped ceramic material, saturated with radioactive iodine-125 compound and a gold marker located in the center, all enclosed by a laser-sealed titanium tube. The outer physical dimensions of the seed are l=4.5±0.2mm length and r=0.4±0.02mm external radius. The iodine-125 isotope emits photons at a maximum energy of 35keV and has a half-life of 59.46 days. This information is provided by the manufacturer [37]. Note that, the iodine-125 was taken off for the case of phantom to avoid the risk of radioactive contamination. 2) CT Images
The 3D CT images were obtained using a GE Lightspeed RT16 scanner with the default X-ray tube parameters:120kVp, 380-440mA.s. The slice thickness was 0.625mm with 16 frames/sec for each slice. The image reconstruction matrices were 512x512 archived in DICOM 3.0 format with 16-bit gray-level intensities. These acquisition parameters were experimentally determined by the radiophysicists using phantoms so that the seeds could be seen on 3 to 5 slices [39]. 3) Evaluation
In this paper, the evaluation of the proposed approach is given in three terms: location and orientation detection performance and calculation time. A fully automatic software based on the proposed solution was built on the open-source framework CamiTK [38] (using C++ with VTK and ITK libraries). This software also provides some post-processing tools to verify seed by seed in case of errors or inaccuracy. The user can modify the seed position to better fit the image data; this manually edited seed location is the reference information to which the automatic detection is compared.
For this, we used the Euclidean distance between their centroids c and cref and the dot product of their orientation
vectors v and vref (Equation 4).
Δ𝑑 = (𝑐3𝑖=1 𝑖− 𝑐𝑖𝑟𝑒𝑓)2, Δ𝜃 = acos 𝑣.𝑣𝑟𝑒𝑓
𝑣 𝑣𝑟𝑒𝑓 (4)
where ||vi|| is the magnitude of the vector vi, the unit of
distance Δd is expressed in mm, and Δθ is in degrees. Here, the time evaluation is on a computer of 3.4GHz Intel Core i7-2600 CPU.
B. Phantoms
The radiophysicists of the clinical team created two phantoms (see Figure 13) wherein the seeds were precisely positioned with different orientations on the surface of the slab. Both phantoms had the same physical dimensions of 9x9x0.5cm3. The reference position of the seeds in the phantom based on manual detection was also provided for
each case.
Figure 13. Water equivalent phantoms: (a) a single seed in a slab phantom (cf. section III.B.1); (b) seeds located on the surface of the central slab of the other phantom (cf. section III.B.2)
1) Single seed in a slab phantom
The first phantom (cf. Figure 13.a) that we considered had a single seed located in certain “pre-defined” orientations to evaluate the pose detection of the proposed method. The 3D image size of this phantom is 512x512x41 and the voxel size is 0.199x0.199x0.625. We created 11 orientation cases for this phantom. Figure 14 illustrates the different orientations of the seeds positioned in this phantom.
0o 10o 20o 30o 40o 45o 50o 60o 70o 80o 90o Ref. 0.12 9.65 20.72 30.1 39.8 45.2 49.8 60.8 69.1 79.4 90.2 Δθ0 0.20 0.83 0.54 0.76 0.54 0.63 0.65 0.71 1.69 0.70 0.51 Δdmm 0.02 0.08 0.14 0.18 0.12 0.10 0.14 0.20 0.26 0.16 0.06
Table 2. The details of the orientation differences Δθ and distances
Δd between the detected pose of the seeds and their reference value for t=1500 (in degrees and millimeters).
Figure 14. Detection of a seed with different orientations. The overlaid curves are the detected contours for different intensity thresholds.
Table 2 shows the values of the reference orientations and the comparison between the results of the proposed method and the reference with respect to orientation Δθ and distance Δd when using an intensity threshold of t=1500. With this value, the greatest Δθ orientation error of 1.69o is observed for the case (i) (for about 70°) and the other cases are equal to or smaller than 0.83o. The best detection was obtained with the reference orientation close to 0° (seed perpendicular to the CT acquisition plane) where Δθ=0.2° and Δd =0.02mm.
Additionally, to investigate the dependency of the proposed method to the choice of t, we also ran this experiment with 10 choices of t in an interval of [800, 1700]. The mean value and the standard deviation of the orientation error are Δθ=0.96°±0.4. The mean value and standard deviation of the distance error are Δd=0.08±0.04 mm).
2) Multiple seeds in a multi-slab phantom
We also report a second experiment about the detection of 73 seeds implanted in a more complex phantom composed of 9 slabs (Plastic water®-LR, Medi-Test, Saclay, France). The placements of the seeds look more similar to what could be a real implantation for a patient. Nine same size slabs are pressed together by 4 screws. Holes were drilled into the slabs to place the radioactive seeds in different orientations. Figure 13.b shows the design of the central slab of the phantom. The 3D image size of this phantom is 512x512x73 and the voxel size is 0.217x0.217x0.625 mm3. In this experiment, we have tested the proposed method with 10 choices of t in the interval of [800, 1700]. Figure 15 shows the distribution of the 73 seeds detected in a CT image when using the intensity threshold t=1500.
Compared to the reference data, the mean and standard deviation of the orientation error are Δθ=1.32°±0.9; the mean and standard deviation of the position error is Δd=0.13±0.07mm for 10 choices of the intensity threshold t. Some seeds are perfectly located (Δθ=0°, Δd=0mm), e.g., the seeds positioned vertically in the central slab when using an intensity threshold of t=1500. In contrast, the most inaccurate detections were found for the oblique seeds, where Δθ=1.8° and Δd=0.65mm.
C. Patient experiment
We report 14 cases of radioactive seed detection on real patient images. The CT scanner images were taken one month after the implantation procedure in the Grenoble University Hospital. Data were anonymized before export and processing. Table 4 details the information of the scanner images and the number of seeds implanted in the planning of the brachytherapy treatment. It should be reminded that, some seeds may migrate, therefore the number of detected seeds may be different even if perfectly successful.
Figure 15. 3D CT scanner image of the second phantom and the distribution of the 73 seeds: theoretical positions of seeds are painted in green and detected seeds are in red.
In this experiment, we ran the proposed method with different values of the intensity threshold t for all 14 patient
cases. Again, the choice of the intensity threshold t was based on the HU values of each material in the CT images: in these data, soft tissues were in the range [min,400], bones were in [0,1350] and seeds were in [500,max]. We considered the intensity threshold in the interval of [1350,2000] with a step of 100 (beginning with 1400).
Seed detection errors, which we will call “false detections” (FD), can be classified into three categories as follows:
* FD1: the undetected seeds because of their migration out of the imaged region or because of the limitations of the method (false negative).
* FD2: the noisy objects detected in image such as calcifications that can be recognized as potential seeds if their intensity and volume are compatible with the seeds or union-seeds characteristics (false positive).
* FD3: correspond to the errors due to the incorrect separation of union seeds; that may be due to a wrong estimated number of seeds.
The sum of all types of false detections, when using the proposed method with different values of the intensity threshold t in the range [1350,2000], is plotted in Figure 16. Here, the best results were obtained with the thresholds t=1500 or 1600 where the sum of false detections (FD) are minimum for all 14 patient cases. When a low threshold t (e.g., t=1350) is chosen FD2 increases with extra noise. In contrast, the number of wrongly separated seeds (FD3) is bigger when a high threshold t (e.g. t=1900) is used; this is because of the loss of shape information of the seeds. The total number of false detections, summed from the 14 cases, for each choice of threshold t is given in Table 3.
From this experimental result, we suggest choosing the intensity threshold in Hounsfield Units in [1500,1700], for which the radioactive seeds can be most successfully separated from the other material.
Table 4 details the results obtained for the 14 prostate cases using the proposed method with an intensity threshold of t=1500. Compared to the reference data, the maximum (respectively minimum) orientation error Δθ is 3.180°±0.9 (resp. 0.680°±0.2) and the maximum (resp. minimum) distance error Δd is 0.50±0.16mm (resp. 0.15±0.09mm). The number of false detections is also reported in detail for each case. Compared to the number of implanted seeds, 8 seeds in total could not be found (FD1) in CT3, CT5, CT7, CT8 and CT9 images. Some existing objects of FD2 type were also detected in CT3 (cf. Figure 17), CT5, CT7, CT10 and CT11. Considering FD3 false detections (wrong union-seed separation), two groups of 4 real implanted seeds were detected as union-seed of 5 seeds; this occurs in CT3 and CT5 images.
Figure 18 also shows the detail of each type of false detection for a single patient (CT14) and for different values of the threshold t. The mean calculation time of the proposed method was 9.7s over 126 runs for 14 patient cases with different intensity thresholds t. It is therefore a very fast solution when compared to the half day that was required for the careful manual segmentation of the reference data or compared to the average 30 minutes for conventional postprocessing of images treated by our clinical team after detection of seeds with their commercial system. Figure 19 shows some examples of the seeds detected in patients.
2 In this example a smaller ROI would have allowed to avoid such a false
detection ; however, we kept it because the visualization in this figure was easier than when false detections are in the middle of the other seeds.
Figure 16. Number of false detections obtained for the different choices of the intensity threshold t for the 14 cases.
t 1350 1400 1500 1600 1700 1800 1900 2000
∑FD /total
3.4% 2.6% 1.8% 1.8% 2% 2.7% 3.5% 4.8%
Table 3. Cumulated number of false detections for the 14 cases as a function of threshold value t. Here, the total number of implanted seeds is 1063 for 14 cases.
Figure 17. Example of FD2 false detection in CT3 with t=1500 (cyan cylinder at the top of the image) 2.
IV. DISCUSSION
In this study, an efficient and fast approach for the pose estimation of brachytherapy seeds in CT images has been presented. The key methods used in this work may be summarized as follows:
Classification of detected objects based on a priori intensity and volume information
Estimation of 3D objects based on the extraction of principal components.
Separation of groups of seeds using k-means, a modified k-means clustering method and GMM method with an EM algorithm.
Individual seed orientation estimation using the PCA method.
The results herein were quickly obtained with only small differences compared to the reference data for both phantoms and patients. For example, the proposed method achieves the orientation error Δθ=0.96°±0.4, the distance error Δd=0.08±0.04 mm and the calculation time 0.67s±0.3 for a phantom in section IV.B.1. These evaluation values can be compared to Δθ=2°, Δd=0.3mm and calculation time 9s of a previous related work for CT images (Chng's method [21]). This comparison in terms of detection performance and calculation time pointed out the relevance of our contributions. However these comparisons must be interpreted
carefully since the phantoms and computer systems were different.
In clinical practice, the role of the human operator can be limited to a verification task and modifications for misdetections if any. In fact, the migrated seeds (false detection type: FD1) always lead to a significant uncertainty in the post-implant dosimetry calculation. The proposed method described in this paper works without the prior knowledge about the number of implanted seeds. Therefore finding less seeds than expected by the planning should warn the operator about possible migration or misdetections. On the other hand, the false positive detections (FD2) are often due to calcifications very frequent in the prostate gland of men with benign prostatic hypertrophy and prostate cancer. The distinction between calcifications and brachytherapy seeds may be still a challenging task even for a very skilled clinician. Thus, the verification by the clinician in this case is always necessary but may not be sufficient.
The advantage of the clustering approaches (k-means or GMM) used in this work for the separation of union-seeds is their small computational complexity compared to other approaches such as RANSAC [40] or Hough transform [33]. However, there was still a few false detections due to inappropriate seed separation (here, FD3): less than 0.19% (see Table 4). Therefore, a manual correction step may also be necessary. Some approaches based on the morphology analysis or 3D template matching could be considered in the future to improve the performance of this separation task. Overall of 1063 seeds implanted in 14 patient cases in Table 4, the false positive (FD2+FD3) percentage of our approach is 1.03%. This value is lower compared to the state-of-the-art methods reported in the Table 2 of the publication of San Filippo et al. [24], where Moult et al. [17] was 2.2%, San Filippo et al. [22,24] were 1.7%. These results open the door to accurate dose calculation and procedure quality assessment. As already mentioned in the introduction, a dosimetry study has been launched in parallel in our institution on a series of patients including the 14 patients of this paper [39]. Its aim is to evaluate the impact of accurate pose evaluation onto dose distribution for prostate brachytherapy treatment. It will be published separately but a few elements may be summarized
Figure 18. Number of false detections for different values of t for a patient example (CT14 case).
CT1 CT4 CT9 Figure 19. Examples of seed detections for three patients
here. Compared to the ideal axis of insertion, the seeds angular error are in average for the 1063 seeds of the 14 patients 0.81°±27.7 and 1.06°±21.1 in spherical coordinates. As concerns the Dose Volume Histograms no significant difference could be demonstrated between dose evaluation using or not orientation information but our number of patients was quite small. In a very recently published paper [41] concerning a study using 5 fluoroscopic images and a CT of 287 patients, the authors demonstrate small but significant dose difference evaluated on organs at risks. In our much more limited study we also exhibited significant local dose differences that could have a clinical impact. A more extensive clinical study is necessary to draw useful conclusions. In the context of this study which aim was to evaluate a new method, man-machine interaction has been restrained to what was strictly necessary. It is clear that the routine use of the approach would require special care for assisting the operator in the verification task, in particular we envision to orient his/her screening towards suspicious detections. Work remains to be done for scoring the detection. In future work, the potential of an automatic choice of an optimal intensity threshold will be further explored from the analysis of quantitative and geometric information of false detections. Robust solutions of seed localization for different prostate image modalities such as ultrasound or image registration for improved evaluation with respect to the anatomy of patient are also among the key issues that should be addressed.
V. CONCLUSION
This paper has presented an automatic, accurate, robust and fast approach for the automatic localization of brachytherapy loose Iodine-125 seeds in CT post-operative images. It was evaluated on phantom and patient data. The key originalities of this work lie in the ability to separate groups of seeds and to determine their orientation for improved evaluation of dose distribution to the patient. Based on intensity information and observed volume of the detected objects the method was able to accurate determine the 5D pose of seeds with very few false detections. Further work both concerns technical aspects and a larger clinical evaluation.
ACKNOWLEDGMENTS
This work is supported by grants from INSERM (Dorgipro project PC201114) and from ANR (CAMI labex ANR-11-LABX-0004).
The authors would like to thank Francois Meneu, Jean-Yves Giraud, Dr. Camille Verry and Pr. Michel Bolla from the Radiotherapy department, Grenoble University Hospital for providing their expertise and the clinical images used in this study. The authors also thank PhD. Cecilia Hughes and PhD. Nikolai Hungr for critically editing the manuscript.
Table 4. Detailed results for 14 CT scanner images of patients. The intensity threshold is t=1500. The minimum intensity value (in HU) over the 14 cases is -3024. The 3 types of false detections are mentioned. The detected seeds are classified as: single, group of two, three, four or five seeds. The false detection percentage is in the last line.
REFERENCES
[1] N. Howlader et al, “SEER Cancer Statistics Review, 1975-2010”, National Cancer Institute. Bethesda, MD based on November 2012 SEER data submission, 2013.
[2] M. Gao et al, “Effects of seed migration on post-implant dosimetry of prostate brachytherapy,” Medical Physics, vol. 34, pp. 471–481,2007.
[3] M. Rivard et al., “Update of aapm task group no. 43 report: A
revised aapm protocol for brachytherapy dose calculations,” Medical Physics, vol. 31(3), pp. 633–674, 2004.
[4] http://www.seedos.co.uk/dose_planning_equipment.htm
[5] L. Shapiro and G. C. Stockman, Computer Vision. Prentice Halls, pp. 69–73, 2002.
[6] I. T. Jolliffe, Principal Component Analysis. Springer, 2002.
[7] J. Han et al, “Data Mining: Concepts and Techniques.”, Morgan Kaufmann, 2011.
[8] A. Dempster and N. Rubin, “Maximum likelihood from
incomplete data via the em algorithm, Journal of the Royal Statistical Society B, vol. 39 (1), pp. 138, 1977.
[9] J. Corbett et al, “The effect of seed orientation deviations on the quality of 125i prostate implants,” Medical Physics, vol. 46, pp. 2785–2800, 2001.
[10] A. V. D‟Amico et al,”An image-guidance system for dynamic dosimetry in prostate brachytherapy using ultrasound and fluoroscopy”, Journal of Radiation Oncology Biology Physics, vol.14, pp.367–370, 2000.
[11] Y. Su et al, “Prostate brachytherapy seed localization by analysis of multiple projections: Identifying and addressing the seed overlap problem,”Medical Physics, vol. 31, pp. 1277–1287, 2004.
[12] Z. Wei et al,“Automated localization of implanted seeds in 3d trus images used for prostate brachytherapy,” Medical Physics, vol. 33(7), pp. 2404–2417, 2006.
[13] V. Singh et al, “Brachytherapy seed localization using geometric and linear programming techniques,” IEEE Transactions on medical imaging, vol. 26(9), pp.1291-1304, 2007.
[14] P. Fallavollita et al,”Registration between ultrasound and fluoroscopy or CT in prostate brachytherapy.”, Medical Physics, 37(6), pp. 2749-2760, 2010.
[15] N. Kuo et al, “Mri-based prostate brachytherapy seed localization,”IEEE International Symposium Biomedical Imaging, pp. 1397–1400, 2010.
[16] J. Lee et al, “Intraoperative 3D reconstruction of prostate brachytherapy implants with automatic pose correction, ”, Physics in medicine and biology, vol 56(15), pp. 5011-5027, 2011.
[17] E. Moult et al, “Segmentation of iodine brachytherapy implants in fluoroscopy.” International journal of computer assisted radiology and surgery, pp. 871-879, 2012.
[18] E. Moult et al, “Implicit active contours for automatic brachytherapy seed segmentation in fluoroscopy”. In SPIE
Medical Imaging ,pp. 831611-831611, 2012.
[19] E. Dehghan et al,” Ultrasound–fluoroscopy registration for prostate brachytherapy dosimetry.”, Medical Image Analysis, vol. 16(7), pp. 1347-1358, 2012.
[20] N. Kuo et al, “Automatic segmentation of radiographic fiducial and seeds from X-ray images in prostate brachytherapy.”, Medical Engineering and Physics, vol 34(1), pp. 64-77, 2012.
[21] N. Chng et al, “Prostate brachytherapy postimplant dosimetry: Seed orientation and the impact of dosimetric anisotropy in stranded implants,” Medical Physics, vol. 39, pp. 721–731, 2012.
[22] C.A. di San Filippo et al, “Declustering n-connected components for segmentation of iodine implants in C-arm
fluoroscopy images.” In Information Processing in Computer-Assisted Interventions, pp. 101-110, 2013.
[23] Y. Hu et al,”Fast radioactive seed localization in intraoperative cone beam CT for low-dose-rate prostate brachytherapy.”, Proc SPIE 8671, 2013.
[24] C.A. di San Filippo et al, “Intraoperative segmentation of iodine and palladium radioactive sources in C-arm images.” International journal of computer assisted radiology and surgery, pp. 1-8, 2014.
[25] N. Kuo et al, "An image-guidance system for dynamic dosimetry in prostate brachytherapy using ultrasound and fluoroscopy", Medical Physics, Vol. 41, No. 9, p. 091712, 2014.
[26] L. Vincent and P. Soille, “Watersheds in digital spaces: an
efficient algorithm based on immersion simulation,” IEEE Transactions on Pattern Analysis and Machine Intelligence, vol. 13, no. 6, pp.583–598, 1991.
[27] V. Grau et al, “Improved Watershed Transform for Medical Image Segmentation Using Prior Information”, IEEE Transactions on medical imaging, vol. 23(4), pp.447-458, 2004.
[28] S. Osher and N. Paragios, “Geometric Level Set Methods in
Imaging Vision and Graphics”. Springer Verlag, 2003.
[29] A. Tsai et al, “A Shape-Based Approach to the Segmentation of Medical Imagery Using Level Sets”, IEEE Transactions on medical imaging, vol. 22(2), pp.137-154, 2003.
[30] A.K. Robertson et al, “CT, MR, and ultrasound image artifacts from prostate brachytherapy seed implants: the impact of seed size.” Medical Physics, vol.39(4), pp. 2061-2068,2012.
[31] W. Qiu et al, “Needle segmentation using 3d hough transform in 3d trus guided prostate transperineal therapy,” Medical Physics, vol. 40,p. 042902, 2013.
[32] D. Borrmann et al, “The 3d hough transform forplane detection in point clouds: A review and a new accumulator design,” Journal 3D Research, vol. 2(2), 2011.
[33] F. Zana and J. C. Klein, “A Multimodal Registration Algorithm
of Eye Fundus Images Using Vessels Detection and Hough Transform”, IEEE Transactions on medical imaging, vol. 18(5), pp.419-428, 1999.
[34] M. Lahanas et al, “Optimized bounding boxes for three-dimensional treatment planning in brachytherapy,” Medical Physics, vol. 27, pp.2333–2342, 2000.
[35] J. O'Rourke, “Finding minimal enclosing boxes,” Journal of
Computer Information Sciences, vol.14, pp.183-199,1985. [36] P. Hoskin and C. Coyle, “Radiotherapy in
Practice-Brachytherapy”. Radiotherapy in Practice series. Oxford University Press, Oxford, 2011.
[37] IsoSeedI-125 (I25.S06) Instructions for Use, BEBIG company, 2002.
[38] C. Fouard et al, “CamiTK: a modular framework integrating visualization, image processing and biomechanical modeling,” Soft Tissue Biomechanical Modeling for Computer Assisted Surgery, pp. 323–354, 2012.
[39] F. Meneu et al, “Consideration of seeds orientation in prostate brachytherapy and dosimetric analysis”, Physica Medica, e33-e34, 2013.
[40] M. Moradi et al,” Needle path detection for brachytherapy
dosimetry based on lateral power imaging and template matching”, Ultrasonics Symposium, pp.1-4, 2009.
[41] C. Fekete et al, “Quantifying the effect of seed orientation in
postplanning dosimetry of low-dose-rate prostate brachytherapy” Medical Physics, vol. 41(10), 2014.


![Figure 12: Different approaches for 3D orientation estimation of a 3D cloud of points: (a) Hough transform (image is taken from [33])](https://thumb-eu.123doks.com/thumbv2/123doknet/14424367.513906/9.918.62.453.561.937/figure-different-approaches-orientation-estimation-points-hough-transform.webp)


