Comparing the Deflection of Different Colored Glass Strips
by
Or Oppenheimer
Submitted to the
Department of Mechanical Engineering
In Partial Fulfillment of the Requirements for the Degree of Bachelor of Science in Mechanical Engineering
at the
Massachusetts Institute of Technology
June 2018
0 2018 Or Oppenheimer. All rights reserved.
Signature of Author:
Signature redacted
if
Certified by:
Department of Mechanical Engineering May 18, 2014
Signature redacted
Signature redacted
Dr. Barbara Hug Senior Lectu Thesis Supervisor MASSACHUSETS INSTITUTE OF TECHNOLGYSEP
132018
Professor Rohit Karnik Professor of Mechanical Engineering Undergraduate Officer A, 0 -t: ~ t~ Accepted by:
Comparing the Deflection of Different Colored Glass Strips
by
Or Oppenheimer
Submitted to the Department of Mechanical Engineering on May 18, 2018 in Partial Fulfillment of the
Requirements for the Degree of
Course 2: Bachelor of Science in Mechanical Engineering
ABSTRACT
Glass is a material that has been used for both practical and artistic purposes starting as early as the 1s' century BC, and the stiffness of the glass affects how easy the glass is to work with. A
three-point bending test was performed at 582*C (1080*F) for strips of transparent red, clear, black, transparent blue, and white glass. The deflection of the center point of each strip of glass was measured as the temperature was held constant. A proportional relationship of deflection with time was found for the red and white glass and the deflection of the clear, black, and blue glass was characterized by a parabolic relation. It was found that the red glass is the least stiff, followed by black, blue and clear, which have no statistically significant difference in stiffness, and finally the white glass was found to be the most stiff. These were contrary to the glass workers expectations, which was that black would be the least stiff. This will help glass workers know which colors will act similarly, and what to expect of different colors of glass.
Thesis Supervisor: Dr. Barbara Hughey Title: Senior Lecturer
Table of Contents
Abstract 3
Table of Contents 4
List of Figures 5
1. Introduction 6
2. Material Properties of Glass 6
2.1 Molecular Structure of Glass 6
2.2 Viscosity of Glass 6
2.3 Colored Glass 8
3. Three Point Bending Test 8
4. Experimental Design 9
4.1 Experimental Setup 9
4.2 Determining the Testing Temperature 11
4.3 Experimental Methods 13
5. Results and Discussion 14
6. Conclusion 17
Acknowledgments 18
List of Figures
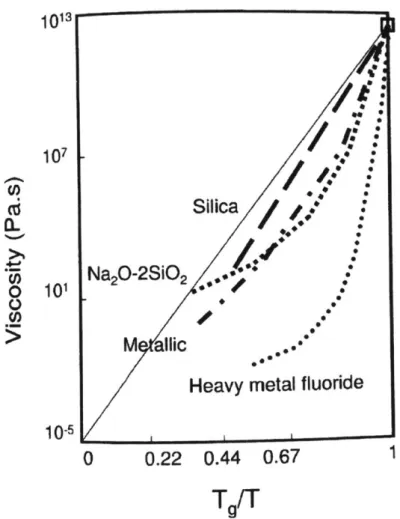
Figure 1: Viscosity vs. glassy temperature/temperature of different materials.
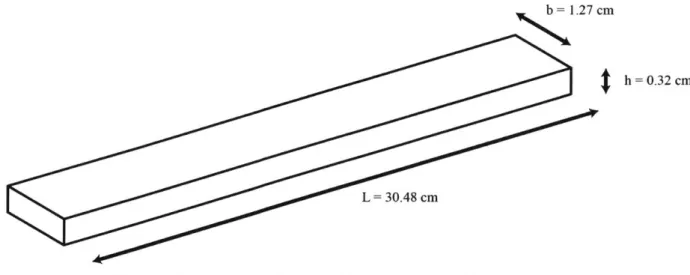
Figure 2: The dimensions of a single strip of glass used in this experiment.
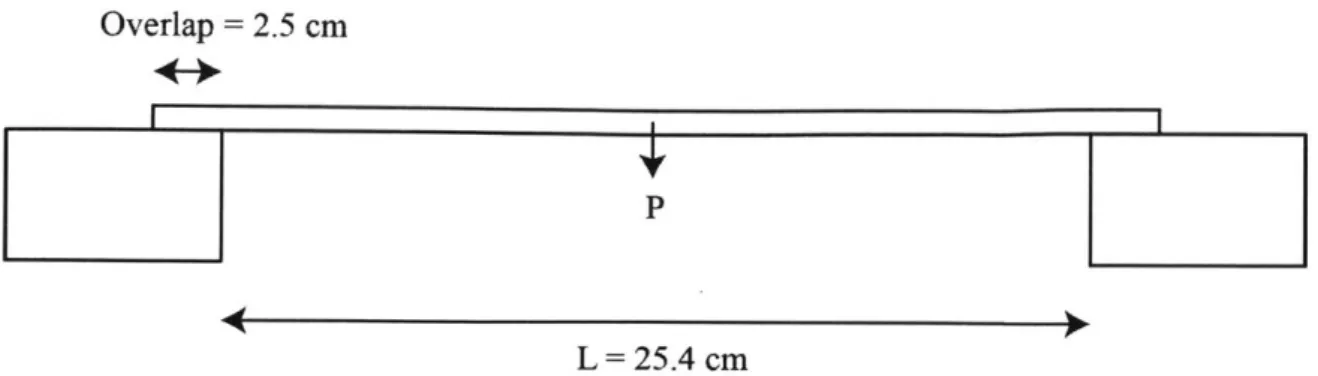
Figure 3: The setup of a single strip of glass in this experiment.
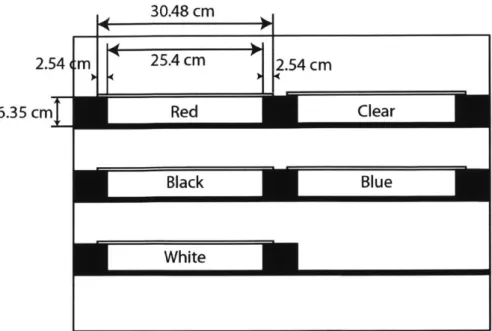
Figure 4: The setup inside the annealer.
Figure 5: An image after the glass has been in the annealer at 582'C (1080*F) for
40 min.
Figure 6: The temperature vs. time plot shows the program for the annealer for the
initial experiment.
Figure 7: The displacement of the center point of red and white glass strips at
varying temperatures.
Figure 8: The temperature in the annealer vs. time.
Figure 9: Deflection of the center point of five different colored glass strips at
582'C (1080'F) vs. time for a single experimental run.
Figure 10: Rate of deflection (absolute value of coefficient A) for the red and white
glass strips.
Figure 11: Bar graphs for the absolute values and uncertainties for the coefficients B
and C for the clear, black, and blue glass strips.
Figure 12: Deflection of the center point vs. time of the final models.
7 8 9 10 11 12 13 14 15 16 16 17
1. Introduction
Glass is a material that has been used for both practical and artistic purposes starting as early as the Ils century BC [1]. Even when glass is worked in an artistic setting, it is a very technical process, and having a complete understanding of how the glass responds at different temperatures is integral to producing the desired piece. Working with glass requires that it be melted in order to form into the desired shape while it is in a viscous state. Many glass workers can attest that different colors of glass behave differently at high temperatures, and refer to these as "soft" and "hard" colors. Soft colors heat up quickly and therefore move much sooner than hard colors, which take longer to heat up. Generally, glassworkers consider cool colors, such as blue, black, and purple to be soft colors, while warm colors such as red, orange, and white to be hard colors. To the author's knowledge, no experiment has been done to directly measure the stiffness of various glass colors.
When glassworkers describe a color as "soft," they mean that it moves quickly to form the shape that they desire, whereas a "hard" color takes longer to form the shape desired. These qualitative observations can be correlated to the viscosity of the color. A color with a higher viscosity will move more slowly, making it a "hard" color. A color with a lower viscosity will move more quickly, and thus will be a "soft" color. The "hard" and "soft" labels are correlated with stiffness because a color with higher viscosity will be stiffer [2].
To determine the dependence of stiffness on glass color, samples of five colors, all made from the same base glass, were studied: transparent red, clear, opaque black, transparent blue, and opaque white. A three-point bending test was performed by placing a thin strip of each color was between two bricks in an oven, then increasing the oven temperature and holding it constant at 582*C (1080*F). An image was taken every 20 minutes, and the deflection of the center point of each strip of glass was measured from the photographs. The deflection of the center point over time was used to determine the stiffness of each of the different colors of glass, allowing classification of the samples from "soft" to "hard".
2. Material Properties of Glass
2.1 Molecular Structure of Glass
Glass is an amorphous solid, meaning that unlike crystalline solids, the molecules are not arranged in a way that creates a repeatable structure in one direction but not he other [3]. In other words, the material has no "grain." An amorphous solid is isotropic, meaning that it responds to applied forces independent of direction. Stress applied in one direction, will cause the same response as if it is applied in another.
The amorphous structure of glass is ideal for glassworkers, because the direction of the grain does not need to be considered when working with the glass. If glass had a crystalline structure, it would respond differently to forces in different directions, resulting in a less predictable material. The amorphous structure of glass allows it to be shaped into many different forms, as it will uniformly stretch to form a shape [3].
2.2 Viscosity of Glass
Glass is a viscoplastic material. "Visco-" means that the response of material under load is time dependent and "-plastic" means that once glass is deformed, it will not return to its undeformed state unless acted on by an opposing load [4].
The viscosity of glass decreases with increasing temperature. At low temperatures, the viscosity of the glass is very high, and therefore it does not readily flow. At room temperature, glass is in fact not completely solid, and over very long periods of time, room temperature glass will move. This can be seen in the windows of old buildings. As the temperature of the glass increases, the viscosity decreases, making it easier for the glass to flow [4].
The viscosity of glass fits the Arrhenius temperature equation, Equation 1. The viscosity r1 is dependent on the temperature T, where G is the coefficient corresponding to the activation energy and r70 is the pre-exponential factor [3][4].
G
77(T) = JioeRiT
Viscosity curves for different materials computed with given in Figure 1 [3]. 107
I
(I) (L 0 101 10-5 (1)the Arrhenius temperature equation are
1
Tg/T
Figure 1: Viscosity vs. glassy temperature/temperature of different materials. The glassy temperature is the temperature at which the material is no longer considered a solid, and has begun to move into the liquid state
[3].
The annealing temperature of glass is defined as the temperature at which the viscosity is
10 1 Pa [3]. This viscosity value is chosen because empirically it is found to result in
negligible glass flow. Glass workers use this temperature to store the glass once they have
I
/
F
Silica
Na
2O-2SiO
2..
* .-M allicHeavy metal fluoride
0 0.22 0.44 0.67
finished forming it. If the glass is left at a temperature less than the annealing temperature, it will cool too quickly and crack. In order to efficiently use kiln space, the kiln is held at annealing temperature until it is full of glass objects, and then it is slowly brought down to room temperature. Kilns used for this purpose are called annealers, and are referred as such in this paper. For the System 96 glass used in this experiment, the annealing temperature is
5000C (9300F).
The working point of a glass is the temperature at which the viscosity is 10' Pa. At this temperature, the glass is easy to form into different shapes [3]. However, different types and colors of glass have varying viscosities at the same temperature, which makes mixing them difficult because they will not all be at the ideal working viscosity at the same temperature.
2.3 Colored Glass
The color of glass affects the viscosity by changing chemical composition of the glass and therefore the infrared absorption coefficient of the glass [5]. Glass color is caused by certain chemicals added into the glass that change the molecular makeup of the glass itself. The color of the glass affects the viscosity because it varies the amount of heat that is absorbed by the glass. This change in heat absorption causes the glass to either heat up faster or slower depending on color, causing the viscosity to differ from that for clear glass [5].
3. Three Point Bending Test
Strips of glass with dimensions shown in Figure 2 were laid across two bricks in order to perform a three point bending test, shown in Figure 3.
b= 1.27 cm
h = 0.32 cm
L = 30.48 cm
Overlap = 2.5 cm
P
L = 25.4 cm
Figure 3: The setup of a single strip of glass in this experiment. The strip of glass is laid on top of two bricks. Note that although the length of the glass is 30.48 cm (12 inches), the length of the beam is 25.4 cm (10 inches) because 2.54 cm (1 inch) of the glass sits on the bricks on each side.
Equation 2 gives the deflection 6 of the center point of a beam under a three point bending test. Because the deflection of the glass beam will change over time, 6 will be a function of time
[5].
PL?
p(t)
= (2)
48E(t)1
Where P is the load on the beam, which in this experiment is the weight of the glass due to gravity. L is the distance between the two bricks, and E(t) is the stiffness as a function of time. I is the moment of inertia of the beam, which for a beam with a rectangular cross section is given
by Equation 3.
I = 12bh3
(3)
Where b is the beam width and h is the beam height, as defined in Figure 2. Equations 3 and 4 allow the determination of the stiffness of each piece of glass from the known dimension and weight, and from the measured deflection, 6(t).
4. Experimental Design 4.1 Experimental Setup
All experiments were done in the same annealer, a Wet Dog Glass company glass heating
oven, model AF 16.1. Inside the annealer, three shelves were set up and three bricks were placed on each shelf. The strips of glass used for the experiment had dimensions of 0.32 cm (1/8-inch) thick, 1.27 cm (1/2-inch) wide, and 30.48 cm (12 inches) long and were placed on top of the bricks. The setup inside of the annealer is shown in Figure 4.
30.48 cm
2.54 m r 25.4 cm 2.54 cm
6.35 cm Red Clear
O = Black Blue
White
Figure 4: The setup inside the annealer. Five strips of glass were laid out on 6.35 cm (2.5 inches) tall bricks so that there was 25.4 cm (10 inches) between each brick. The location of each color of glass was kept consistent for each experiment. Starting from the top left, the order of the glass colors for each experiment was red, clear, black, blue, and white.
The temperature inside of the annealer was measured using type K thermocouples and a Digitry GB1 Programmable Temperature Controller was used to both program and record the temperature in the annealer. This temperature controller computes the average temperature in the annealer by averaging the readings of all 8 thermocouples. Therefore, some non-uniformity of temperature in the annealer is possible. In order to minimize the effects of temperature variation
in the annealer, all experiments were designed to maintain each temperature for 30 minutes to allow the annealer to come to the thermal equilibrium and therefore ensure that all glass samples reached the desired temperature.
The deflection of the center point of each glass strip was measured by photographing the inside of the annealer. This required that the doors of the annealer be opened momentarily, causing the temperature in the annealer to drop. To account for this sudden change in temperature, the countdown to the time when the next picture was taken only started when the annealer returned to the original temperature that it was at before the doors were opened. Each time a picture was taken, the temperature in the annealer dropped by 14.44 + 3.3*C (26 6 *F)
and it took 162.4 + 15.0 sec for the temperature in the annealer to return to the original temperature before the doors were opened. (In this and the remainder of the paper, the quoted uncertainty is the 95% confidence interval).
-- - - - - -. =~-=----==.-~ -. -I
Figure 5: An image after the glass has been in the annealer at 582*C (1080'F) for 40 min. This shows the annealer setup for all of the experiments, and shows different states of deflection of the different colors of glass.
System 96 glass was used in all experiments. Using the same type of glass was essential to ensure that the chemical structure of the base clear glass base used in all of the different colors of glass is the same. Unfortunately, the exact chemical makeup of the System 96 glass used in this experiment is proprietary. Although it was not possible to know the chemical makeup of the base glass, it was kept consistent between the different colors, ensuring that any observed difference in stiffness was due to the color additives themselves.
4.2 Determining the Testing Temperature
An initial experiment was performed using five colors of glass: clear, opaque white, opaque black, transparent blue, and transparent red. One of each of the colors was laid on the bricks in the annealer as shown in Figure 4.
The annealer was brought up to the annealing temperature of 500*C (930*F). This temperature was held for 30 minutes, then a photograph was taken, and then the annealer was increased to 537*C (1000*F). From this temperature, the process was repeating, increasing the temperature by 15*C (50*F) each time to a maximum temperature of 621*C (1150*F). Figure 6 shows the temperature in the annealer for this experiment.
640
620-5006
0 20 40 60 80
Time from Start of
100 120
Experiment [min]
Figure 6: The temperature vs. time plot shows the program for the annealer for the initial experiment. Each temperature was held for 30 min and then the annealer went to the next temperature as fast as possible. The shape of the curve during the transitions between temperatures were not measured.
The deflection of the center point of each glass strip during the experiment is shown in Figure 7. 600- 580- 560- 540- 520-(1) C .C 0) CL ' Ca L a) a. E F) 480 I I 140 160 180
1 1 1 1 1 0- 0 0 E -1 _
Selected
0C-2
-Temperature
C (D-3--0 o -4 5 Red (D! 0 White -6Shelf Height
---7 ' 1 480 500 520 540 560 580 600 620 640 Temeperature [ C]
Figure 7: The displacement of the center point of red and white glass strips at varying temperatures. The clear, black, and blue glass all had similar trends as the red glass, so were left off of the graph for clarity. At 621*C (1150*F) the red, clear, black, and blue glass had all reached the bottom of the shelf, and could not move any further. The dashed line at -6.35cm shows the height of the shelf.
This initial experiment showed that the glass did not move at all at 500*C (930*F), confirming that it is indeed the annealing temperature for the glass used. Figure 7 shows the deflection of each the center point of the red and white glass strips at the different temperatures studied in this experiment. From this analysis it is clear that most of the colors act similarly, but that the white is significantly stiffer than the rest of the colors. Even at 621*C (1150*F) the white had not moved very much.
From the results of this initial experiment, the temperature of 582*C (1080F) was chosen for further study. This temperature was chosen because it ensured that noticeable deflection in the glass would be seen, but that it would happen slow enough so that the deflection of the center point could be measured over 180 minutes.
4.3 Experimental Methods
To quantify the difference in stiffness between the five colors of glass, the temperature in the annealer was held constant so that the deflection of the center point of each glass strip over time could be measured. In this experiment, the annealer was brought up to the annealing temperature of 500*C (930*F). Next the annealer was brought up to a temperature of
582*C (1080*F) and this temperature was then held constant. This temperature was chosen as
described in Figure 7. Once the annealer reached this temperature, a picture was taken every 20 minutes. The 20 minutes between pictures was timed from the point at which the temperature
returned to 582*C (1080*F) after the doors had been opened temperature in the annealer throughout the experiment.
for the picture. Figure 8 shows the
I I 1 1 I 1 1 1 1
'I I I I I I
0 20 40 60 80 100
Time [mi
120 140 160 180 200
Figure 8: The temperature in the annealer vs. time. The temperature in 5820C (10800F), but each time the doors of the annealer were opened dropped. As can be seen, the drop in temperature was 47.9 3.40C.
the annealer was held constant at to take a picture, the temperature
5. Results and Discussion
In order to estimate the variability between glass samples, the experiment was performed three times. The deflection of the center point of each strip over time was found by analyzing the pictures using Logger Pro. These data were then used to find a best fit function to describe the deflection of each color as a function of time.
Two types of fits were found. The deflection of the red and white strips of glass was best described with a proportional fit, as described by Equation 4
8(t) = At
The clear, black, and blue glass strips and is a parabolic fit, shown in Equation 5.
8(t) = Bt2 + Ct
(4)
(5)
In both Equations 4 and 5, 8 is the deflection in cm and t is the time in minutes, and, as described above, the deflection was measured at 582*C (1080*F).
Neither Equation 4 nor 5 has a constant term because the deflection was measured from the original position of the center point of the glass strip, and so therefore the initial displacement was zero. 585 580 575 0 2570 (D 0-565 E 560 555 H 55C
7
The time available to perform the experiment was limited by access to the annealer. If the experiment could have been extended, it is possible that the white glass would have a parabolic fit similar to that for all the other colors other than red. The red glass deflected so quickly that its center point hit the bottom in about an hour, thus limiting the number of measurements for this color, and making it difficult to determine if the deflection was quadratic rather than proportional with the time allotted. Figure 9 shows the data and fit for one run of the experiment.
1 0 C -(D~ 4-0 4 0 t 0 -6 -7 0 20 40 60 80 100 Time [min] 120 140 160 180
Figure 9: Deflection of the center point of five different colored glass strips at 582*C (1080*F) vs. time for a
single experimental run. The model fit to the red and white glass data was a proportional fit of the form 6 = At
and the model fit to the clear, black, and blue glass data was a parabolic fit of the form 8 = Bt2 + Ct. The
coefficients from all runs were averaged for the model shown in Figures 10 and 11. The dashed line shows the maximum deflection possible with the experimental setup. The red glass reached this limit between 60 and 80 minutes, and the blue glass reached this limit between 170 and 190 minutes.
The data from each experiment were fit to Equations 4 or 5 depending on the color, and the fit coefficients were averaged for the three runs of the experiment. The red had the largest deflection across all experiments, making it the least stiff color at 582*C (1080*F). The white had the smallest deflection across all experiments, making it the stiffest color at
5820C (10800F). This is shown in Figure 10.
I Red Clear i Black i Blue i White
hT
- - - - - - - --- e----e----
-Shelt Height
0.14 0.12 1 0.1 E 0 0 0 4-a:_ 0.08 -0.06 -0.04 -0.02 -0 Red White
Figure 10: Rate of deflection (absolute value of coefficient A) for the red and white glass strips. The value of
A is significantly greater for the red glass than the white glass, meaning that it moves faster, and therefore is
less stiff. This result was not expected by experience glass blowers, who thought black would be the least stiff.
It was found that there was no statistically significant difference between the model for the black and blue glass, meaning that they have a similar stiffness. The B coefficient for clear was larger than that of black and blue, but when combined with the A term, does not actually produce a statistically different stiffness. Figure 11 shows the analysis for the clear, black, and blue glass.
Black Blue 'C 0.015 0 c 0.01-0 a) I C0)
Clear Black Blue
Figure 11: Bar graphs for the absolute values and uncertainties for the coefficients B and C for the clear, black, and blue glass strips. The values of B between all three colors are very close, but there is no statistically significant different between the black and blue. There is no statistically significant difference (p > 0.05)
between the values for C between the clear, black, or blue glass.
X 10-4 1130
[~~7~~
1.5 c -' 1 E -0.5 0 Clear i I IAlthough the B coefficient for the clear glass is different then that for the black or blue glass, overall there is no statistically significant difference between the three colors. Figure 12 shows the deflection of the center point over time with the uncertainties.
1 rIII 0 1 4-0 C a&,-0-3 4-0 0 C a-5 -6 -I
- Red Clear - Black - Blue -White
'
0 20 40 60 80 100
Time [min]
120 140 160 180
Figure 12: Deflection of the center point vs. time of the final models. The solid line is the model for each color, and the dashed lines are the models when taking into account the uncertainties of each coefficient. The solid and dashed lines for the clear, black, and blue glass all overlap, meaning that there is no meaningful difference between their stiffness.
6. Conclusions
Although glassblowers intuition was that the black and blue glass would be the least stiff, the experiments found that the red glass is the least stiff, the black, blue, and clear have statistically indistinguishable stiffness.
With this knowledge, glassworkers can have a better understanding of how different colors act at high temperatures, and can account for this while they work. These results will also help in understanding how to combine colors. It is easier to work with colors that act similarly, so black, blue, and clear can be used together without feeling much of a difference. However, based on these results, working with red and white together would be very difficult, as their stiffness are very different.
Moving forward, it would be interesting to see if these results are found to be true for glassblowers when working with glass. A qualitative experiment of how large of a bubble can be blown at the same temperature for different colored glass could yield interesting results to see if the difference in stiffness holds up for higher temperatures.
Acknowledgments
The author would like to thank Dr. Barbara Hughey and Peter Houk for their help in devising and executing the experiments. The author would also like to thank everyone in the MIT Glass Lab for their help and support throughout the experiments.
References
[1] "Glass Blowing History - GlassBlowing Art" [Online]. Available:
http://www.historyofglass.com/glass-history/glass-blowing-history/. [Accessed:
16-May-2018].
[2] Houk, P. (2018, March). Personal communication.
[3] Doremus, R. H., "Glasses," Encycl. Appl. Phys.
[4] Bourhis, E. L., "Viscosity," Glass; Mechanics and Technology, Wiley-VCH.
[5] Guloyan, Y. A., "Solidification of Glass in Molding (a Review)."
[6] "DoITPoMS - TLP Library Bending and Torsion of Beams -Symmetrical 3-Point Bending"
[Online]. Available: https://www.doitpoms.ac.uk/tlplib/beam-bending/3_point-bending.php.