IN A NEW TOWN DESIGN
by
DIMITRIOS LEONIDAS STAMATIADIS M. Arch. Akademie der Bildenden Kunste in Wien
(1968)
SUBMITTED IN PARTIAL FULFILLMENT OF THE REQUIREMENTS FOR THE
DEGREE OF MASTER OF ARCHITECTURE
MASSACHUSETTS INSTITUTE OF TECHNOLOGY June, 1970
Signature of Author
Certified by ...
Accepted by ...
Department of Architecture, June 4, 1970
Thesis(Supervisor
.. ... . ... .. Ch irman, Departmental Committee
on Graduate Students
Archives
.ss.INST. rENOV 16 1970
COMPUTER TECHNIQUES FOR STUDYING ACTIVITY LOCATIONS IN A NEW TOWN DESIGN
by Dimitrios Leonidas Stamatiadis
Submitted to the Department of Architecture and Planning on June 4, 1970 in partial fulfillment of the requirements for the degree of Master of Architecture.
The purpose of this thesis, broadly defined, is to study and explore the use of computer techniques in urban design. Based on a specific design for a new town, a subset of the design process dealing with the behavior of urban activities, is
thoroughly described, establishing a set of variables, criteria and rules on which the designer operates.
The generated information and the methods the designer is using in the conventional design process, serve as a subject for the replication of a computer model, using Discourse computer language. The results are used to investigate the comparative performance of the computer technique versus the conventional method, and to draw conclusions that will contribute to further research in Computer aided urban design and especially in the development of the Discourse language.
Thesis supervisors: William L. Porter
Assistant Professor of Architecture John R. Myer
ACKNOWLEDGEMENTS
I would like to take this opportunity to express my gratitude to my thesis supervisors, Professors John R. Myer and William L. Porter, for their assistance, guidance and most valuable criticism in the development of this thesis. I would also like to thank Mr. Chuck Libby and Mr. Wren McMains for their support and advice in structuring the
computer model, and Professor Edward Allen for his criticism and most helpful advice in this thesis. Mrs. Liz Kirby, to whom I am much obliged, contributed to the appearance of this paper through her excellent typing and interest. And last, but not least, I am sincerely grateful to Mr. Tim Lundee and Mr. David Krebs for the computer programing help, and continuous assistance which made the operational part of the model possible.
TABLE OF CONTENTS
ABSTRACT
ACKNOWLEDGEMENTS
A. INTRODUCTION
1. The problem and the approach ... 6
2. Content of thesis... 8
3. Purposes and goals ... 10
4. The Discourse language... 11
B. NEW TOWN DESIGN 1. A Satellite Town of Athens ... 13
2. Description of the Design process ... 15
3. Analysis of a subset: activity behavior ... 19
C. THE COMPUTER MODEL 1. Purposes and goals ... .. .. .. . .... 26
2. Translation of the subset ... ... 27
3. Date requirements ... 41
4. Model structure... 46
5. Model operation ... . ... ... .. 59
D. TESTS AND CONCLUSIONS 1. Tests of model operation... 65
2. Conclusions and future development of model ... .o. 11 3. Computer techniques in Urban Design .. . . ... .. . ... 114
E. 1. Bibliography
(A) I N T R O D U C T IO N :
1. The problem and the approach. 2. Content of thesis.
3. Purposes and goals. 4. The Discourse language.
(1) THE PROBLEM AND THE APPROACH
Until recent years Architecture has been based on the systems of values and techniques nurtured in the first three decades of this
century. In the last few years, however, it has become increasingly obvious that a change in attitude has begun to take place as it has in other disciplines and arts.
Recently, architects have begun to concern themselves with the particular place and time of their buildings; with their contexts, and with the psychological effects of their functions and spaces. They find inspiration not in preconceived ideal concepts, but in the particulars of each situation, including the TIME and place of creation, and USE, the permanence or impermanence of the building, all or in part, the fragmentation of forms and spaces, and the
entire reaction and counter reaction of the buildings and the environment.
"According to the new Physics, the only reality lies in a particular THING in a particular PLACE and in a particular TIME."
The process of locating this "point" is a simultaneous equation satisfying numerous differentials at a common place in space. (2)
For the urban designer, who is dealing with the environment, the variables time, place, use, and relation of the physical forms, become very important during the design process. He has to analyse them systematically, using different methods and techniques, because of their complexity and change. The buildings are not objects to look at, but parts of the environment that cause things and reactions to happen.
A computer technique can be very useful in this area of design, where the designer is not being replaced, but freed from many detailed operations which presently limit the number of alternatives he can consider. The computer can be used to search mechanically for workable combinations of variables whose nature and range have been precisely defined. The planner can begin to design in direct
conjunction with the computer, suggesting solutions whose conse-quences the machine rapidly develops, or asking for possibilities of a certain kind, which are quickly presented to aim for review and revision. (15)
There is very little done in the development of computer techniques in urban design that would help in producing better step-by-step
solutions, than the ones arising from a simultaneous consideration of several objectives by the designer himself.
The intention of this paper is to develop such a computer technique and test it versus a conventional technique. The study will be limited to one specific area of design, considering only a few
There are four major stages in this research: 1st describing 2nd transforming 3rd testing 4th evaluating (2) CONTENT OF THESIS
This thesis presents a complete approach for studying the behavior and location of Urban Activities in the Design for a new town. The major steps discussed are the following:
1. Description of the Design process based on a specific project, A Satellite Town for Athens. * 2. Analysis of the Activity-Actor relationships and
their role during the design process.
3. Translation of a subset of the design process into the Discourse Computer language, and
Description of data requirements.
4. Description of the structure of the model, and its operation.
5. Model testing, output, evaluation of "runs", improvements.
*D. Stamatiadis: "A Satellite Town for Athens", student project, Vienna Academy of Arts, 1968. For more information see
APPR OACH STRATEGY MODE EVALUAT CONCLUS FUTUR IMPROVEM L ION IONS EN ENTS TESTING " R UNS" RESULTS EVALUATION CONCLUSIONS ON DISCOURSE IMPROVEMENTS FUTURE RESEARCH FIGURE 1 URBAN DESIGN NEW TOWN DESIGN ACTIVITY BEHAVIOR-COMPUTER TECHNIQUES DISCOURSE LANGUAGE - T MODN lEL COMPUTER AIDED URBAN DESIGN GENERAL CONCLUSIONS
6. Conclusions on the use of the Discourse language, and the use of computer techniques in urban design. Future research.
(3) PURPOSES AND GOALS
The major purpose of this thesis is to draw conclusions on the use of computer techniques in Urban Design, by developing a computer model that will relieve the urban designer from some repetitive operations during certain stages of the design process. The model will replicate the designer's actions and operational behavior in the activity-location stage of the design process, simulating to a certain extent the conventional design method.
A second purpose is to assist the development of the Discourse computer language by describing the author's experiences and difficulties working with the system, through this research.
Another purpose is to re-evaluate, based on the results generated by the model, the product of a conventional design technique, that operated on the same principles and rules.
The following general goals are to be achieved:
1. Simplicity and explicitness in the descriptive parts of this study.
2. Flexibility of the model-structure for use by other
3. Minimizing cost of the process as compared to conventional processes.
4. The lowest possible ratio of input information to output information of the model.
(4) THE DISCOURSE LANGUAGE
"The Discourse language has been designed as a high level problem oriented language in which the data
structure would be transparent to the user and in which there would be the most manipulations existing in any general purpose computer languages. "
"The major justification for building higher level
languages is to relieve the user of the burden of having to deal with complexities and the communication among
different components of the computer system. " "Discourse has to do with assisting the designer in generating and studying alternative configurations of the environment. These configurations may be the design, the implication of a set of policies which is the heart of the design or a representation of the
environ-ment which is useful in determining what the design problem is. "(5)
"The Discourse statements, whether they be commands or computations are generally interpreted as they are typed, thus giving the user immediate response to his requests or probes into other complex data systems, which are stored and manipulated within the machine." "The Discourse language is an interactive language used with a terminal interface and oriented toward the analysis of interdependent data. It is especially useful in the
analysis of spatially disposed data systems, and because of its flexibility and ease of manipulation is suited to design applications. "(24)
Although the language is usually dealing with studies of large scale environments, because of its flexibility, can be used for studying also small scale environments assisting the urban designer in different stages of the design process.
As in the use of other computer systems, it is important to separate the areas of operation between the computer and the designer, avoiding a misuse of the machine that will generate useless or incorrect results. The criteria by which those areas of action are defined are set up according to the specific problem by the designer, who must have a sense of what
information he needs, and use a clean vocabulary and pre-defined rules.
(B.) NEW TOWN DESIGN
In the case of this study, the design process itself is not as important as the careful description of it, and the analysis of a subset that will serve as a base for the replication into Discourse and the construction of the computer model. Though, in order to make this design process understandable to the reader, it is necessary to go into some depth in describing generally the project and its goals.
(1.) A Satellite Town for Athens 2. Description of the design process 3. Analysis of a subset: activity behavior
1. A SATELLITE TOWN FOR ATHENS
Athens' need for expansion has caused the formation of small unorganized communities on the periphery of the city that have pushed their way through to become towns or suburbs, demanding urban services and recognition of their being part of the city.
To solve this chaotic situation it is proposed to form dense urban centers, on specific locations in and outside the present
borders of the city, around nuclei that will attract development more than other areas. Those urban centers can be called "New Towns" or "Satellite Towns" or even "Towns within a Town" and must be based on a very flexible and change-sensitive system, in order to allow incremental growth, according to site conditions, population characteristics, and time-limits.
The kind, size, and rate of the incremental growth of New
Town will not only depend on the internal circumstances, but will relate strongly to the other New Towns of the area. Some of them will grow to population sites of 50, 000 - 80, 000 people, and others will never grow beyond 2, 000 - 5, 000 people, giving ground for other new TOWNS to develop.
This project deals with the design of an experimental New Town for 25, 000 people located 9 miles southeast of the center of Athens surrounded by low hills being open towards the sea, to the southwest. There is little vegetation, but there are sufficient water sources and a very good climate. The town will attract tourism, the major industry, creating job opportunities for at least 6 months of the year. The rest of the year there will be jobs in light (local) industries, like handi-crafts, boat building or textiles.
The town will also contribute to the decentralization of Athens, attracting a population that will mainly commute daily downtown for work and shopping. Only a small percentage of the residents
of the town will be occupied locally. Although the density of the town will be close to that of downtown Athens it will offer to the inhabitants the advantages of "country living". The New Town won't be self-supporting, but will be strongly dependent on the mother-town, being a satellite of it.
-
v-
--- sZ"' 100 -AA rA Mf. N J -,4. 0 . K~' ---e / r -' -- > '--- -
-FIGURE 2: MAP OF THE GREATER ATHENS
2. DESCRIPTION OF THE DESIGN PROCESS
"Town planning or city design is the general spatial arrangement of activities and objects over an extended area where the client is multiple, the program in-determinate, control partial and there is no state of completion" (14)
The three major steps taken in the design process of the study were the following:
a. 1. The principle of a new Town: general operating rules, criteria, goals.
2. Setting up site-selection criteria.
3. Selection of sites, and study of surrounding areas. 4. Collection of information and statistical data,
population figures, life style predictions, future trends.
5. Study of a flexible organizational system on which the design was to be based.
6. Application of the system to the site: town planning (physical) circulation system, residential areas, urban services, industry.
b. 1. Urban activities: characteristics and behavior. Study of housing patterns and characteristics. 2. Criteria, principles and operating rules for
locating housing.
4. Criteria, principles and operating rules for locating facilities.
5. Tourist industry patterns, characteristics, locatidn.
6. Location of urban activities in the system..
c. 1. Creation of a inajor plan, for 25, 000 people 2. Staging: Study of an incremental growth
strategy for the town.
3. Evaluation, conclusion, future study projections.
a ~-~W V f1. a '1 ~ # -; h
fffY?7~
i&4
AN
Natural Environmental Existing Situation CHARACTERISTICS STATISTICAL DATA LIFE STYLES (Predictions, etc. )
/
DEVELOPED ACTIVITIES (Housing) FIGURE 5DIAGRAMMATIC PRESENTATION OF THE SUBSET OF THE DESIGN PROCESS OF A NEW TOWN
a. 5. THE ORGANIZATIONAL SYSTEM
The major criteria for the system were the following:
(a) Flexibility to adjust to future changes and directions, (b) Allowing incremental growth giving the town a complete
form at any stage of the development, (c) Simplicity and clarity of its elements.
4 *
~ ~ ~
1... ... ... * . . 4 FIGURE 6 1. Center area 2. Residential area3. Service area - light industry 4. Green zone
5. Major artery 6. Service road
The physical form of the system is linear, allowing the town to grow incrementally in both directions, easily adjusting itself to different site conditions and characteristics. The service zone is directly proportional to the center zone, and the center zone to the residential zone, depending upon another.
(3) ANALYSIS OF A SUBSET: ACTIVITY BEHAVIOR
Economic development has brought specialization to the work of men and also to men's activities like work, home, shopping and recreation which are more separated than they have ever been. Homes specialize by race, income, family, like style, size, ages and tastes of residents. Shops cluster or separate according to price, style, variety and type of goods offered, and according to whether they are reached on foot, by cow or by mass transit. Factories and offices gather and separate in complicated rhythms of their own. The great variety of indoor and outdoor amusements distribute themselves in space, according to the markets they serve. (23)
For the study of the behavior of the urban activities during the design process, the designer has to specialize and define the major activities involved and their actors, describe their
characteristics and understand the relations between one another. Then he is grouping them together, interrelating them in different ways and scales, analysing them, and simplifying them. The
understanding of the different actions taking place during the design process, which occur at a specific time and place and in which activities and actors are involved, enables the urban designer to
evaluate his work, improve continuously his design, correct his errors and generate new alternatives.
In every activity there are actors involved that are also participants in other activities. This creates relationships between pairs of activities that are affected by the kinds and numbers of the actors
participating in both, by the desirability to be close together, and by the time cost between each other.
time cost: a function of "distance" divided by speed between two activities
closeness desirability: a -given "weight" to a pair of activities
relationship: a function of the "weight" divided by the "distance"
To be able to describe and understand the behavior of the urban activities, we have to simplify things, dealing from now on only with actors, activities and relationships.
The existence of an activity depends on the actors involved, and the location of an activity on its relationships to the other activities.
The highest the "value" of a relationship the more is the facility attracted towards one direction. Since the weight in a relationship is constant, only the distance, which is a variable, can influence its value.
In the above example, assuming that activity B is to be located the lines between A and B could be imaginative rubber bands that allow B to move freely till it finds the best location,
w w w w
minimizing the total cost (location B - + - + - + d =
minimum). 1 2 3 4
FIGURE 7
The decision making concerning the location and spatial arrangement of urban activities was based on the following list of design goals.
1) Legibility: Increase the degree of legibility of the urban activities as city forms.
2) Accessibility: Decrease cost (time) of moving or communicating between activity locations and increase the degree of choice of mode. 3) Diversity: Increase the range of variation of urban
activities and the spatial mixture of this variation.
4) Adaptability: Decrease the adaptation of urban activities to new functions and increase the degree to which new environmental patterns are generated and evaluated.
The following major activities and their specific location are shown in the "Town Center" plan.
1. Existing church 2. Park 3. New church 4. Nursery school 5. Elementary school 6. Secondary school 7. Sports 8. Swimming pool 9. Gymnasium 10. Open space 11. Shopping 12. Offices 13. Supermarket 14. Agora 15. Theater 16. Bus terminal 17. Parking
18. Light industry, services 19. Main road
10
---'-9 *mo --11 ~4 4 *mom"*it
2
The community facilities are the prime generator of urban activities and the major contributor to the sensuous form
of a town. Therefore, the design and location of these facilities should be coordinated in TIME and SPACE for maximum contri-bution to an ordering of the form and structure of the urban environment.
The decision making for the number, size and kinds and time of appearance of community facilities required to serve the town population is based on statistical information on population, habits, characteristics and life styles of the Greater Athens area. It won't be necessary to describe the process through which the facilities in the"Satellite of Athensiproject were determined, since the computer model won't be an exact replication of the subset of the design process but will represent a typical situation, based on simplified assumptions.
For the purpose of understanding the transformation of statistical information into design assumptions, one typical table is included on user-facility relations.
FACILITY PEOPLE MEN WOMEN YOUNG
Percentage who used the facility once a month Church Theater Parks 49.9 8.4 9.0 Gymnasium Football Athletic 0. 7 2. 7 1.2 38.5 64.3 10.1 6.7 0. 6 5.4 9.6 0.2 0. 2 0. 2 1.8 57.8 3.8 12.2 2. 2 3. 0 1.9
Percentage who used the facility once a week Coffee Shop Confectioners Taverns Restaurants Night Clubs Cinemas 11. 3 22. 7 8.7 3.9 1. 2 40. 6 29.3 0.7 25. 0 23.5 13.9 7.7 7.0 2.8 1.6 1. 1 42. 3 41.0 0. 7 18.0 2.4 1.0 0. 4 37. 4 FIGURE 9
STATISTICAL TABLE OF USERS PARTICIPATION COMMUNITY FACILITIES OF THE ATHENS' AREA(6)
A typical example of the conclusions arrived from the previous table is shown by the number of churches required:
1) size: of every church for 250 users 2) town population: 10, 000 people
3) percentage maximum: 10% bf town population in every mass 4) use: four times monthly (Sundays)
5) first and second mass
Number of churches required: 1, 000/250 = 4
Most of data structure of the simulation model was based on similar mathematical equations but also on other criteria.
(C) THE COMPUTER MODEL
1. Purposes and goals
2. Translation of this subset: activity behavior 3. Data description
4. Model structure
1) PURPOSES AND GOALS
The simulation model of activity behavior serves to study its own practicality as a tool to the Urban Designer during the design process, by indicating the information required to implement it
and by testing and evaluating the results, and their usefulness to the design.
The second purpose of the model is to aid the development of the Discourse computer language by describing the author's experience and difficulties, structuring the model and using the language.
The goals and measures of accomplishment of the model are:
a) The ratio of input data required by the model to output data generated by the model.
b) The accuracy and cost of the latter as compared to direct observation of the variables in question.
c) The applicability of the model to other times and places than that for which it was originally constructed.
(2) TRANSLATION OF THE SUBSET: ACTIVITY BEHAVIOR
For the transformation of this part of the design process into the Discourse system and the construction of the model it is necessary to simplify the variables to be considered, and their characteristics.
The activities are divided into 3 major groups, static (existing), developed (housing) and generated (facilities), and there are 5 major actors (users) participating. The relationships between activities are simplified in weights and the decision-making of their behavior and location is based on rules" The variables, relationships and rules are described in the following pages and are used as a base for the data structure of the model.
*"... reducing the apparent complexity of the observed world to the coherent and rigorous language of mathematical relationships" (9)
ACTIVITIES AND THEIR CHARACTERISTICS
I STATIC ACTIVITIES:
These represent the existing situation, being permanent in their location and characteristics during the operations.
a) Park
landscape areas in general, forest or groups of trees, existing on the site. Used by people, and especially children 1 for'playgrounds.Recreational areas.
b) Water
Small river or lake used mainly as playground and for recreational purposes. Major actor children 1.
c) Traffic
Automobile traffic in general. Local road, serving mainly delivery and shopping. Actor: Households and working men.
II DEVELOPED ACTIVITIES
These are activities, whose existence and location is decided by the designer, who is acting as a developer or agent. The decision making for locating the developed activities is affected by the characteristics and location of the static activities.
a) Lowhous
Low density housing: Residential area of 1-2 stories. All 5 actors participating.
b) Medhous
Medium density housing: Residential area of 3-4 stories. All 5 actors participating.
c) Highous
High density housing: Residential area of 4-6 stories. All 5 actors participating.
III GENERATED ACTIVITIES
Their existence is dependent on their characteristics, location, and number of the developed and generated activities. The time-place arrangement of their location is left totally to the computer according to controls and rules decided previously by the urban designer.
a) Element
Elementary school and kindergarten for 200 pupils. Actor: children 1
b) Second
Secondary school of 500 students. Actor: children 2
c) Religion
Church for 250 people Actor: people
d) Theater
Entertainment areas and restaraunts, theaters, clubs in general.
Actor: people
e) Sports
Areas for athletics and playgrounds. Actor: children 2
f) Commerc
Shopping areas, markets or stores. Commercial activities in general.
Actor: Households
g) Office
Town offices (public service). Professional offices, office space in general.
Actor: working men
h) Industry
Light industry, handi-craft, boat building. Actor: working men
i) Busstop
Bus connections of downtown area (also connections to other surrounding areas)
ACTORS AND THEIR CHARACTERISTICS:
TOTPEOP is the town population* including men, women and children. The number of the population effects mainly the existence and location of the activities:
a) church
religion for every 2000 TOTPEOP b) entertainment
theater for every 450 TOTPEOP
TOTHSHLD is the town households including 1 person families. Their number affects the existence and location of the actirities:
a) commercial
commerc for every 120 TOTHSHLD b) Busstop
Busstop for every 800 TOTHSHLD
TOTMENW represents a percentage of the population employed in the town (10% of TOTPEOP). There are men or women working in, and effecting the activities:
a) office space
office for every 200 TOTMENW b) light industry, services
industry for every 150 TOTMENW
TOTCLD 1 are children of ages 3-11 affecting the existence and location of the activity (23% of TOTPEOP);
Nursery and elementary school Element for every 400 TOTCHLD 1
TOTCHLD 2 are children of ages 12-18 affecting the existence and location of the activities (12% of TOTPEOP):
a) Secondary school
Second for every 750 TOTCHLD 2 b) Athletics, playgrounds
MITLibraries
Document Services
Ph: 617.253.2800 Email: [email protected] http://libraries.mit.edu/docsDISCLAIMER
Page has been ommitted due to a pagination error
FACTORS CONSIDERED FOR GENERATED - ACTIVITIES BEHAVIOR.
Since static-activities are located according to the site conditions and developed-activities according to the designer's own decisions, it is important to describe only the behavior of the generated-activities.
a) Existence:
The appearance of a generated-activity is dependent on: the number of activities of the same kind already existing, and the number of its major actors already existing (in the developed activities). *
b) Priority:
In most cases more than one generated activity makes its appearance at the same time. A method for deciding which one is to be located first is based on importance, necessity to the town and characteristics.
c) Weighting:
After the decision is taken that the generated-activity is to be located, 15 weights are assigned, that represent its closeness,desirability to each of the other activitiesy*A method for assigning those weights to the generated-activities is described separately in this chapter.
* In every generated-activity there are also 5 actors participating, but for simplification reasons, only the major actor has been considered.
** for example: if the activity is an Elementary School, a high value is given to the pair ELEMENT-PARK and a low value to the pair ELEMENT-INDUSTRY.
d) Location:
Through zoning, certain areas are defined for the
location of certain activities. The exact location of the activity is found, according to the weights assigned to the generated-activity, the location of all the other activities, and a
reduction of cost criterion.
e) Spatial Arrangement:
Around the exact location, different spatial arrangements take place for the different generated-activities, according to their space requirements.
The static-activities are related to the rest of the activities only in terms of weights affecting locational decisions. The developed-activities (with 5 actors each) and the generated-developed-activities (with 1
actor each) relate to each other in terms of participating actors,
affecting the existence of the last, and both relate to the rest in terms of weights.
ACTIVITY WEIGHTING
One of the most demanding tasks during the design process is weighting and evaluating various activity-pairs, by attaching particular "values" to those that will affect their behavior and location. The method assign numerical ratings to every
generated activities relating each to all others, including itself. The method of assigning weighted values is adapted from a report entitled "American Electric Power System", (19) dealing with industrial plants.
During the operation, every time an activity is to be located on the grid, its "weight", to every other activity is considered influencing strongly its location. The values of the weights of
the activity pairs vary between 1 (minimum weight) to 30 (maximum weight). The detailed analysis of the method for assigning weights is described in the following pages taking as an example the activity "COMMERC".
As a result 15 weights were given to the activity COMMERC that are to be considered every time the activity is to be located on the grid. Based on the same method 135 (15 x 9) weights were given to the 9 generated activities which are shown in the activity weights table.
PAIR Aver. 100.0 60.6 2. 0 1 COMMERC - COMMERC C 1.00 100.0 100 27 50.0 30. 3 1.5 2 TRAFFIC -" T .70 70.0 60.0 16 33.3 20.2 1.0 3 BUS STOP - B .90 63.0 45.5 12 22.6 13.5 1.0 4 INDUSTRY - I .80 50.4 41.5 11 22.6 13.5 2.0 5 OFFICE - 0 .90 45.4 34.0 9 15.1 9.0 1.0 6 THEATER - " N .60 27.3 21.2 6 7. 6 4.5 1.5 7 WATER - W .90 24.5 16.0 5 7.6 4.5 1.0 8 PARK - P .70 17. 2 12.4 4 5.0 3.0 1.0 9 SECOND- S .60 10. 3 7.7 2 5.0 3.0 1.0 10 ELEMENT - E .90 9. 3 7.2 2 5.0 3.0 2.0 11 RELIGION - " R .80 7.4 6.2 2 2.5 1.5 1.0 12 H. LOW - L .70 5.2 3.9 1 2.5 1.5 1.0 13 H. MEDIUM - M .90 4.7 3.6 1 2.5 1.5 1.5 14 H. HIGH - " H .90 4.2 3.3 1 1.6 1.0 1.0 15 SPORTS - A .80 3.4 2.5 1 FIGURE 10 ACTIVITY COMMERC
ASSIGNING WEIGHT TABLE
TOTAL 365 100%
The preparation of the table follows these steps: Column 1. Column 2. Column 3. Column 4. Column 5. Column 6. Column 7. Column 8.
List activities in order of importance, with the most important at top.
Assign the value of 1. 0 to the least important activity, then assign judged relative value to the one above (n times as important as previous one)
Determine relative importance, by progressive multiplication of the values in column 2, assigning 1. 0 to the least important activity.
Establish a ratio, of each activity, to the top activity, (with value 100. 0).
Assign the value of 1. 0 to the most important activity, then assign judged relative value to the next one (n times as important as the one above).
Determine relative importance (100. 0 the most important) multiplying the column 5 figure by the
column 6 figure just above.
Average column 4 and 6, find total
Calculate percentage of each activity (to the total in column 7) that becomes the assigned weight value of the activity.
(3) DATA REQUIREMENTS
The following tables list all the required data for the structure of the simulation model, including activity characteristics, weighting table and assigning priority weights table. For the
operation of the model all the information has to be given in
terms of numbers, simplifying real life conditions into mathematical equations.
The data structure is simple and easily accessible to the user for corrections and other changes that he wishes to make for testing the model or affecting the results.
FIGURE 11
DEVELOPED ACTIVITIES CHARACTERISTICS
N
M L Character
high density medium density low density general
housing housing housing description
14 9 6 DWE/loc 25% 40% 35% % of loc in residential 5-6 3-4 1-2 stories high each loc 30 35 25 y people 14 9 6 0 households 5 3 2 men working 5 9 7 ' children 3-11 1 6 4 0 children 12-18
name of a o3- .- 'O$
0~~~ db~4D 0
U 4-) r_4 U
nameof general major 00 0 - 0
activity
U
descrip- actor 00
P4 ;-4 r, P4 P-tion involved
ELEMENT E learning children 4 105 420 20 10 2. 0
3-11
SECOND S learning children 10 75 750 5 20 3. 0
12-18
RELIGION R religious people 1 2000 2000 7 6 2. 5
mass
THEATER N entertain- people 1 450 450 3 7 2. 7
ment
SPORTS A athletics children 6 50 300 4 8 2. 2
play 12-18
COMMERC C commer- households 1 120 120 28 5 1. 8
cial shopping
OFFICE 0 working men work- 4 50 200 15 4 1.7
at office ing
INDUSTRY I working at men work- 6 25 150 16 6 2.9
light indus - ing
try,
serv-ices
BUS STOP B bus households 1 800 800 2 8 2. 7
connection
GENERATED ACTIVITIES CHARACTERISTICS FIGURE 12:
ELEMENT E SECOND S RELIGION R THEATER N SPORTS A COMMERC C OFFICE 0 INDUSTRY I BUS STOP B
ACTIVITY WEIGHTS TABLE
= 100 = 100 = 100 = 100 = 100 = 100 = 100 = 100 = 100 FIGURE 13:
ACTIVITY Aver. 100.0 10.0 1. 5 1 COMMERC C 1.00 100.0 100 28 67.0 6.7 1. 5 2 ELEMENT E .80 80.0 73 20 45.0 4.5 1.0 3 INDUSTRY I .90 72.0 58 16 45.0 4.5 2.0 4 OFFICE 0 .90 65.0 55 15 22. 0 2. 2 1.0 5 RELIGION R .40 26. 0 24 7 22.0 2.2 1. 5 6 SECOND S .60 16.0 19 5 15.0 1.5 1.0 7 SPORTS A .70 11.0 13 4 15. 0 1.5 1.5 8 THEATER N .90 10.0 12 3 10.0 1.0 1.0 9 BUSSTOP B .80 8.0 9 2
FIGURE 14: LOCATIONAL PRIORITY OF ACTIVITIES
ASSIGNING WEIGHTS TABLE
3 100%
TOTAL
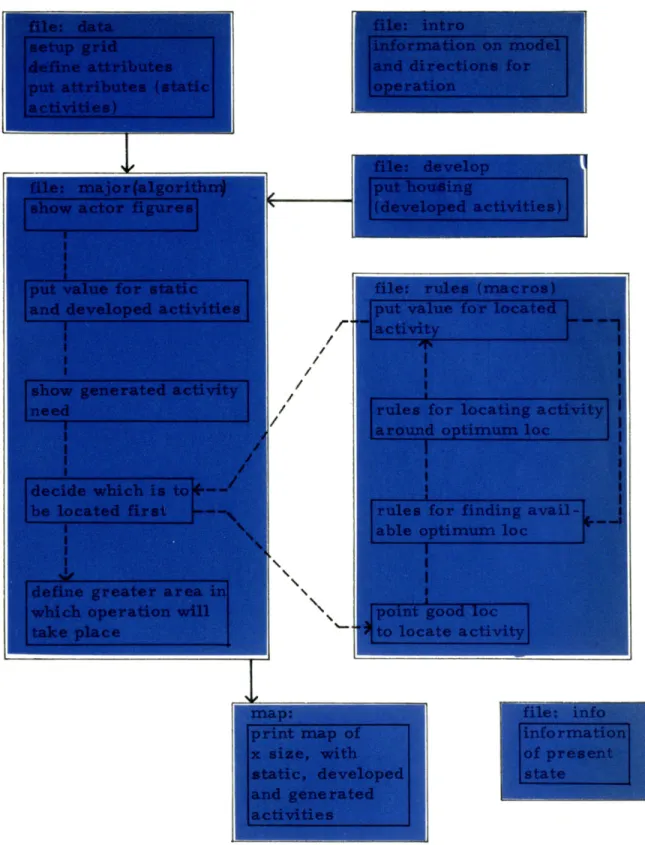
(4) MODEL STRUCTURE
I. DESCRIPTION:
a) Grid Size: The model operates on a grid size of 25 x 40 grid locations that make a total of 1, 000. Each location occupies a square of 100 x 100 feet or 1/4 of an acre. According to the above the area covered by the model is approximately 250 acres of land.
b) Variables: To the 15 main variables considered (Park, Water, Traffic, Lowhous, Medhous, Highous., Element, Second, Religion, Theater, Sports, Office, Commerc, Industry, Busstop) has been assigned characteristics (weights) called "charcons". Each variable has 9 charcons.
II. FUNCTIONS:
a) Definition of area of operation (designer's decision). b) Application of the variable value* at all locations of
the pre-defined area.
c) Linear search for best location considering all the value s.
d) Radial search around best location for optimum and free location.
*Value that exists only temporarily all over the area, has 9 varying characteristics (charvars) that are also the 9 charcons of the 15 main variables.
III RULES
a) Quantitative measures: 1. calculating actor-figures 2. calculating activity-need
b) Locating rules:
1. Decision-making of locational priority 2. locating an activity at optimum loc
A COMPUTER MODEL FOR STUDYING ACTIVITY LOCATIONS IN A NEW TOWN DESIGN
Description INTRO DIMITRI DATA DIMITRI DEVELOP DIMITRI MAJOR DIMITRI RULES DIMITRI INFO DIMITRI
Information on figures and operation of model.
Data requirements for operation of model. Weights of activities, location of static activities, defini-tions of existing situation.
Location of developed activities, divided in 4 stages.
Information on actors and activity-need decision making what and when to locate. Specifies area of operation.
Rules for finding best land (macro activity) and optimum land (macro optimum). Spatial arrangements of different activities.
Information on present state of activities, density figures. File Name
FILENAME FILETYPE MODE NO.REC. DATE DATA DIMITRI Pl 6 6/02 INFO DIMITRI P1 3 6/01 INTRO DIMITRI P1 5 6/01 RULES DIMITRI P1 9 6/03 MAJOR DIMITRI P1 9 6/03 DEVELOP DIMITRI P1 5 5/31 data dimitri SETUP 1 40 1 25 70 60 0
DEFINE WATER 0:* 9: E=8 S=4 R=11 N=2 A=7 C=5 0=2 1=3 B=1
PUT WATER 1,16 2,16 3,16 4,16 5,17 6,17 7,17 8,17 9,17 10,17 11,17 12,'
17 13,17 14,17 15,16 15,17 16,16 16,17 17,16 18,16 19,16 20,16 21,16 '
22,16 23,16 24,16 25,17 26,17 27,17 28,17 29,17 30,17 31,17 32,17 33,'
17 34,17 35,17 36,17 37,17 38,16 39,15 40,14
DEFINE PARK 0:* 9: E=16 S=7 R=20 N=4 A=9 C=4 0=1 1=10 r3=2
PUT PARK 1,1 1,3 1,8 1,9 1,10 1,11 1,12 1,13 1,14 1,15 1,17 1,18 1,' 22 1,23 1,24 1,25 2,1 2,2 2,6 2,14 2,15 2,17 2,18 2,19 3,1 3,2 3,14 3, 15 3,17 3,18 3,21 4,1 4,2 4,14 4,15 5,1 5,2 5,3 5,15 5,16 6,1 6,2 6,3 6,4 6,16 7,1 8,1 9,1 9,24 9,25 10,1 10,2 10,25 11,1 11,2 11,25 12,1 12' ,2 12,3 12,4 12,25 13,1 13,2 13,3 13,24 13,25 14,1 14,2 14,24 14,25 15' ,1 15,12 15,13 15,14 15,25 16,1 16,12 16,13 16,14 17,1 17,11 17,12 17,' 13 17,14 18,1 18,11 18,12 18,13 18,14 19,1 19,12 19,13 19,14 20,1 20,' 12 21,1 22,1 23,1 24,1 25,1 26,1 26,5 27,1 27,3 27,4 28,1 28,2 28,3 28' ,5 29,2 30,1 31,1 33,2 35,1 36,1 37,1 38,1 38,9 38,10 38,15 39,2 39,9 39,10 40,2 40,4 40,8 40,) 40,10 40,11 40,12 40,13
DEFINE TRAFFIC 0:* 9: E=10 S=11 R=8 N=14 A=10 C=16 0=14 1=19 B=10
PUT TRAFFIC 1,19 2,20 2,21 2,22 2,23 2,24 2,25 3,20 4,20 5,20 6,20 7,'
20 8,20 9,20 10,20 11,20 12,20 13,20 14,21 15,21 16,21 17,21 18,21 19,'
21 20,21 21,21 22,22 23,22 24,22 25,22 26,22 27,22 28,22 29,22 30,22 '
31,22 32,22 33,22 34,22 35,22 35,23 35,24 35,25 36,21 37,20 38,20 39,'
20 40,20
DEFINE LOWHOUS 0:* 9: E=6 S=2 R=6 N=1 A=9 C=1 0=1 1=1 B=4
PUT LO1HOUS 6,9 7,7 7,8 8,8 11,12 16,6 22,10 23,11 26,11'
33,12 36,8
DEFINE MEDHOUS 0:* 9: E=4 S=2 R=6 N=2 A=6 C=1 0=1 1=1 B=4 DEFINE HIGHOUS 0:* 9: E=3 S=1 R=5 N=2 A=4 C=1 0=2 1=1 B=5 DEFINE ELEMENT 0:* 9: E=1 S=21 R=21 N=3 A=25 C=2 0=2 1=1 B=7 DEFINE SECOND 0:* 9: E=20 S=1 R=9 N=6 A=17 C=2 0=5 1=1 B=11 DEFINE RELIGION 0:* 9: E=8 S=3 R=1 N=3 A=2 C=2 0=1 1=1 B=2
DEFINE THEATER 0:* 9: E=2 S=12 R=3 N=16 A=3 C=6 0=10 1=1 B=7 DEFINE SPORTS 0:* 9: E=15 S=9 R=1 N=3 A=3 C=1 0=1 f=3 [=2
DEFINE COMMERC 0:* 9: E=2 S=4 R=4 N=25 A=2 C=27 0=27 1=15 B=18 DEFINE OFFICE 0:* 9: E=3 S=11 R=3 N=8 A=2 C=9 0=23 1=5 B=9 DEFINE INDUSTRY 0:* 9: E=1 S=1 R=1 N=l A=l C=11 0=2 1=30 B=8 DEFINE BUSSTOP 0:* 9: E=1 S=1 R=1 N=10 A=l C=12 0=8 1=8 B=10 DEFINE CENTER1 1: 1* DEFINE CENTER2 1: 1* DEFINE TEMPOR 1: 1* DEFINE TEMPOR2 1: 1* DEFINE EXPANSE 0:* DEFINE NEED 0:* 9: 1 = 0. 2 = 0. 3 = 0. 4 = 0. 5 = 0. 6 0. 7 = 0. 8 = 0. 9 = 0. TOTPEOP = 275. TOTCHLD1 = 77. TOTCHLD2 = 44. TOTHSHLD = 66. TOTMENW = 22. DEFINE INDLAND 0*
PUT INDLAND<1,21>... INDLAND<40,25> DEFINE CENTLAND 0*
PUT CENTLAND<1,13>...CENTLAND<4O,25>
DEFINE CULTLAND 0*
PUT CULTLAND<1,13>...CULTLAND<4O,20>
SAY NOW DEVELOP HOUSING -- ACTORS AT PRESENT STATE ARE: EXPAND +$40**TOTPEOP=$3TOTPEOP** TOTCHLD1=$3TOTCHLD1** + EXPAND +TOTCHLD2=$3TOTCHLD2** TOTHSIILD=$3TOTHSHLD** +
EXPAND +TOTMENW=$3TOTMENW /+
SAY PRESENT ACTIVITY STATUS
SET_CARRIAGE_WIDTH 70
TABSET 17 34
EXPAND +$40*HIGHOUS :$3HIGHOUS*.MlEDHOUS :$3MEDHOUS*.+ EXPAND +LO WHOUS :$31LOWHIOUS*/ELEMENT :$3ELEMENT*.+
EXPAND +SECOND :$3SECOND*.RELIGION:$3RELIGION*/+ EXPAND +THEATER :$3THEATER*.SPORTS :$3SPORTS*.+ EXPAND +COtIMERC :$3COMMERC*/OFFICE :$30FFICE*.+
EXPAND +INDUSTRY:$31NDUSTRY*.BUSSTOP :$3BUSSTOP*/+
DENSRES=(TOTPEOP/640)*4 SAY
SAY
EXPAND +$40 RESIDENTIAL AREA DENSITY=$3DENSRES* PEOPLE PER ACRE/+
TOTHOUS=LOWHOUS+MEDHOUS+H I GHOUS
PLOWHOUS= ( LOWHOUS*100 ) /TOTHOUS
PMEDHOUS= (MEDHOUS*100) /TOTHOUS
PHI GHOUS=(HI GHOUS*100)/TOTHOUS SAY
EXPAND +$40 TOTAL HOUSING DEVELOPMIENT=$1TOTHOUS* LOC/+
EXPAND +PERCENTAGE LOWHOUS=$1PLOIIHOUS*/+
EXPAND + " MEDHOUS=$1PHEDHOUS* /+
EXPAND + " HIGHOUS=$1PH IGHOUS*/+
SAY INFORMATION AND FIGURES FOR MODEL SAY
---SAY
SAY GRID SIZE IS 1000 LOC OR 40X25 LOC
SAY EACH LOC=100X100 FEET OR 4LOC=APPROX.1 ACRE SAY
SAY STATIC ACTIVITIES SAY PARK EXISTS AT:133 LOC
SAY WATER :42 LOC
SAY TRAFFIC :L48 LOC
SAY
SAY A. RESIDENTIAL AREA(HOUSLAND):<1,1>...<40,16>: 640 LOC SAY MAX DENSITY ALLOWED IS 57PEOP/ACRE
SAY MAX HOUSING DEVELOPMENT IS 300 LOC
SAY HOUSING:LOWHOUS=105 MEDHOUS=120 HIGHOUS=75
SAY PERCENTAGE: 35 40 25
SAY B. TOWN CULTURAL AREA(CULTLAND):1,13>...<40,20> 320 LOC
SAY (8)ELEMENT:5XIi
SAY (9)SECOND :2X10
SAY (10)RELIGION:5X1
SAY (11)THEATER:20X1
SAY (12)SPORTS:4X6
SAY C. TOWN CENTER AREA(CENTLAND):<1,13>...
<40,25>:
520 LOCSAY (13)COMMERC:23X1
SAY (14)OFFICE:5X4
SAY D. INDUSTRIAL AREAINDLAND):<1,21>...<40, 25>: 200 LOC SAY (15)INDUSTRY:6X6
SAY (16)BUSSTOP:3X1
SAY ACTORS AT MAX DEVELOPMENT ARE:
SAY TOTPEOP: (LOWHOUS*25)+(MEDHOUS*35)+(H I GHOUS*30)=9075
SAY TOTCIILD1:(LOWHOUS*7)+(MEDHOUS*9)+(HIGHOUS*5)=2190
SAY TOT CHLD2:(LOWHOUS*L)+(EDHOUS*6)+(MIEDHOUS*1)=1215 SAY TOTHSHLD: (LOWHOUS*6)+(MEDHOUS*9)+(HIGiOUS*14)=2760 SAY TOTMENW: (LOWHOUS*2)+(MEDHOUS*3)+(HIGHOUS*5)=94t5 SAY
SAY OPERATION
SAY RD DATA ,VALUE ,RULES DIMITRI SAY RD DEVELOP DIMITRI
SAY RD MAJOR DIMITRI( , , , ) SAY MAP*(A 3 C D E ;W) COORD
SAY RD INFO DIMITRI
SAY END PROGRAM OR RD MAJOR AGAIN READ_CONSOLE
BEGIN_MACRO ACTIVITY SUBSTITUTION ON ATTRNUMB LAND=ARG3 POWR=ARG4 RAD=ARG2 Zl=ARG1 C1=Z1-7 SUMI =0. SUMJ=O. SUMT=0.
THROUGH V FOR K=,P= EACH VALUE SUMI=SUMI+K*VALUE<C1 K, P>
SUMJ=SUMJ+P*VALUE<C1 K, P>
V$SU1T=SUMT+VALUE<C1 K, P> SUMJ=SUMJ/SUMT
SUMI =SUM I /SUMT
SUMI=SUMI+0. 05
SUMJ=SUMJ+0. 05
EXPAND +>>>> OPTIMUM LOC:$3SUMI,$3SUM
IF Zl.EQL.8 GOTO POL
IF Z1.EQL.9 GOTO POL IF Z1.EQL.10 GOTO UNO IF Z1.EQL.11 GOTO UNO
IF Z1.EQL.12 GOTO POL
IF Z1.EQL.13 GOTO UNO
IF Z1.EQL.14 GOTO POL IF Z1.EQL.15 GOTO POL IF Z1.EQL.16 GOTO BUS POL$ CONTINUE
EX OPT IMUM(C1, Z1, RAD, LAND, POuR)
IF FLAG.EQL.0 GOTO FIN
SPV=9
IF Zl.EQL.8.OR.Zl.EQL.14 SPV=3
IF Zl.EQL.12.OR.Zl.EQL.15 SPV=5
THROUGH ZAP FOR K=1. 1. SPV
TEMP*=*LAND.ANDN. VALUE
NEAREST TEMP POS U= V= DIST=
IF DIST.LEQ.8 GOTO PZ
EXPAND +ACTIVITY PARTIALLY LOCATED;BUILD
GOTO FIN
PZ$PUT Z1<> U,V
EXPAND + $40$3U,$3V/+
PUT VALUE U,V(Zl<l> Z1<2> Z1<3> Zl<4> Z
Zl<6> Z1<7> Z1<8> Z1<9>) ZAP $ CONTINUE
IF NEED<Cl>.GEQ.O.5 GOTO POL GOTO FIN
UNO$ CONTINUE
EX OPT IMUM( Cl, Zl, RAD, LAND, POWR)
IF FLAG.EQL.0 GOTO FIN
IF NEED<C1>.GEQ.0.5 GOTO UNO GOTO FIN BUS$ CONTINUE HIGH RISE/+
1<5>
J/+ 'PUT BUSSTOP R, P
EXPAND +LOCATED AT:$40$3R,$3P/+
PUT VALUE R,P(Zl<1> Z1<2> Z1<3> Zl<4>
Zl(G> Zl(7> Zl(8> Z1<9>)
NEED<Cl>=NEED<Cl>-1
IF NEED<Cl>.GEQ.0.5 GOTO BUS
FIN$ CONTINUE ENDMACRO
BEGIN_MACRO OPTIMUM FLAG=1
CENTER2*=* NULL
THROUGH LAB FOR 1=3. 1. 10.
CIRCLE I CENTER1<SUMI,SUMJ> *
CENTER1 *=* CENTER1.ANDN.VALUE .ANDN. C
IF CENTER1.EQL.0 GOTO LAB3
GRAVITY CENTER1(<l>>=VALUE<<ARGl>> RADI
FOR POS=EACI RANKED HIGH CENTER1<<l>> G
LAB2$ PUT ARG2<> POS
CONVERT POS Ql=,Q2=
EXPAND +LOCATED AT:$40$3Q1,$3Q2/+
PUT VALUE Ql,Q2(ARG2<1> ARG2<2> ARG2<3> ARG2<6> ARG2<7> ARG2<8> ARG2<9>)
LAB2A$ 1=18 GOTO LAB
LAB3$IF I.EQL.3 EXPAND +RADIAL SEARCH/+ IF I.NEQ.3 EXPAND +></+
LAB$ CENTER2*=*CENTER1
EXPAND +1 = $31/+
IF I.EQL.11 GOTO LAB3A NEED<ARG1>=NEED<ARGl>-1 RETURN
LAB 3A$FLAG=0
EXPAND +SEARCH FAILED /+
ENDMACRO
Zl<5> '
ENTER2. AND .ARGL4
US=ARG3 POlIER=ARG5 OTO LAB2
SUBSTITUTION ON
TOTPEOP=( LOWHOUS*25)+CMEDHOUS*35 )+(HI GHOUS*30)
TOTCHLD1=(LOWHOUS*7)+(MEDHOUS*9)+(HIGHOUS*5) TOTCHLD2=(LOWHOUS*4)+(MEDHOUS*6)+(MEDHOUS*l) TOTHSHLD=(LOWHOUS*6)+(MEDHOUS*9)+(HIGHOUS*14)
TOTMENW=(LOWHOUS*2)+(MEDHOUS*3)+(HIGHOUS*5)
EXPAND +$40**TOTPEOP=$3TOTPEOP** TOTCHLD1=$3TOTCHLD1** EXPAND +TOTCHLD2=$3TOTCHLD2** TOTHSHLD=$3TOTHSHLD** +
EXPAND +TOTMENW=$3TOTMENW /+
NEED<1>=(TOTCHLD1-ELEMENT*420)/420
IF NEED<l> .LES.0.5 NEED<1>=0
NEED<2>=(TOTCHLD2-SECOND*750)/750
IF NEED<2> .LES.0.5 NEED<2>=0
NEED<3>=(TOTPEOP-RELI GI ON*2000)/2000 IF NEED<3> .LES.0.5 NEED<3>=O
NEED<4>=(TOTPEOP-THEATER*450)/450 IF NEED<4> .LES.0.5 NEED<4>=0 NEED<5>=(TOTCHLD2-SPORTS*300)/300
IF NEED<5) .LES.0.5 NEED<5>=0
NEED<6>=(TOTHSHLD-COMMERC*120)/120 IF NEED<6> .LES.0.5 NEED<6>=O
NEED<7>=(TOTMENI-OFFICE*200)/200
IF NEED<7> .LES.0.5 NEED<7>=0
NEED<8>=(TOTMENI-INDUSTRY*150)/150 IF NEED<8> .LES.0.5 NEED<8>=0
NEED<9>=(TOTHSHLD-BUSSTOP*800)/800
IF NEED<9> .LES.0.5 NEED<9>=0
SAY THE ACTORS INCREASE GENERATES THE FOLLOWING ACTIVITI
SET_CARRIAGEWIDTH 70 TABSET 20 40 EXPAND +$40*(8)ELEMIENT=$3NEED<1>*.(9)SECOND=$3NEEDC2>*.+ EXPAND +(10)RELIGION=$3NEED<3>*/(11)THEATER=$3NEED<4>*.+ EXPAND +(12)SPORTS=$3NEED<5>*.(13)COMMERC=$3NEEDC6>*/+ EXPAND +(14)FFICE=$3NEEDC7>*.+ EXPAND +(15)INDUSTRY=$3NEED<8>*.(16)BUSSTOP=$3NEED<9>/+ TEMPOR<1 1, 8>=NEED<1>*20*4 TEMPOR<l 1,9>=NEED<2>*5*10 TEMPOR<l 1,10>=NEEDC3>*7*1 TEMPOR1< 1,11>=NEED<4>*3*1 TEMPOR<l 1,12>=NEED<5>*4*6 TEMIPOR<l 1,13>=NEED<6>*28*1 TEMPOR<l 1,)lI>=NEED<7>*15*4 TEMPOR<l 1,15>=NEED<8>*16*6 TEMPOR<l 1,16>=NEED<9>*2*1 TEMPOR2*=*TEMPOR DEFINE VALUE 9: 1 2 3 I 5 6 7 8 9* PUT EXPANSE<ARG1,ARG2>...EXPANSE<ARG3,ARL4> TERL*=*HIGHOUS.OR.MEDHOUS.OR.LOWHOUS' .OR.PARK.OR .TRAFFIC.OR.IWATER + ES:
VALUE*=*TERL.AND. EXPANSE
FOR T=EACH Q<> IF VALUE<T> PUT VALUE T(Q<1> QC2> Q<3)>
Q<4> Q<5> Q<6> Q<7) Q<8) Q<9>)
X1$ CONTINUE
THROUGH F FOR 1=,Tl= EACH RANKED HIGH TEMPOR2<<1>>
IF TEMPOR<l t,Tl>.EQL.0 GOTO F
EXPAND +<>NOW LOCATE:($3Tl)/+
IF T1.EQL.8 EX ACTIVITY(T1,10,CULTLAND,2.0) IF T1.EQL.9 EX ACTIVITY(T1,20,CULTLAND,3.0) IF T1.EQL.10 EX ACTIVITY(T1,6,CULTLAND,2.5) IF T1.EQL.11 EX ACTIVITY(T1,7,CULTLAND,2.7) IF T1.EQL.12 EX ACTIVITY(T1,8,CULTLAND,2.2) IF T1.EQL.13 EX ACTIVITY(T1,5,CENTLAND,1.8) IF T1.EQL.1l EX ACTIVITY(T1,4,CENTLAND,1.7) IF T1.EQL.15 EX ACTIVITY(T1,6, INDLAND,2.9)
IF T1.EQL.16 EX ACTIVITY(T1,8,INDLAND,2.7)
F$ CONTINUE
TEMP*=*NULL
EXPANS E*=*EXPANSE. ANDN. VALUE
A*=*WATER.OR.HIGHOUS.OR.THEATER.OR.OFFICE.OR.INDUSTRY.OR.EXPANSE B*=*PARK.OR .H1IGHOUS.OR.ELEMENT.OR.SPORTS.OR.COMMERC.OR.EXPANSE C*=*TRAFFIC.OR.ELEMENT.OR.SECOND.OR.THEATER.OR.EXPANSE D*=*LOWHOUS.OR.SECOND.OR.RELIGION.OR.SPORTS.OR.INDUSTRY E*=*MEDHOUS.OR.RELIGION.OR.COMMERC .OR.OFFICE W*=*BUSSTOP
MAPSET STANDARD (1;+) (2;*)(3;X)SMALL (4;L)
(5;M) (9; ) (6;O)SMALL (1 2 3 ;.)ONLY (1 2 ;H)ONLY
(2 3;E)ONLY (3 4;S)ONLY (4 5;R)ONLY (1 3;N)ONLY (2 4;A)ONLY (2 5;C)ONLY (1 5;O)ONLY (1 4;I)ONLY
SAY TO GET MAP TYPE: MAP* (A B C D E;W)
()-()
()-() READCONSOLERETURNEXPANSE*=*NULL
DELETE VALUE DE
IF ARG1.NEQ.1 GOTO FIRST PUT HIGHOUS 1,4 1,5 1,6 1,7 2,3 2,8 2,9 3,3 4,3 4,10 4,11 4,12 4,13 5,10 5,14 6,10 7,10 7,3 7,4 8,3 8,9 9,3 9,9 10,3 10,9 11,4 PUT MEDHOUS 2,4 2,5 2,7 3,4 3,5 3,6 3,7 3,8 4,4 4,5 4,6 5,4 5,11 5,12 5,13 6,11 6,13 6,14 7,5 7,11 8,4 8,5 8,10 8,11 9,4 9,5 9,6 9,10 9,11 10,4 10,5 10,6 10,7 10,10 11,5 11,6 11,) 4 11,10 11,11 12,5 12,6 12,9 12,10 12,11 13,10 PUT LOWHOUS 2,10 3,9 4,7 4, 8 4,9 5,5 5,6 5,7 5,8 6,7 6,8 6,12 6,15 7,6 7,12 7,13 7,14 7,15 8,6 8,7 8,12 8,13 8,14 9,7 9,12 9,13 9,14 10,11 10,12 10,13 10,14 11,7 11,13 12,12 13,11 13,12
FIRST$ IF ARG2.NEQ.1 GOTO SECON
PUT HIGHOUS 14,3 14,4 15,2 15,3 16,2 16,9 16,10 17,2 17,8 18,2 18,8 19,2 19,7 19,8 20,2 20,7 21,2 21,7 22,2 22,3 22,7 23,3 23,7 24,8 24,9 PUT MEDHOUS 14, 5 14,6 15,4 15,5 15, 10 ' 15,11 16,3 16,4 17,3 17,4 17,9 17,10 18,3 18,4 18,9 17,10 19,3 19,9 19,10 20,3 20,4 20,8 20,9 21,3 21,4 21,8 ' 21,9 22,4 22,8 22,9 23,4 23,5 23,8 23,9 24,3 24,4 25,4 PUT LOWHOUS 15,6 15,7 16,5 17,5 18,5 19, 5 19,4 19, 11 20,5 20,10 20,11 20,13 21,5 21,10 21,11 21,12 ' 22,5 22,11 22,12 22,10 22,12 22,13 24,5 24,10 24,11 24,12 24,13 25,5 25,6 25,12 26,6 27,5 SECON$ IF ARG3.NEQ.1 GOTO THIRD
PUT HIGHOUS 28,9 28,10 28,11 28,12 29,9 30,9 31,9 32,9 33,9 34,10 36,11 36,12 36,13 37,11 38,11 39,11 PUT MEDHOUS 27,13 28,13 29,13 29,12 29,11 29,10 30,10 30,11 30,12 31,10 31,11 32,10 32,11 33,10 33,11 34,11' 36 14 37,14 27,13 37,12 38,12 38,13 39,12 PUT LOWHUUS 28, 14 29,14 30,13 30,14 30, 15 31,12 31,13 31,14 32,12 32,13 33,13 34,12 34,13 37,.15 38,14 39,14 39,13
THIRD$ IF ARG4.NEQ.1 GOTO FORTH
PUT HIGHOUS 30,5 31,3 31,4 32,3 33,3 34,2 35,2 36,2 PUT JIEDHOUS 30,6 31,5 31,6 32,4 32, 5 33,4 34,3 35,3 36,3 ' 36,4 36,5 37,3 37,4 38,3 PUT LOWHOUS 32,6 32,7 33,5 33,6 34,4 34,5 34,6 35,4 35,5 36,5 36,6 37,6 37,5 37,7 38,5 38,6 39,5 READCONSOLE
ATTR 0 -- NULL ATTR 1 -- UNIVERSE ATTR 2 -- WATER ATTR 3 -- PARK ATTR 4 -- TRAFFIC ATTR 5 -- LO4HOUS ATTR 6 -- fEDHOUS ATTR 7 -- HIGHOUS ATTR 8 -- ELEMENT ATTR 9 -- SECOND ATTR 10 -- RELIGION ATTR 11 -- THEATER ATTR 12 -- SPORTS ATTR 13 -- COMMERC ATTR 14 -- OFFICE ATTR 15 -- INDUSTRY ATTR 16 -- BUSSTOP ATTR 17 -- CENTER1 ATTR 18 -- CENTER2 ATTR 19 -- TEMPOR ATTR 20 -- TEMPOR2 ATTR 21 -- EXPANSE ATTR 22 -- NEED ATTR 23 -- INDLAND ATTR 24 -- CENTLAND ATTR 25 -- CULTLAND ATTR 26 -- VALUE
(5) OPERATION OF MODEL
a) rd file data: 1) compute and file the data
2) define attributes with charcons or charvons 3) put static attributes (park, water, traffic)
on existing locations
4) define 'zoning" that specifies limitation for the different activites
b) rd file develop:
1) put developed-activities in the grid according to housing patterns
c) rd file rules:
1) read macros ''activity" and "optimum" that contain rules for locating the generated activities.
d) rd file major:
1) through arguments, define the grid area in which operation will take place, ignoring the rest
2) calculate actors participating in the developed activities
3) show figures of actors
4) calculate generated -activity need 5) show numbers of activity need
6) figure out which activity is to be located first, second, third... etc. Locational priorities (ranked command)
7) put value with charvar wherever static or generated activities exist
e) ex macro activity:
1) find best location through linear search, considering the location and charvar of value f) ex macro optimum:
1) find optimum and empty location in area specified by zoning. Circular search around best location (gravity command).
2) locate activity in this location 3) put value on this location 4) go back to macro-activity
g) macro-activity:
h) file major:
i) from console:
j)
rd file info:1) search for more locations around optimum location (nearest command) 2) locate activity in new locations
3) put values in new locations
4) substructuring located activity, from need for this activity, go back to optimum if necessary
5) when all activities of the same kind are located go back to major
1) if other activities are to be located find next one on activity priority list (ranked command)
2) if all generated-activities are located and total need is zero, go back to console
1) decide about map site and variables to appear on the grid (map command)
I
r
FIGURE 15: MODEL STRUCTURE
)
[BEGIN][END]
[END]
FIGURE 16 DECISION RULES FOR LOCATING
[BEGIN] 1. Put value in grid 2. Find center of gravity
ideal loc
[END] 3. Fail to locate activity no empty land available 4. radial search around
ideal loc for empty land [LOOP] 5. find n locs of empty land
6. increase radial search
7. for each n test if optimum loc [LOOP] 8. loc not optimum
9. repeat with next loc
10. loc optimum, put activity test if activity requires additional 1ocs
11. radial search for empty land
[LOOP] 12. if empty put activity 13. increase radial search [END] 14.' put value at loc
MODEL CONTROLS
Changes in the data structure of the model influence strongly the generated results, allowing in this way for the user to
control to a certain extent the operation. The following controls are easily accessible to the user during the design process.
1) Scale (size of each loc) 2) grid size (number of locs) 3) weighting of activity-pairs
4) actors participation in activities 5) actors supporting activity existence 6) weighting of locational priority 7) definition of area of operation
8) definition of area of activity location (zoning) 9) radius of circular search (gravity)
10) rules for locating an activity 11) Power used in gravity command 12) map size, and variables to be shown


![FIGURE 18: ]+NEW INFORM.](https://thumb-eu.123doks.com/thumbv2/123doknet/14444105.517454/115.918.117.747.128.955/figure-new-inform.webp)
