Competition between exchanges: A research agenda
The MIT Faculty has made this article openly available.
Please share
how this access benefits you. Your story matters.
Citation
Cantillon, Estelle and Yin, Pai-Ling. “Competition Between
Exchanges: A Research Agenda.” International Journal of Industrial
Organization 29, no. 3 (May 2011): 329–336. © 2010 Elsevier B.V.
As Published
http://dx.doi.org/10.1016/j.ijindorg.2010.12.001
Publisher
Elsevier
Version
Author's final manuscript
Citable link
http://hdl.handle.net/1721.1/108264
Terms of Use
Creative Commons Attribution-NonCommercial-NoDerivs License
Detailed Terms
http://creativecommons.org/licenses/by-nc-nd/4.0/
Competition between Exchanges: A Research Agenda
1Estelle Cantillon and Pai-Ling Yin
November 2010
1. Introduction
The financial exchange industry has undergone profound changes in the past 20 years. On the technological front, advances in telecommunications and computer power have changed the economics of the business entirely by offering new ways to make markets, greater speed of dissemination of financial information, greater access to exchanges from anywhere in the world, new interfaces allowing traders to route their orders where most profitable and algorithmic trading. On the governance front, most exchanges have moved from a member-owned structure, where users of the exchange were also its shareholders, to a for-profit structure. Many have eventually sought to issue shares publicly. Finally, the industry has experienced an unprecedented wave of entry of new platforms and, at the same time, an unprecedented wave of mergers.2
As the industry is in flux and it is unclear whether the current organization is permanent or transitional, policy-makers must take a stance on merger applications and new regulations to improve the performance of financial markets. For many of these decisions, they combine institutional and industry knowledge with the “standard industrial organization toolkit” of industry analysis.
In this paper, we argue that this toolkit is not sufficient to answer questions such as, for example, the likely or even optimal market structure for the financial exchange industry. There are important gaps in our understanding. Financial exchanges are special because their microstructure is part of their business models. Financial markets are special because of the heterogeneity of trading motives and because of the way in which these markets create value. No “off-the-shelf” IO model integrates these aspects in a way that is useful for policy. The finance literature is of no greater help because it tends to narrowly focus on the trading decision, at the cost of abstracting from the economic implications of the other events surrounding this transaction, and because it has largely taken market structure as fixed and exogenous.
1
Acknowledgements: We are grateful to Hans Degryse, Thierry Foucault, Ginger Jin and Vincent van Kervel for their comments and suggestions. Financial support from ERC grant MaDEM is gratefully acknowledged. 2
Just to name a few recent mergers or acquisitions: the InterContinental Exchange and the International Petroleum Exchange (2001); Euronext and LIFFE (2002); NYSE and Archipelago (2006), Euronext (2007) and NYMEX (2008); the London Stock Exchange and Borsa Italiana (2007); Eurex and ISE (2007); CME and CBOT (2007), and NYMEX (2008); Toronto and Montreal Stock Exchanges (2008); NASDAQ and the Philadelphia Stock Exchange and OMX (2008).
We illustrate these points by focusing on the way exchanges compete for trading. Specifically, we first argue that the combination of finance microstructure and industrial organization can significantly enrich the debate on the “network externality puzzle” (Madhavan, 2000), i.e. why trading in one security does not aggregate in one place. We then discuss how viewing exchanges as multi-sided markets can generate new insights on their price structure. On both topics we suggest questions for further research.
This paper is organized as follows. Section 2 provides a brief overview of the workings of the exchange industry. Section 3 summarizes the lessons from research in finance on the competition between exchanges. Section 4 revisits the “network externality puzzle.” Section 5 discusses the competition implications of exchanges’ multi-sidedness. Section 6 concludes.
2. Financial Markets: The Basics
In this section, we provide a brief overview of how exchanges and market platforms work for the reader who is not familiar with this industry.
To start with, it is useful to recall that the ultimate goal of financial markets is to help individuals, firms and governments manage their inter-temporal inflows and outflows of cash and assets. They do so by aggregating information (so that economic agents can properly optimize) and reducing transaction costs.
2.1. Securities and trading motives
Because financial circumstances are almost as diverse as individuals, there is a very large set of potential financial transactions. For the purpose of this paper, we will focus on two classes of securities: stocks and derivatives. Stocks are issued by firms in exchange for capital. They represent ownership shares in the company. Their value depends on the profitability and ultimate health of this company. Derivatives are financial instruments whose value depends on the value of other more basic instruments or products. For example, a call option on a stock is a contract that gives the holder the right to buy that stock at a given price, within a given time frame. A future on a stock is a promise to buy or sell that stock at a given price and at a given time.
Each security has its “natural” traders: those economic agents whose financial needs it addresses. Thus, for example, derivatives will attract investors who need to hedge a position in the underlying instrument or product. But trading in any security will also attract traders seeking profit opportunities, independently of their intrinsic interest for this security. Speculators trade on the basis of their forecasts about the future movements of prices: they take positions hoping that prices will move in a direction favorable to them. Arbitrageurs are traders who speculate on the price comovements between similar securities.
2.2. Exchanges and other trading venues
Stock exchanges were created in the 18th century to facilitate trading in securities by centralizing transactions and setting rules for how traders reach an agreement (derivatives exchanges emerged in the 1970s). Centralization pools liquidity and makes it easier to find a counterparty.
Each exchange has its own rules covering which securities can be traded, who can participate, and what mechanism is used to match supply and demand and determine the transaction price. There are two broad categories of trading mechanisms: quote driven and order driven. Quote-driven markets are markets where market-makers compete by posting prices at which they commit to buy and sell a given security. Buy and sell orders never interact with one another in a quote-driven market. Instead, buyers and sellers trade with the market-maker who makes a profit from the difference between the bid price and the ask price. This compensates market-makers for the risk they take by holding inventories of the traded security. Market-makers revise their quotes periodically in order to reflect market conditions, the state of their inventory, and competition with other market-makers. Order-driven markets are mechanisms where buy and sell orders interact directly. The price adjusts to changes in the ratio of buy and sell orders. Most electronic markets fall into this category. Typically, traders can place conditions on the execution of their orders. A market order is an unconditional order to execute at the best current available price. A limit order is an order to execute a transaction if the price reaches at least a certain level (for a sell order) or is below a certain level (for a buy order). If these conditions are not satisfied, the order is kept in a so-called “limit order book” until they are met or the trader cancels the order.
Stock exchanges have traditionally had three sources of revenues: transaction fees, trading data sales and the listing fees charged to the companies whose stocks are traded on the exchange.3 Because derivatives exchanges design the securities for which they organize markets, instead of organizing a market for existing securities, they do not get any listing fees. There is much heterogeneity however across exchanges as to the relative importance of these sources of revenues. For example, some exchanges focus on trading services and even organize markets for stocks that they do not list. The transaction fee component of their revenues tends to be bigger and the listing fee component smaller. Others only organize markets for listed companies and are able to extract higher listing fees.
In addition, exchanges have recently tapped new sources of revenues. First, some exchanges have vertically integrated into post-trading (see section 2.3. below). Second, with the emergence of electronic trading, the provision of technology services such as electronic trading platforms has become a source of revenues for some exchanges.
At the end of the 1990s, electronic platforms, initially targeted at institutional investors, emerged as an alternative to traditional exchanges to trade stocks. These platforms, which became known under the name of ECNs (electronic communication networks) concentrated on trading services and did not have the listing and regulatory functions of exchanges. As early as 1996, regulation in the US sought to integrate these ECNs into the rest of the trading infrastructure. In particular, ECNs in the US can choose to be regulated as broker-dealers or as an exchange (many have chosen this second option). In Europe, the entry of ECNs in trading services was greatly deregulated with the implementation of the Markets in Financial Instruments Directive (MiFID) in 2007.
3
In the traditional model, exchanges only organize markets for companies that apply for listing and satisfy the criteria for listing.
2.3. Post-trading: Clearing and Settlement
Once a trade has been executed on an exchange, the clearance and settlement process begins. The details of the trade are sent to a clearing house. Clearing houses register and aggregate trades to establish who owes what to whom. Netting—the process by which net positions of market participants are derived by summing up all their buy and sell orders—reduces settlement values and transaction costs dramatically. Clearing houses also offer other services, such as acting as central counterparty (the buyer to every seller and the seller to every buyer). By this process, a clearing house replaces the original bilateral contract by two bilateral contracts and guarantees the trade.
Derivatives are special among securities because no money is exchanged at the time of transacting. Delivery and payment take place at maturity. Because economic conditions may have changed between the time of the transaction and the maturity, ex-ante beneficial trades are usually no longer ex-post beneficial for one of the parties. To remove the resulting incentives to default, clearing houses require that derivatives traders deposit margins as collateral. These margins are updated daily in a way that eliminates traders’ incentives to default.
The final step in the transaction is its settlement. Settlement is the process by which the legal ownership in the traded asset is transferred. It is carried out by a depositary. The depositary acts as a “securities bank” that holds physical securities in custody and holds accounts of their ownership.
As suggested above, some exchanges are vertically integrated into most, if not all, post-trading activities. Diversity rules again, however. Any configuration between the full “silo model” where an exchange is vertically integrated with clearing and settlement, and the “horizontal model”, where exchanges have equal and non exclusive access to the post-trading infrastructure, is possible.
3. What do we know from the finance literature?
The finance literature has long studied competition between trading venues. In fact, the academic debate on this subject dates back at least to Demsetz (1968) and Smidt (1971) in the context of the creation of the NASDAQ. Simply put, the question then was whether competition between market-makers or monopoly for the provision of trading services would maximize the performance of financial markets. The main arguments in favor of monopoly are scale economies and the presence of network externalities in trading. Indeed, it is easier to find a counterparty in large markets. The price impact of a transaction also tends to be smaller in markets that attract higher trading volumes. This reduces transaction costs. The main argument in favor of competition is the competitive pressure it places on the transaction fees charged by the exchanges.
This debate was revived following the entry of electronic communication networks (ECNs) in the United States in the 1990s and the deregulation of trading activities in Europe with the implementation of MiFID. In both cases, the entry of these alternative trading platforms in direct competition with exchanges has led to the fragmentation of trading volumes across venues. The literature has focused on measuring the impact of this fragmentation on market
performance. Typically, this is done by regressing measures of market quality of cross-sections of stocks on measures of fragmentation (typically, the Herfindahl-Hirschman index of the trading shares of the stock across trading venues or the fraction of trading outside of the exchange where that stock is listed) and other control variables. This empirical approach has two major shortcomings, however. First, fragmentation is likely to be endogenous as competition tends to be higher for high volume and more liquid stocks.4 Second, because the market microstructure and transparency of the competing electronic platforms often differ from the market microstructure and transparency of the incumbent exchange, exact causal relationships are hard to pin down: is the observed change in market quality the result of increased competition and fragmentation, or the result of the change in transparency? These shortcomings notwithstanding, it is probably safe to say that there is a broad consensus among finance academics that the entry of ECNs has brought more benefits to financial markets (in terms of pressure on fees, product innovation, transparency and liquidity) than costs (for a survey, see Biais, Glosten and Spatt, 2005).
One of the most interesting findings of this literature, and one that has attracted increased attention lately, is that competition has also resulted in self-selection of traders according to their information (Easley, Kiefer and O’Hara, 1996, Bessembinder and Kaufman, 1997, Barclay, Henderschott and McCormick, 2003, Reiss and Werner, 2005), trading motive (Madhavan, 1995), trading status, or access to routing technology (Foucault and Menkveld, 2008). These findings are very important because they add a new dimension to the monopoly versus fragmentation debate: sorting has consequences itself on market quality, independently on the level of fragmentation. Moreover, sorting raises redistributive concerns (between e.g. professional or institutional investors and retail investors) and calls for additional measures of market performance than those used traditionally to evaluate the welfare consequences of competition.5
A key feature of the existing finance literature is its focus on short-term phenomena. Typical finance datasets cover a very short time span. Likewise, the theoretical literature tends to take market structure and market microstructure as fixed when it evaluates the consequences of competition. It does not explain the market structures we observe.
One exception is the small historical finance literature on the competition between trading venues, which, by design, emphasizes longer run structural changes. These historical accounts emphasize the role of exchange strategies and of changes in the population of traders in explaining the failures and successes of exchanges. Caskey (2004), for example, argues that the Philadelphia Stock Exchange was successful at keeping a critical mass of trading in NYSE stocks because it took advantage of restrictions imposed on membership by the NYSE and leveraged technological innovation such as automated order routing services aimed at attracting order flow from discount brokers earlier than its competitors. Biais and Green (2007) argue that municipal bonds and corporate bonds, which used to be traded on the
4
The few papers that are able to overcome this endogeneity problem have found that fragmentation hurts market quality (e.g. Henderschott and Jones, 2005, Bennett and Wei, 2006).
5
Market performance for a security is usually measured by its liquidity, its volatility and the time it takes to return to equilibrium after a shock. These measures are related to the ultimate goals of financial markets. Highly liquid stocks, for example, command a price premium which means a lower cost of capital for the issuing firm.
NYSE, left the exchange for the opaque over-the-counter market following the rise of institutional trading in these securities. They also show that such migration had welfare costs in terms of higher transaction costs for retail investors.
Taken together, these two strands of the literature suggest that exchanges and trading venues respond to their environments, in particular to the heterogeneity of traders, and that these strategic responses shape the market structure of exchange services. In the next two sections, we explore two aspects of this competition between exchanges, which are better understood through a combination of industrial organization and finance.
4. Revisiting the Network Externality Puzzle
In his survey of the market microstructure literature, Madhavan (2000) coined the term “network externality puzzle” to refer “to the fact that many markets are fragmented and remain so for a long period of time, despite strong economic arguments for consolidation.” (p. 226) This fact is all the more surprising since it coexists with a very long series of failed attempts by exchanges to organize trading in assets already traded at other exchanges.
The previous section has mentioned some answers recently provided by the finance literature. As we move our focus away from the single market at hand to bring exchange strategies and market organization into the picture, other explanations come forward. To help organize the following discussion, it is useful to think of each of these explanations as contributing to one (or more) of the three generic countervailing forces to network effects: trader heterogeneity and the resulting exchange differentiation, switching costs and split-order incentives.
4.1. Trader heterogeneity
As soon as traders are heterogeneous, an opportunity for differentiation and thus for market coexistence arises. In his classic paper, Pagano (1989) explored the scope for vertical differentiation between two trading venues, one attracting more trades and traders with a high value for liquidity but charging higher fees in return.
As discussed in section 3, the subsequent empirical literature has focused on information as the main source of trader heterogeneity and self-sorting into trading platforms. This literature has highlighted the interplay between the microstructure of the markets and the types of traders they attract.6
An underexplored source of differentiation, at least empirically, concerns product scope and geography (see Economides and Siow (1988) for a theoretical treatment). Product scope matters because increased netting opportunities in the post-trading stage, or simply convenience, can make a trader prefer to trade an asset on the exchange where he already trades other products. Geography matters for two reasons. First, regulation on cross-border access to exchanges can create artificial differences among traders in terms of costs of accessing these exchanges (Cantillon and Yin, 2010, document how geography and the state of regulation affects membership choices at two exchanges). Second, technology is changing how geography affects competition as fast connections become an ever more critical aspect
6
of trading services in the presence of algorithmic trading.7 Anecdotal evidence suggests that algorithmic trading is having an effect on exchange location decisions and on investment in technology.8 Horizontal differentiation provides one explanation for the coexistence of trading of identical assets on two exchanges, even when they have the same microstructure. Finally, it is worth mentioning that even within a country, regulation can introduce an artificial differentiation of traders. For example, until 2007, several European countries implemented a so-called concentration rule under which retail orders were required to be executed on a regulated market, thereby de facto excluding alternative trading venues from this source of orders (Davies, Dufour and Scott-Quinn, 2006). Likewise, Germany had a default rule which required financial intermediaries to execute retail orders on a regulated exchange unless told explicitly otherwise (Gomber and Gsell, 2006).
4.2. Switching costs
Switching costs create inertia in the market structure and thus could explain both the long term coexistence of trading venues for the same assets, and the high barriers to entry that seem to exist in this industry.
Switching costs can arise at the level of trading and at the level of post-trading. At the level of trading, switching requires that a trader be able to send his order easily to the competing trading venue. To do so, this trader would traditionally need to be a member of that competing trading venue. Such a membership requires training, set-up costs and involves some regulatory and certification costs as well. However, intermediation and the development of order-routing technologies have increasingly allowed traders to avoid these trading-related switching costs.
When two competing exchanges use different clearing houses, switching costs also arise post-trading. First, a trader needs to be a member of the clearing house of the competing trading venue or connect to a firm that is. This switching cost is the equivalent of the switching cost arising at the trading level. More importantly for derivatives, margins create switching costs because they are collected on net open positions. Thus, when the two exchanges use different clearing houses, it is in the interest of a trader who has already open positions on one exchange to continue to trade on that exchange.
There is no academic study on the importance of switching costs for the competition between exchanges, but anecdotal evidence and comparisons of market structures with different clearing arrangements suggest that the switching costs arising at the post-trading stage are very important. A recent note by the US Department of Justice (DoJ) concludes from its analysis of several entry episodes that successful entry and coexistence of trading on different exchanges are more likely when identical contracts are fully fungible across exchanges so
7
Depending on the source and the asset, algorithmic trading is currently thought to be responsible for between 40 and 70% of trading activity
8
For example, The Economist reported that “as most of the European [algorithmic traders] are located in London, Deutsche Börse announced an upgrade of its connection between Frankfurt and London (…). Similarly, NYSE Euronext moved its European data centre from Paris to London”. (August 9, 2009)
that positions can be netted and margins reduced.9 The DoJ note goes on to conclude that “the control exercised by futures exchanges over clearing services (…) has made it difficult for exchanges to enter and compete in the trading of financial futures contracts.” (Department of Justice, 2007). Switching costs are at the heart of this argument.
4.3. Market impact and split-order incentives
There is one last subtle force working towards maintaining two active exchanges, once each has acquired a critical mass of trading. The idea, crystallized by Ellison and Fudenberg (2003), is simple: when markets attract different types of traders and these traders prefer to be in a market with fewer traders of their types (in other words, there is some within-side competition), there exists a range of equilibrium allocations of these traders among different trading places. These coexistence equilibria are stable because each trader is strictly better off in its chosen market than switching to the other market (and moving prices adversely in that market as a result, an effect they call “market impact”).
One of the applications that Ellison and Fudenberg consider is an extension of Pagano’s (1989) model of trading venue choice. Like in the original model, traders use markets to diversify their endowment risks and commit to a trading venue before this risk is realized. Unlike the original model however, traders are ex-ante asymmetric: some are more likely to end up on the buying side, other are more likely to be on the selling side. Ellison and Fudenberg show that there typically exists a range of equilibria where trading is split across the two markets.
In Pagano’s model, traders choose where to trade before endowments are realized, suggesting high switching costs for trading ex-post. Foucault and Menkveld (2008) show how the mechanics of limit order books with time priorities (which are typical of electronic trading platforms) generate similar “market impact” effects without such switching costs. In their model, liquidity traders decide where to place their limit orders. Because orders with the same limit prices are executed in the order of their submission, these liquidity traders may want to place their order in the “smaller” market if this increases the probability that their limit order is executed. Foucault and Menkveld argue that such microstructure-induced split-order incentives and the development of smart split-order routers that can exploit these incentives explain the fragmentation of trading in Dutch stocks between the London Stock Exchange and Euronext.
The above models assume that the demand for trading is exogenous. In practice, trading is largely endogenous. The mere fact that the same product is traded on several exchanges generates arbitrage opportunities and thus trading volumes.10 It is an open question to what extent such arbitrage activity helps coexistence persist.
9
The DoJ’s conclusions rely on the analysis of three failed entries in the US futures market where clearing houses had exclusive agreements with the exchanges (BrokerTec versus CBOT and Eurex versus CBOT for US Treasury bonds and notes, Euronext.Liffe’s versus CME for Eurodollars futures), and the coexistence of trading venues for US stock options and US equities (U.S. DoJ, 2007).
10
One of the market participants we interviewed for our study on the Battle of the Bund (Cantillon and Yin, 2010) claimed that the arbitrage activities of his firm had generated up to 10% of the trading volume on the entrant exchange, DTB.
4.4. New questions
We have now reviewed a long series of forces that counter the aggregation force of network effects in the exchange industry. In addition, there are structural factors that decrease the network effects, such as intermediation (Galetovic and Zurita, 2002, Cantillon and Yin, 2010) and the development of smart routing technologies that allow traders to access the market offering the best price at every moment in time (Stoll, 2006). So where does this leave us? First, it is now clear that there are a lot of reasons why markets for the same assets can coexist and that some of these reasons have changed over time. In that sense, there is no longer any “network externality puzzle”. What is less clear is to what extent these factors influence outcomes in any single market, or put differently, to what extent we can predict which markets will concentrate and which will coexist.
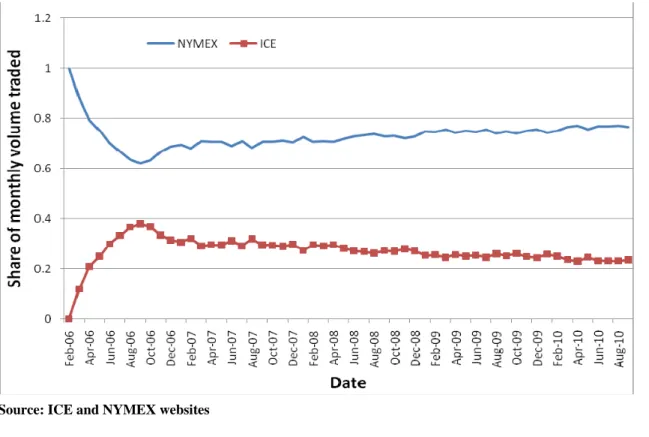
To illustrate, Figures 1-3 show the market shares of competing exchanges for three derivatives: the Bund, a future on the long-term government bond in Germany; the future on the West Texas Intermediate (WTI) light sweet crude oil contract; and the future on the Nikkei 225 stock index. In all three cases, the clearing houses differ between the competing exchanges so that switching costs are likely to be high. At the same time, the Bund market did tip after a long plateau, whereas coexistence prevails and might be the long term outcome for the other two markets.
Part of the difficulty, of course, lies in understanding the relative importance of these factors in determining traders’ choices of market venue. Cantillon and Yin (2010) provide a first step in this direction by studying the determinants of traders’ membership choice at DTB and LIFFE during the 1990s.11 Their analysis exploits the large variation in exchange strategies and regulation over this period to pin down their impact. One of their main results is that trader heterogeneity along the horizontal dimension (which includes product scope, geography and other trader characteristics) dominates trader heterogeneity in the value for liquidity in explaining membership choice. This result rationalizes the long plateau equilibrium observed in Figure 1. It does not, however, explain why the market eventually tipped despite both exchanges attracting a distinct set of traders.
11
Membership is distinct from the choice of where to send an order. A membership at one exchange allows a trader to route an order to this exchange without using a broker.
Figure 1: Market shares in Bund futures trading volume
Source: Thomson Reuters Datastream
Figure 2: Market shares in the Nikkei 225 future
Source: Thomson Reuters Datastream12
12
In order to match units, SIMEX volumes were halved to reflect the smaller size of SIMEX Nikkei 225 futures contracts (500 yen * index) relative to OSE (1000 yen * index). The CME contracts were the same size as
Likewise, a superficial analysis of the Nikkei 225 market (Figure 2) suggests that trader heterogeneity, in particular because of geography, has played a key role both in explaining why the Osaka Stock Exchange was able to get a big share of the market from the very beginning (because it served the Japanese market that the Singapore International Monetary Exchange - SIMEX - was not reaching effectively) and why the market remains segmented geographically. However, all three exchanges now offer electronic trading and have similar operating hours, and traders are less geographically segmented than 20 years ago. This raises the question of whether the current coexistence is sustainable.
The competition between NYMEX and the InterContinental Exchange (ICE) for the WTI future also raises interesting questions because the success of ICE to gain a significant share of the WTI contract contrasts with the failure of NYMEX to get any critical mass in the Brent crude oil contract, a similar contract for which ICE is the incumbent.13
Figure 3: Market Shares in the WTI future
Source: ICE and NYMEX websites
SIMEX contracts and were adjusted accordingly. The US-denominated Nikkei 225 futures contracts (US$5 * index) were converted to yen based on monthly average exchange rates from Datastream and then converted accordingly to OSE equivalents. On July 18, 2006, OSE introduced the Mini Nikkei 225 future (100 yen * index), so these volumes were divided by 10 and then added to the standard OSE Nikkei 225 futures volume to determine OSE Nikkei 225 futures volumes. In November, 2006, SGX added a US dollar-denominated Nikkei 225 future equivalent to the CME version. In January 1, 2008, SGX added a Mini Nikkei 225 future of the same size as the OSE Mini Nikkei 225 future. These contract volumes were adjusted and added accordingly to exchange volumes for Nikkei 225 futures trading.
13
Some observers have argued that ICE was able to get a critical mass of trading in the WTI because it introduced reductions in margin requirements, for traders trading both contracts on the ICE. These make it cheaper for traders trading the Brent on the ICE to also trade the WTI. Others have argued that ICE’s success lies in its ability – through lower margin requirements – to attract speculative trading.
Clearly, we need to better understand how the factors described in sections 4.1.-4.3 explain traders’ choice of where to route their orders and how this depends on the asset traded. A second implication of our analysis is that we need to better understand what market structure and exchange strategies are likely to arise at equilibrium and their properties. In other words, we need to start endogenizing market structure. Here, the issues seem familiar for an industrial organization audience. Exchanges are industries that combine network effects, large fixed costs, switching costs and differentiation. Thus, we can expect many of the same issues that arise in this type of industries: multiple equilibria, importance of beliefs and history, biased technological choices, and ambiguous welfare results. A few papers apply this approach to study the market structure in the exchange industry (e.g. Di Noia, 2001, Juranek and Walz, 2010).
One important subtlety, however, is that the market microstructure is part of the business model of an exchange and, as such, a choice variable.14 Thus simply applying tools of industrial organization will not be sufficient. As far as understanding competition among exchanges is concerned, there are obvious benefits to reap from integrating insights from the financial microstructure literature into an industrial organization approach to exchanges.15
5. Exchanges as Multi-sided Markets
Exchanges are multi-sided markets in at least two respects. First, stock exchanges need to attract listings from firms to attract trading in these stocks. Likewise, firms will be attracted to list on an exchange if the exchange is able to attract sufficiently enough trading to provide for a liquid secondary market for their stocks. Second, the heterogeneity of traders’ motives also introduces multi-sided aspects at the trading level: liquidity suppliers are better off in markets that also attract liquidity demanders, and vice versa.16 In both cases, looking at the competition between exchanges through the lens of multi-sided markets can provide new insights.
We first consider how the listing’s activity of exchanges affects the competition in trading. One standard insight from the two-sided market literature (e.g. Rochet and Tirole, 2006 or Rysman, 2009 for general introductions) is that pricing on one side of the market will depend not only on the elasticity of demand on that side of the market but also on the value of “consumers” of that side for the other side. Everything else kept constant, prices will be lower, the more this side contributes to the other. Although there is a significant literature on the competition for listings, we are not aware of any paper that integrates the two-sided aspects of the problem. Foucault and Parlour (2004) come closest as they view exchanges
14
This is not totally unknown in industrial organization. This feature is found in other settings where market places compete such as online auction sites (Haruvy et al., 2008), sport cards (Jin and Kato, 2007), or realty intermediaries (Hendel, Nevo and Ortalo-Magné, 2009). As in finance however, the bulk of the research has looked at outcomes, taking the design of these markets as given.
15
See Colliard and Foucault (2010) for an attempt in this direction. 16
Following Rochet and Tirole (2006), trading will be multi-sided if the fee structure - e.g. how much is charged to liquidity suppliers and to liquidity demanders – matters beyond the price levels. This will be the case in financial markets if there are market frictions and trading is endogenous.
both as setting listing fees and choosing a technology that will ultimately affect trading costs. They focus on the vertical differentiation of exchanges according to trading costs and listing fees to reduce the pressure of competition.
Derivatives exchanges are notoriously more profitable than stock exchanges. Table 1 provides the operating ratios for a few US and European stock and derivatives exchanges that confirm this view. Could the two-sided structure of stock exchanges be one explanation?17 Certainly, the existence of a listing side to stock exchanges is likely to put greater pressure on transaction fees at stock exchanges than at derivatives exchanges, where prices are only set with a view to maximize profits from trading activities. On the other hand, the elasticity of the demand for trading may also differ between stock exchanges and derivatives exchanges, due to the nature of the products traded. This could be the reason for the lower profitability of stock exchanges. Demand elasticities cannot explain everything, however. The three US stock option exchanges in Table 1 (namely, NYMEX, CBOE and ISE), which do have significant overlap in products traded, have tended to outperform US stock exchanges during most of the decade.18
Table 1 Profitability of equity vs. derivative exchanges
EQUITY 2009 2008 2007 2006 2005 2004 2003 2002 2001 NASDAQ 18% 18% 15% 15% 18% 10% 16% 26% 22% NYSE 6% 21% 22% 10% 3% 0% 4% 1% n/a Euronext 37% 33% 23% 28% 24% 17% Xetra 29% 49% 57% 57% 45% 40% 27% 8% 16% LSE 42% 48% 52% 52% 41% 35% 34% 36% 34% DERIVATIVES CME 61% 62% 60% 57% 58% 51% 39% 38% 31% CBOT 44% 28% 20% 31% 20% n/a NYMEX 65% 61% 55% 38% 21% 10% 14% 3% Eurex 47% 59% 62% 66% 50% 43% 56% 48% 37% ISE 38% 44% 39% 38% 33% 4% -20%
CBOE 42% 44% 40% 27% 10% n/a n/a n/a n/a
Notes: Profit margins are calculated as operating income/total revenues (excluding exceptional items), based on annual reports. Rows are merged following a merger or an acquisition. When possible, derivatives and stock trading activities are separated. Xetra is the cash equity market of Deutsche Boerse. NASDAQ: Numbers include the stock derivatives activities of AMEX until 2004 and the derivatives activities of the Boston Stock Exchange, the Philadelphia Stock Exchange and OMX AB as of 2008. NYSE and Euronext: The Euronext numbers include the derivatives activities of LIFFE as of January 1, 2002. NYSE and Euronext merge in April 2007. The numbers include the stock options activities of Amex as of October 1, 2008. LSE: The numbers include the stock derivatives activities of EDX London from 2003 onwards, and the derivatives and energy trading of IDEM and IDEX as of 2008. CME / CBOT / NYMEX: the top 2008 number includes the activities of NYMEX as of August 23, 2008. The bottom number is based on the second quarter 10-Q, 6 months, ending
17
With the exception of indices, derivatives exchanges do not require the authorization of the issuer of the underlying instrument to organize trading in a derivative based on this instrument.
18
Another popular explanation for the profitability differential lies in scale economies and the fact that trading volumes in derivatives are booming.
June 30, 2006. Eurex / ISE: ISE numbers include stock trading as of September 2006. CBOE: numbers include stock trading activities as of 2007.
Sources: 10-K filings, annual reports, company websites, and Thomson Reuters Datastream.
Analyzing competition between exchanges from the angle of two-sided markets clearly opens up a lot of new research questions and begs for a different assessment of competition (on the danger of applying standard “one-sided” logic to two-sided markets, see Wright, 2004). For example, most of the competition between stock exchanges is between exchanges that have a listing function and trading platforms that do not perform such a role. How does this affect the interdependency between the listing business and the trading business of stock exchanges? To what extent does the decoupling of the two affect pricing incentives by the two exchanges? Should listing still be controlled by exchanges?19
Finally, we turn to the multi-sidedness induced by trader heterogeneity. Pricing by exchanges, by which we mean their fee structure, is a much less studied topic. Some fees observed in practice do suggest a two-sided motivation, however. One example is scratch trade fees, which are reduced fees targeted at day-traders trading on the floor when they close their positions with a negative profit.20 Such reduced fees can only be explained on the basis of the liquidity provided by these traders. Likewise, the current regular fees for stock trading on the NYSE are lower for transactions adding liquidity than taking liquidity.21 Foucault, Kadan and Kandel (2009) offer a first analysis of exchanges’ fee structure in that direction.
6. Concluding Comments
Financial markets are in flux and this is not only because of the current financial crisis. Technology has dramatically changed the economics of this industry by facilitating the entry of alternative trading venues, changing the role of geography in differentiating exchanges, reducing switching costs and more generally facilitating the routing of traders’ orders to different exchanges simultaneously.
As policy-makers worldwide begin to address pressing issues on the optimal organization of financial markets, scientific understanding of these issues needs to increase.
In this short paper, we have described a series of open questions at the interface between industrial organization and finance. To recap: How does trader heterogeneity affect market structure? How important are switching costs? What explains why some assets trade in multiple trading venues while others concentrate? How do the complementary activities to trading, such as post-trading, listing and data sales, affect the economics of the trading industry? The priority should be to get a better understanding of the demand for trading and endogenize market structure to be able to derive normative implications for regulation and competition policy interventions.
19
On this point, see Macey and O’Hara (2002). 20
LIFFE for example had such a scheme in place for locals (the name given to day-traders who are members of the exchange and trade on the floor) until 1998.
21
Answering these questions requires that we take a broader view of exchanges than what is traditionally done in the finance literature. At the same time, any analysis will need to account for the fact that the microstructure of exchanges is part of their business models. Studying exchanges is like studying any other industry: it requires a minimum understanding of the institutional environment. IO economists should overcome their qualms about studying financial markets.
References
Barclay, M., T. Hendershott and D.T. McCormick (2003). “Competition among Trading Venues: Information and Trading on ECNs,” Journal of Finance, 58, 2637-2665. Bennett, P. and L. Wei (2006). “Market Structure, Fragmentation and Market Quality –
Evidence from Recent Listings Switches,” Journal of Financial Markets, 9, 49-78. Bessembinder, H. and H. Kaufman (1997). “A Cross-Exchange Comparison of Execution
Costs and Information Flow for NYSE-Listed Stocks,” Journal of Financial
Economics, 46(3), 293-319.
Biais, B., L. Glosten and C. Spatt (2005). “Market Microstructure: a Survey of
Microfoundations, Empirical Results and Policy Implications,” Journal of Financial
Markets, 8(2), 217-264.
Biais, B. and R. Green (2007). “The Microstructure of the Bond Market in the 20th Century,” IDEI Working Papers 482, Institut d'Économie Industrielle (IDEI).
Cantillon, E. and Yin, P. (2010). “Competition between Exchanges: Lessons from the Battle of the Bund.” Mimeo.
Caskey, J. (2004). “The Philadelphia Stock Exchange: Adapting to Survive in Changing Markets,” Business History Review, 78, 451-487.
Colliard, J.E. and T. Foucault (2010). “Securities Market Structure, Trading Fees, and Investors’ Welfare,” mimeo.
Chemmanur, T. and P. Fulghieri (2006). “Competition and Cooperation among Exchanges: A Theory of Cross-Listing and Endogenous Listing Standards,” Journal of Financial
Economics, 82(2), 455-489.
Davies, R., A. Dufour and B. Scott-Quinn (2006). “The MiFID: Competition in a New European Equity Market Regulatory Structure,” in Investor Protection in Europe:
Corporate Law Making, The MiFID and Beyond, eds. G. Ferrarini and E. Wymeersch;
Oxford University Press, 163-197.
Degryse, Hans, Mark Van Achter and Gunther Wuyts (2009), Dynamic Order Submission Strategies with Competition between a Dealer Market and a Crossing Network, Journal
of Financial Economics, 91, 319-338
Demsetz, H. (1968). “The Cost of Transacting,” Quarterly Journal of Economics, 82(1), 33-53.
Di Noia, C. (2001). “Competition and Integration among Stock Exchanges in Europe: Network Effects, Implicit Mergers and Remote Access,” European Financial
Management, 7, 39–72.
Easley, D., N. Kiefer and M. O'Hara (1996). “Cream-Skimming or Profit-Sharing? The Curious Role of Purchased Order Flow,” Journal of Finance, 51(3), 811-33. Economides, N. and A. Siow (1988). “The Division of Markets Is Limited by the Extent of
Liquidity (Spatial Competition with Externalities),” American Economic Review, 78(1), 108-121.
Ellison, G. and D. Fudenberg (2003). “Knife-Edge or Plateau: When Do Market Models Tip?,” The Quarterly Journal of Economics, 118(4), 1249-1278.
Galetovic, A. and F. Zurita (2002) “Liquidity and the Simple IO of Stock Exchanges,” Instituto de Economia PUC Working Paper No. 211; CEA Working Paper No. 123.
Gomber, P. and M. Gsell (2006). “Catching Up with Technology—The Impact of Regulatory Changes of ECNs/MTFs and the Trading Venue Landscape in Europe,” Competition
and Regulation in Network Industries, 1(4), 537–557.
Foucault, T., O. Kadan and E. Kandel (2009), Liquidity cycles and Make/Take Fees in Electronic Markets, mimeo
Foucault, T. and A. Menkveld (2008). “Competition for Order Flow and Smart Routing Systems,” Journal of Finance, 63(1), 119-158.
Foucault, T. and C. Parlour (2004). “Competition for Listings,” RAND Journal of Economics, 35(2), 329-355.
Haruvy, E., P. Popkowski Leszczyc, O. Carare, J. Cox, E. Greenleaf, W. Jank, S. Jap, Y. Park and M. Rothkopf (2008). “Competition between Auctions,” Marketing Letters, 19(3-4), 431-448.
Hendel, I., A. Nevo and F. Ortalo-Magné (2009), “The Relative Performance of Real Estate Marketing Platforms: MLS versus FSBOMadison.com,” American Economic Review, 99(5), 1878–98.
Henderschott, Terrence and Mendelson (2000), Crossing Networks and Dealer Markets: Competition and Performance, Journal of Finance, 55(5), 2071-2115
Hendershott, T and C. Jones (2005). “Island Goes Dark: Transparency, Fragmentation, and Regulation,” Review of Financial Studies, 18(3), 743-793.
Jin, G. and A. Kato (2007). “Dividing Online and Offline: A Case Study,” Review and
Economic Studies, 74, 981-1004.
Macey, J. and M. O’Hara (2002), “The economics of stock exchange listing fees and listing requirements,” Journal of Financial Intermediation, 11(3), 297-319
Madhavan, A. (1995). “Consolidation, Fragmentation, and the Disclosure of Trading Information,” Review of Financial Studies, 8(3), 579-603.
Madhavan, A. (2000) “Market Microstructure: A Survey,” Journal of Financial Markets, 3(3), 205-258.
Pagano, M. (1989), “Trading Volume and Asset Liquidity,” Quarterly Journal of Economics, 104, 255-274.
Reiss, P. and I. Werner (2005). “Anonymity, Adverse Selection and the Sorting of Inter-dealer Trades,” Review of Financial Studies, 18(2), 599-636.
Rochet, JC and Jean Tirole (2006), “Two-sided markets: a progress report,” Rand Journal of
Economics, 37(3), 645-667.
Smidt, S. (1971). “Which Road to an Efficient Stock Market?” Financial Analysts Journal, 27(5), 18-20, 64-69.
Stoll, Hans (2006), Electronic Trading in Stock Markets, Journal of Economic Perspectives, 20(1), 153-174
United States Department of Justice (2007), Review of the Regulatory Structure Associated with Financial Institutions, in response to Department of the Treasury request TREAS-DO-2007-0018, http://www.usdoj.gov/atr/public/comments/229911.htm. Wright, Julian (2004), “One-sided logic in two-sided markets,” Review of Network